Home > Comparison > Healthcare > ABT vs MDT
The strategic rivalry between Abbott Laboratories and Medtronic plc shapes the healthcare medical devices industry’s future. Abbott operates a diversified model spanning diagnostics, pharmaceuticals, nutrition, and devices, while Medtronic focuses on specialized device-based therapies across cardiovascular, surgical, neuroscience, and diabetes segments. This analysis pits Abbott’s broad exposure against Medtronic’s focused innovation to identify which trajectory delivers superior risk-adjusted returns for a diversified portfolio.
Table of contents
Companies Overview
Abbott Laboratories and Medtronic plc stand as titans in the global medical devices sector, shaping healthcare innovation worldwide.
Abbott Laboratories: Diversified Healthcare Innovator
Abbott Laboratories commands a broad healthcare footprint with four revenue streams: pharmaceuticals, diagnostics, nutrition, and medical devices. Its core strength lies in diagnostic and cardiovascular devices, driving global sales. In 2026, Abbott focuses strategically on expanding remote patient monitoring and rapid diagnostic technologies, enhancing its competitive edge in personalized healthcare solutions.
Medtronic plc: Device-Based Therapy Leader
Medtronic specializes in device-based medical therapies, emphasizing cardiovascular, surgical, neuroscience, and diabetes care portfolios. It generates revenue mainly through implantable cardiac devices and advanced surgical technologies. The company’s 2026 strategy prioritizes robotic-assisted surgery and integrated AI systems, aiming to deepen its clinical partnerships and improve patient outcomes globally.
Strategic Collision: Similarities & Divergences
Both companies excel in medical devices but diverge in approach: Abbott pursues a diversified product ecosystem, while Medtronic emphasizes specialized, high-tech therapies. Their primary battleground is cardiovascular care, where innovation and device efficacy dictate market share. Abbott offers broader healthcare exposure; Medtronic provides focused innovation, creating distinct investment profiles grounded in diversification versus specialization.
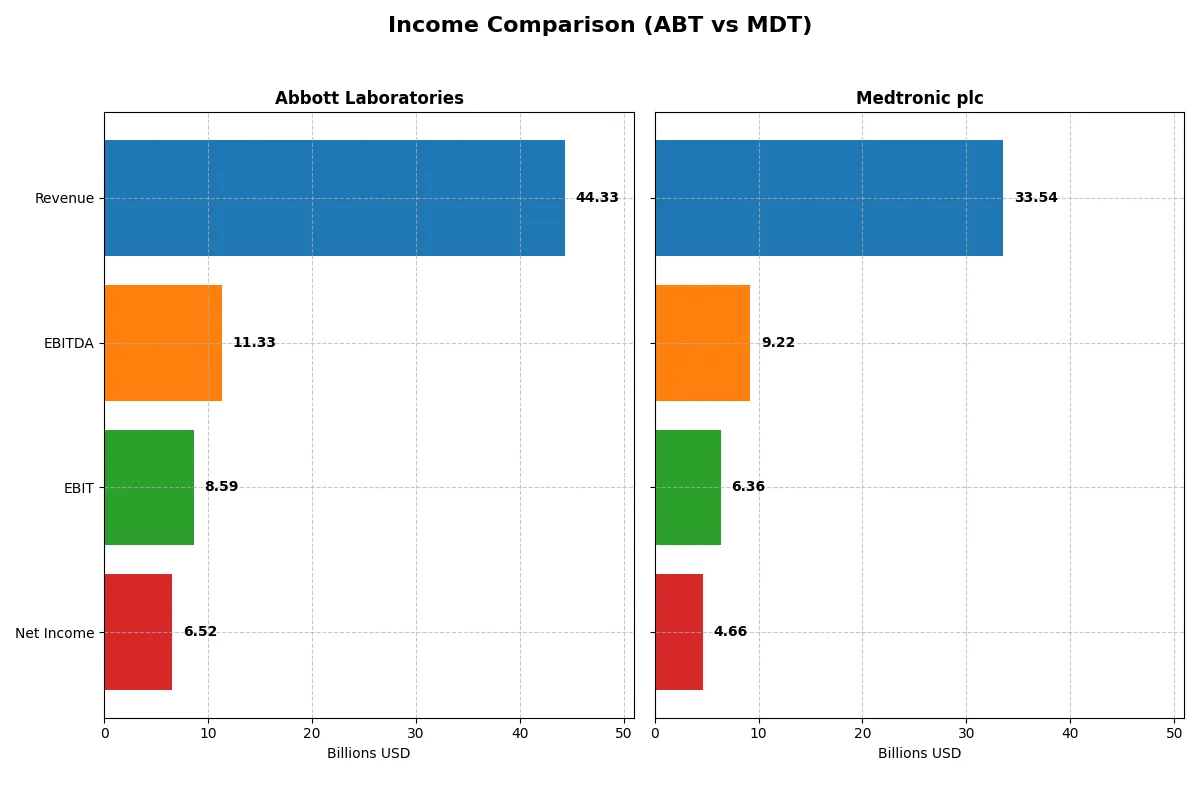
Income Statement Comparison
This data dissects the core profitability and scalability of both corporate engines to reveal who dominates the bottom line:
| Metric | Abbott Laboratories (ABT) | Medtronic plc (MDT) |
|---|---|---|
| Revenue | 44.3B | 33.5B |
| Cost of Revenue | 19.7B | 11.6B |
| Operating Expenses | 16.6B | 15.9B |
| Gross Profit | 24.6B | 21.9B |
| EBITDA | 11.3B | 9.2B |
| EBIT | 8.6B | 6.4B |
| Interest Expense | 341M | 729M |
| Net Income | 6.5B | 4.7B |
| EPS | 3.74 | 3.63 |
| Fiscal Year | 2025 | 2025 |
Income Statement Analysis: The Bottom-Line Duel
This income statement comparison reveals the true operational efficiency and profitability momentum of Abbott Laboratories and Medtronic plc.
Abbott Laboratories Analysis
Abbott’s revenue climbed steadily from $43B in 2021 to $44.3B in 2025, yet net income dipped overall, with a sharp fall in 2024 to $13.4B followed by a return to $6.5B in 2025. Its gross margin remains strong at 55.5%, but net margin contraction and a 54% EPS drop in 2025 signal margin pressures and operational challenges despite improving EBIT growth.
Medtronic plc Analysis
Medtronic’s revenue expanded consistently from $30.1B in 2021 to $33.5B in 2025, with net income rising sharply from $3.6B to $4.7B. Its superior gross margin at 65.3% and healthy EBIT margin near 19% underpin solid profitability. Medtronic shows robust margin expansion, a 22% net margin increase, and a 31% EPS surge in 2025, reflecting efficient cost control and growth momentum.
Margin Strength vs. Growth Resilience
Medtronic outperforms Abbott in both revenue and net income growth, with favorable margin expansion and earnings acceleration. Abbott, despite higher revenue scale, struggles with declining net margins and EPS volatility. For investors prioritizing consistent profit growth and operational efficiency, Medtronic’s profile appears more attractive and fundamentally sound.
Financial Ratios Comparison
These vital ratios act as a diagnostic tool to expose the underlying fiscal health, valuation premiums, and capital efficiency of the companies compared below:
| Ratios | Abbott Laboratories (ABT) | Medtronic plc (MDT) |
|---|---|---|
| ROE | 28.1% | 9.7% |
| ROIC | 9.9% | 6.1% |
| P/E | 14.6 | 23.4 |
| P/B | 4.1 | 2.3 |
| Current Ratio | 1.67 | 1.85 |
| Quick Ratio | 1.23 | 1.42 |
| D/E | 0.32 | 0.59 |
| Debt-to-Assets | 18.8% | 31.1% |
| Interest Coverage | 11.3 | 8.2 |
| Asset Turnover | 0.52 | 0.37 |
| Fixed Asset Turnover | 3.58 | 4.91 |
| Payout Ratio | 29% | 77% |
| Dividend Yield | 1.96% | 3.29% |
| Fiscal Year | 2025 | 2025 |
Efficiency & Valuation Duel: The Vital Signs
Financial ratios function as a company’s DNA, unveiling operational strengths and hidden risks critical for investment decisions.
Abbott Laboratories
Abbott Laboratories displays a solid net margin of 14.72%, signaling efficient profitability despite zero reported ROE and ROIC, which raises concerns. The stock trades at a stretched P/E of 33.55, suggesting premium valuation. Shareholder returns include a modest 1.88% dividend yield, balancing limited payout with reinvestment in R&D at 6.7% of revenue.
Medtronic plc
Medtronic posts a favorable net margin near 13.9% and a cautious ROE of 9.71%, reflecting moderate profitability. Its P/E of 23.37 appears fairly valued against sector peers. Medtronic maintains a stronger dividend yield at 3.29%, supported by robust liquidity ratios and a balanced capital structure, indicating reliable shareholder distributions.
Valuation Stretch vs. Operational Balance
Medtronic offers a more balanced risk-reward profile with solid profitability, prudent valuation, and higher dividend yield. Abbott’s premium valuation and weak equity returns suggest greater risk despite operational efficiency. Investors focused on income may prefer Medtronic’s stable payout; growth-oriented profiles might weigh Abbott’s reinvestment strategy carefully.
Which one offers the Superior Shareholder Reward?
I compare Abbott Laboratories (ABT) and Medtronic plc (MDT) focusing on dividends, payout ratios, and buybacks. ABT yields around 1.9% with a moderate payout ratio near 63%, signaling balanced dividend sustainability. MDT pays a higher yield near 3.3%, but its payout ratio exceeds 76%, indicating less margin for dividend growth. Both firms execute share buybacks, yet ABT’s stronger free cash flow coverage and lower payout ratio suggest a more resilient distribution model. MDT’s higher dividend yield is attractive, but ABT’s prudent capital allocation favors long-term value. I conclude ABT offers a superior total return profile for 2026 investors.
Comparative Score Analysis: The Strategic Profile
The radar chart reveals the fundamental DNA and trade-offs of Abbott Laboratories and Medtronic plc, highlighting their core financial strengths and weaknesses:
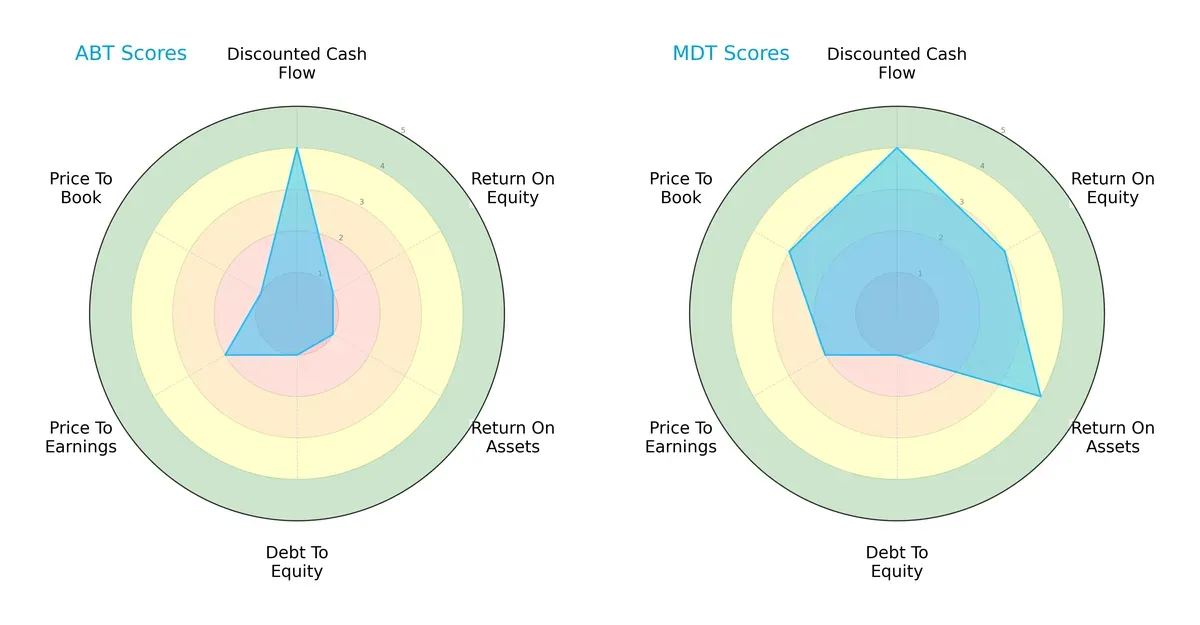
Medtronic shows a more balanced financial profile with moderate to favorable scores in ROE (3) and ROA (4), whereas Abbott relies heavily on discounted cash flow strength (4) but struggles with profitability and leverage metrics (ROE 1, ROA 1, Debt/Equity 1). Both companies have moderate valuation scores, but Medtronic’s higher price-to-book score (3) suggests better market confidence. Overall, Medtronic’s diversified financial health outperforms Abbott’s narrow edge in cash flow valuation.
Bankruptcy Risk: Solvency Showdown
Medtronic and Abbott both sit safely above the distress threshold, but Abbott’s Altman Z-Score (5.23) indicates a stronger solvency cushion compared to Medtronic’s (3.11):
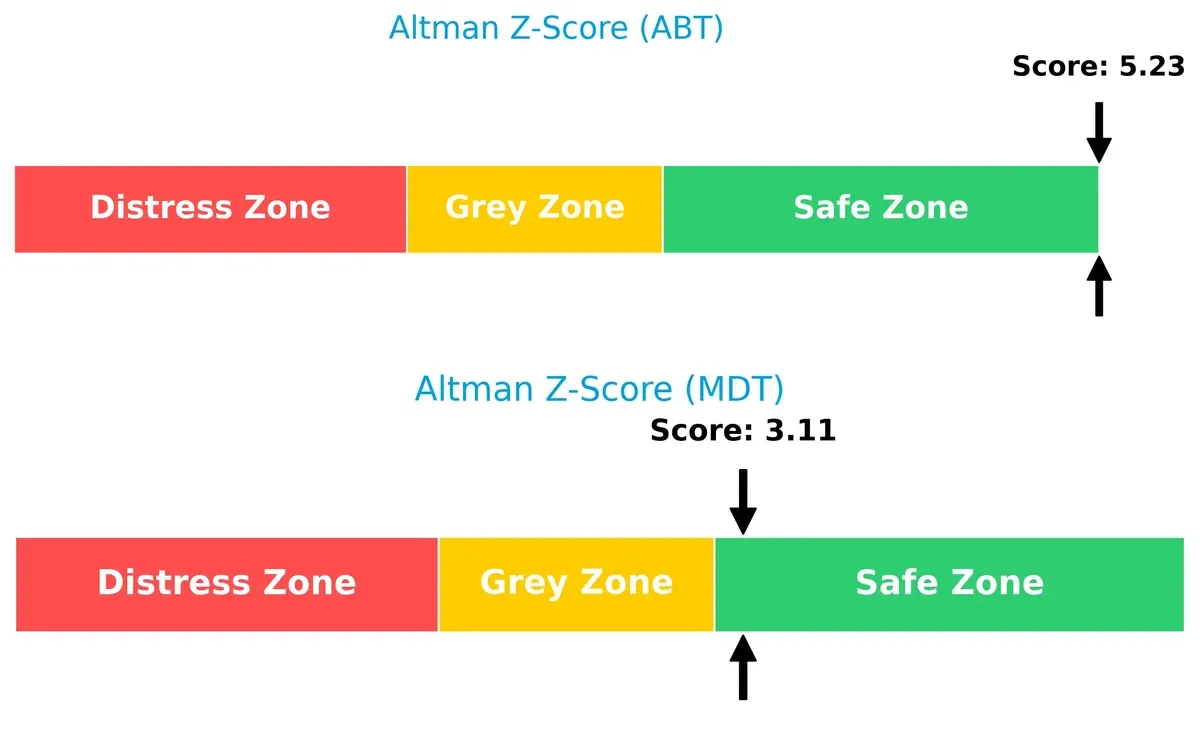
Abbott’s higher score signals robust financial stability, reducing bankruptcy risk significantly in this cycle. Medtronic remains safe but closer to the grey zone, warranting cautious monitoring of leverage and liquidity.
Financial Health: Quality of Operations
Medtronic edges out Abbott with a Piotroski F-Score of 7 versus 6, reflecting stronger operational quality and fewer red flags:

I observe Abbott Laboratories balances revenue across Medical Devices ($18.99B), Diagnostic Products ($9.34B), Nutritional Products ($8.41B), and Established Pharmaceuticals ($5.19B). Medtronic pivots heavily on Cardiac and Vascular ($12.48B) and Neuroscience ($9.85B), with less diversity overall. Abbott’s wider spread reduces concentration risk. Medtronic’s reliance on a few core segments signals strong infrastructure dominance but exposes it to sector-specific volatility.
Strengths and Weaknesses Comparison
This table compares the Strengths and Weaknesses of Abbott Laboratories and Medtronic plc:
Abbott Laboratories Strengths
- Diversified product portfolio across diagnostics, pharmaceuticals, devices, nutrition
- Strong global presence with balanced US and Non-US revenue
- Favorable net margin of 14.72% indicates profitability
- Low debt-to-assets ratio and high interest coverage demonstrate financial stability
Medtronic plc Strengths
- Solid diversification in cardiac, diabetes, surgical, and neuroscience segments
- Favorable ROIC vs. WACC supports efficient capital use
- Healthy current and quick ratios reflect liquidity strength
- Favorable dividend yield at 3.29% appeals to income investors
- Strong fixed asset turnover shows efficient asset use
Abbott Laboratories Weaknesses
- Unfavorable ROE and ROIC point to weak capital returns
- Unfavorable P/E ratio suggests potential overvaluation
- Poor liquidity ratios (current and quick) raise short-term risk concerns
- Unfavorable asset turnover indicates inefficiency in asset use
Medtronic plc Weaknesses
- ROE remains below benchmark, indicating room for profitability improvement
- Neutral P/E and PB ratios suggest modest valuation appeal
- Asset turnover is unfavorable despite other efficiency metrics
- Moderate debt-to-assets ratio implies balanced but present leverage risk
Abbott shows strength in global diversification and profitability but struggles with capital efficiency and liquidity. Medtronic’s strengths include efficient capital use and liquidity, though it faces challenges in asset turnover and returns. These contrasts shape each company’s strategic focus on operational efficiency and financial health.
The Moat Duel: Analyzing Competitive Defensibility
A structural moat is the only true safeguard protecting long-term profits from relentless competition erosion. Here’s how Abbott Laboratories and Medtronic stack up:
Abbott Laboratories: Diversified Product Portfolio Moat
Abbott leans heavily on intangible assets and product diversification, reflected in stable gross margins near 55.5%. However, declining ROIC signals potential erosion of this advantage by 2026.
Medtronic plc: Innovation-Driven Operational Moat
Medtronic’s moat derives from continuous innovation and operational efficiency, shown by a growing ROIC trend and robust gross margin above 65%. This bodes well for moat deepening in new device markets.
Innovation Resilience vs. Diversification Stability
Medtronic’s growing ROIC and innovation edge provide a deeper moat than Abbott’s fading returns from diversification. Medtronic is better positioned to defend and expand market share into 2026.
Which stock offers better returns?
The past year revealed contrasting trajectories: Abbott Laboratories declined steadily while Medtronic plc gained, with both stocks showing decelerating momentum near recent highs and lows.
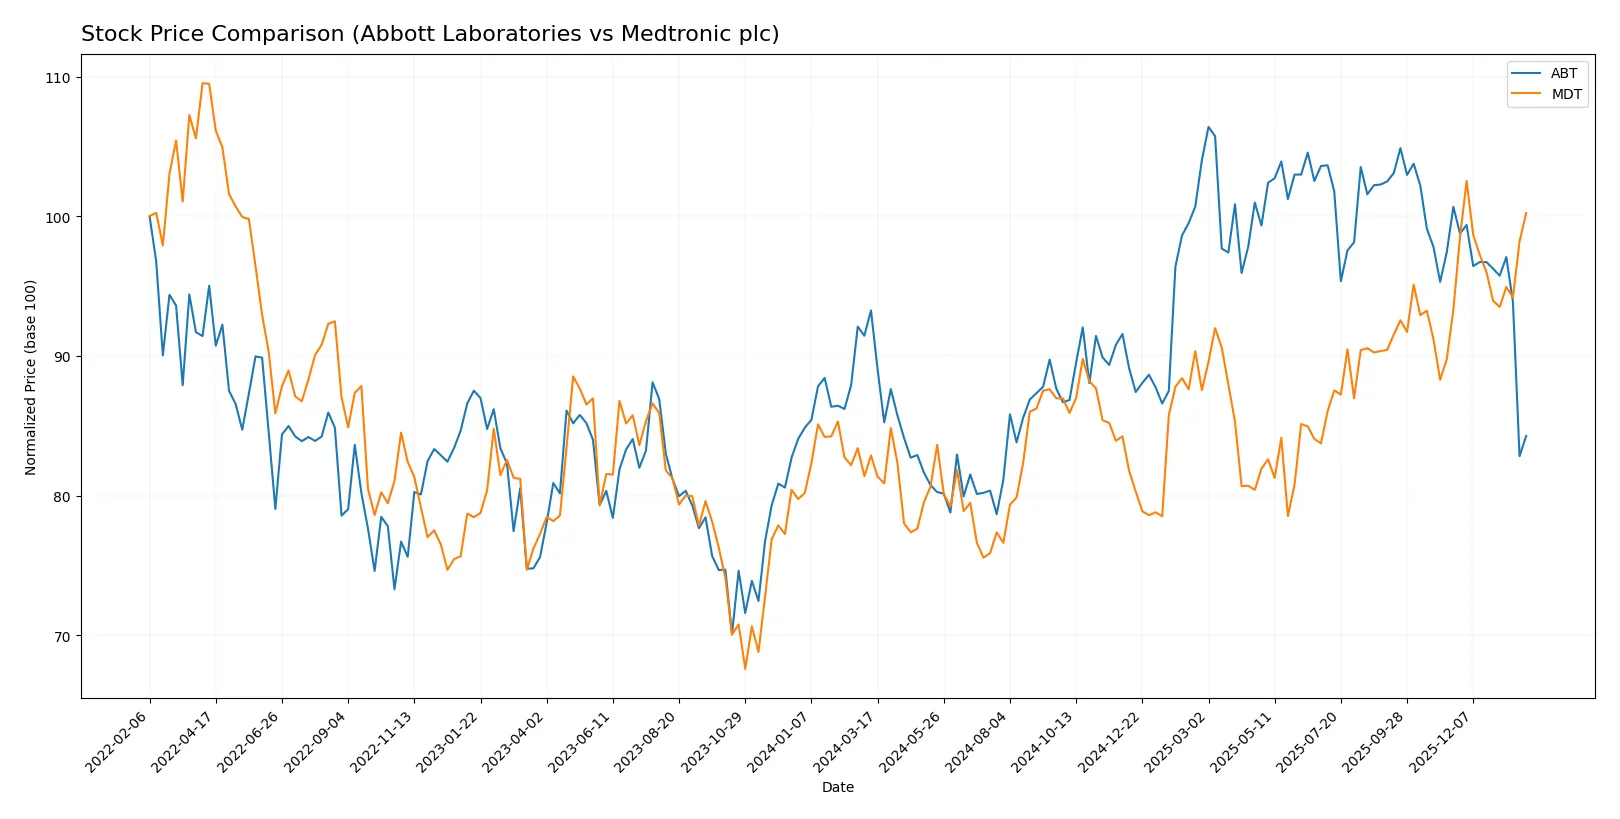
Trend Comparison
Abbott Laboratories’ stock fell 9.64% over the past year, marking a bearish trend with decelerating losses and a wide price range from 102.03 to 138.01.
Medtronic plc’s stock rose 20.94% over the same period, reflecting a bullish trend with deceleration and a narrower volatility band between 77.61 and 105.33.
Medtronic outperformed Abbott, delivering the highest market returns with sustained gains versus Abbott’s significant decline.
Target Prices
Analyst consensus shows optimistic target prices for both Abbott Laboratories and Medtronic plc.
| Company | Target Low | Target High | Consensus |
|---|---|---|---|
| Abbott Laboratories | 120 | 169 | 137.09 |
| Medtronic plc | 103 | 120 | 111.9 |
Abbott’s consensus target of 137.09 exceeds its current price of 109.3, signaling potential upside. Medtronic’s 111.9 target also suggests moderate growth above its 102.96 price.

Don’t Let Luck Decide Your Entry Point
Optimize your entry points with our advanced ProRealTime indicators. You’ll get efficient buy signals with precise price targets for maximum performance. Start outperforming now!
How do institutions grade them?
Abbott Laboratories Grades
The following table summarizes recent grades for Abbott Laboratories from credible institutions.
| Grading Company | Action | New Grade | Date |
|---|---|---|---|
| Citigroup | Maintain | Buy | 2026-01-23 |
| BTIG | Maintain | Buy | 2026-01-23 |
| Evercore ISI Group | Maintain | Outperform | 2026-01-23 |
| Bernstein | Maintain | Outperform | 2026-01-23 |
| Piper Sandler | Maintain | Overweight | 2026-01-23 |
| Oppenheimer | Maintain | Outperform | 2026-01-23 |
| RBC Capital | Maintain | Outperform | 2026-01-23 |
| Bernstein | Maintain | Outperform | 2026-01-09 |
| Barclays | Maintain | Overweight | 2026-01-05 |
| BTIG | Maintain | Buy | 2025-11-20 |
Medtronic plc Grades
Below is a summary of recent grades for Medtronic plc from established grading companies.
| Grading Company | Action | New Grade | Date |
|---|---|---|---|
| Bernstein | Maintain | Outperform | 2026-01-09 |
| Barclays | Maintain | Overweight | 2026-01-08 |
| William Blair | Upgrade | Outperform | 2026-01-06 |
| Truist Securities | Maintain | Hold | 2025-12-18 |
| Truist Securities | Maintain | Hold | 2025-11-20 |
| Barclays | Maintain | Overweight | 2025-11-20 |
| Baird | Maintain | Neutral | 2025-11-19 |
| UBS | Maintain | Neutral | 2025-11-19 |
| Wells Fargo | Maintain | Overweight | 2025-11-19 |
| Goldman Sachs | Upgrade | Neutral | 2025-11-19 |
Which company has the best grades?
Abbott Laboratories consistently receives buy and outperform grades, reflecting strong institutional confidence. Medtronic’s ratings are more mixed, with several hold and neutral grades. Investors may perceive Abbott as having stronger momentum based on current institutional sentiment.
Risks specific to each company
The following categories identify the critical pressure points and systemic threats facing both firms in the 2026 market environment:
1. Market & Competition
Abbott Laboratories
- Faces intense competition in diversified healthcare segments, pressuring margins and innovation.
Medtronic plc
- Operates in specialized device markets with strong moats but faces emerging tech disruptors.
2. Capital Structure & Debt
Abbott Laboratories
- Shows a favorable debt-to-equity ratio with strong interest coverage, indicating solid financial stability.
Medtronic plc
- Moderate debt load with neutral debt-to-assets; interest coverage is adequate but lower than Abbott’s.
3. Stock Volatility
Abbott Laboratories
- Beta of 0.72 signals lower volatility and defensive appeal within healthcare.
Medtronic plc
- Similar beta of 0.73 reflects comparable market risk and steady investor confidence.
4. Regulatory & Legal
Abbott Laboratories
- Exposed to regulatory scrutiny across pharmaceuticals and devices, raising compliance costs.
Medtronic plc
- Faces complex device approval challenges and potential litigation risks in multiple jurisdictions.
5. Supply Chain & Operations
Abbott Laboratories
- Complex, multi-segment supply chains vulnerable to global disruptions and raw material costs.
Medtronic plc
- Sophisticated manufacturing processes with operational risks tied to innovation cycles and global supply.
6. ESG & Climate Transition
Abbott Laboratories
- Increasing pressure to improve sustainability in pharmaceuticals and device production.
Medtronic plc
- Invested in green technologies; however, energy-intensive manufacturing remains a challenge.
7. Geopolitical Exposure
Abbott Laboratories
- US-based with global operations, vulnerable to trade policies and international market volatility.
Medtronic plc
- Headquartered in Ireland, faces currency and regulatory risks from EU and global markets.
Which company shows a better risk-adjusted profile?
Abbott’s strongest risk is regulatory complexity hitting diverse healthcare segments, while Medtronic faces debt-related financial risks despite stronger operational efficiency. Medtronic’s risk-adjusted profile appears superior, supported by a safer Altman Z-Score (3.11 vs. 5.23 for Abbott) coupled with stronger Piotroski fundamentals. Its more favorable debt management and operational metrics justify cautious optimism despite geopolitical headwinds.
Final Verdict: Which stock to choose?
Abbott Laboratories excels as a cash-generating powerhouse with strong operational margins. Its main point of vigilance lies in declining returns on invested capital, suggesting potential challenges in capital efficiency. It suits investors seeking aggressive growth exposure in healthcare innovation.
Medtronic’s strategic moat centers on its steady recurring revenue and improving profitability, supported by favorable liquidity and financial stability metrics. It offers better safety than Abbott, fitting well with investors who favor growth at a reasonable price and value consistency.
If you prioritize robust cash flow and operational efficiency in an aggressive growth portfolio, Abbott presents a compelling scenario despite its capital allocation concerns. However, if you seek a more stable dividend yield with improving profitability and financial health, Medtronic outshines as the better choice for a balanced growth-investment approach.
Disclaimer: Investment carries a risk of loss of initial capital. The past performance is not a reliable indicator of future results. Be sure to understand risks before making an investment decision.
Go Further
I encourage you to read the complete analyses of Abbott Laboratories and Medtronic plc to enhance your investment decisions: