Home > Comparison > Healthcare > ABT vs EW
The strategic rivalry between Abbott Laboratories and Edwards Lifesciences defines the current trajectory of the medical devices sector. Abbott operates as a diversified healthcare giant with broad product segments, while Edwards focuses on specialized structural heart and critical care technologies. This analysis pits Abbott’s scale and diversification against Edwards’ innovation and niche expertise. I will determine which company offers a superior risk-adjusted profile for a diversified healthcare portfolio in 2026.
Table of contents
Companies Overview
Abbott Laboratories and Edwards Lifesciences dominate critical niches within the medical devices sector, shaping healthcare innovation and patient outcomes.
Abbott Laboratories: Diversified Healthcare Leader
Abbott Laboratories excels as a global healthcare powerhouse with diversified revenue streams spanning pharmaceuticals, diagnostics, nutrition, and medical devices. Its core revenue derives from advanced diagnostic systems and cardiovascular devices. In 2026, Abbott sharpened its strategic focus on expanding diagnostic technologies and chronic disease management, leveraging a broad product portfolio to sustain growth and resilience.
Edwards Lifesciences Corporation: Structural Heart Innovator
Edwards Lifesciences leads in structural heart disease technologies, specializing in transcatheter heart valve repair and replacement. Its revenues rely on minimally invasive cardiac devices and critical care monitoring systems. The company’s 2026 strategy emphasizes innovative valve repair solutions and enhancing surgical heart products, solidifying its position in the competitive niche of advanced cardiovascular therapies.
Strategic Collision: Similarities & Divergences
Abbott pursues a diversified business model integrating diagnostics and devices, while Edwards focuses narrowly on structural heart innovation. They clash primarily in cardiovascular device markets, competing on technological edge and clinical outcomes. Abbott’s broad exposure contrasts with Edwards’ specialized niche, shaping distinct investment profiles—one diversified and stable, the other focused and growth-oriented.
Income Statement Comparison
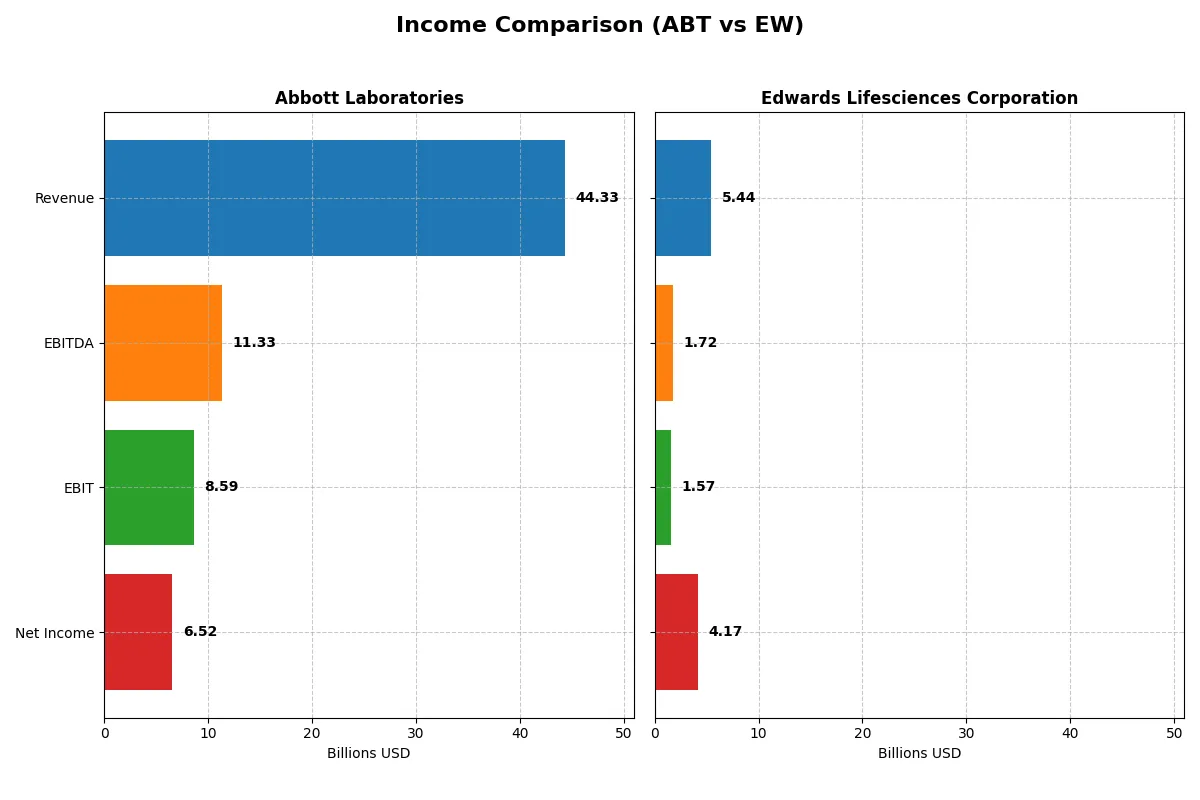
This table dissects the core profitability and scalability of both corporate engines to reveal who dominates the bottom line:
| Metric | Abbott Laboratories (ABT) | Edwards Lifesciences Corporation (EW) |
|---|---|---|
| Revenue | 44.3B | 5.44B |
| Cost of Revenue | 19.7B | 1.12B |
| Operating Expenses | 16.6B | 2.94B |
| Gross Profit | 24.6B | 4.32B |
| EBITDA | 11.3B | 1.72B |
| EBIT | 8.59B | 1.57B |
| Interest Expense | 341M | 20M |
| Net Income | 6.52B | 4.17B |
| EPS | 3.74 | 6.98 |
| Fiscal Year | 2025 | 2024 |
Income Statement Analysis: The Bottom-Line Duel
This income statement comparison unveils the operational efficiency and profitability strength powering each company’s financial engine.
Abbott Laboratories Analysis
Abbott’s revenue increased modestly from $40.1B in 2023 to $44.3B in 2025, showing steady top-line growth. Gross margin remains robust at 55.5%, supporting a solid EBIT margin of 19.4%. However, net income fell sharply in 2025 to $6.5B from a peak of $13.4B in 2024, signaling margin pressure and earnings volatility despite favorable operational metrics.
Edwards Lifesciences Corporation Analysis
Edwards Lifesciences grew revenue from $5.0B in 2023 to $5.4B in 2024, exhibiting healthy momentum. Its gross margin stands impressively at 79.5%, with an EBIT margin near 29%. Net income surged to $4.2B in 2024, boosted by discontinued operations, and net margin expanded dramatically to 76.8%, reflecting exceptional profitability and operational leverage.
Margin Resilience vs. Exceptional Profit Growth
Edwards Lifesciences clearly outperforms Abbott on margin expansion and net income growth, demonstrating superior capital allocation and operational efficiency. Abbott shows stable revenue but struggles with net income consistency. For investors, Edwards’ profile offers a more compelling combination of high margin power and explosive earnings growth.
Financial Ratios Comparison
These vital ratios act as a diagnostic tool to expose the underlying fiscal health, valuation premiums, and capital efficiency of the companies compared below:
| Ratios | Abbott Laboratories (ABT) | Edwards Lifesciences (EW) |
|---|---|---|
| ROE | 28.1% | 41.8% |
| ROIC | 9.9% | 10.7% |
| P/E | 14.6 | 10.6 |
| P/B | 4.11 | 4.43 |
| Current Ratio | 1.67 | 4.18 |
| Quick Ratio | 1.23 | 3.45 |
| D/E | 0.32 | 0.07 |
| Debt-to-Assets | 18.8% | 5.4% |
| Interest Coverage | 11.3 | 69.6 |
| Asset Turnover | 0.52 | 0.42 |
| Fixed Asset Turnover | 3.58 | 3.05 |
| Payout ratio | 28.6% | 0% |
| Dividend yield | 1.96% | 0% |
| Fiscal Year | 2025 | 2024 |
Efficiency & Valuation Duel: The Vital Signs
Financial ratios act as a company’s DNA, exposing hidden risks and revealing operational strengths essential for investment decisions.
Abbott Laboratories
Abbott shows a favorable net margin of 14.72%, but its ROE and ROIC are unfavorable at zero. The stock trades at a stretched P/E of 33.55, indicating expensive valuation. Dividend yield stands neutral at 1.88%, suggesting moderate shareholder returns. Operational efficiency is mixed, with some liquidity ratios unavailable or unfavorable.
Edwards Lifesciences Corporation
Edwards shines with a strong 41.75% ROE and a robust net margin of 76.75%. The P/E ratio of 10.6 reflects a reasonably priced stock. Despite a high P/B of 4.43, its overall ratio profile is favorable. Edwards reinvests heavily in R&D (19%) and shows no dividend, emphasizing growth over immediate returns.
Premium Valuation vs. Operational Safety
Edwards offers superior profitability and a more balanced ratio profile, though at a higher P/B multiple. Abbott’s valuation appears stretched, with weaker returns on equity and capital. Edwards suits investors seeking growth and operational strength, while Abbott aligns more with those prioritizing dividend income amid mixed efficiency.
Which one offers the Superior Shareholder Reward?
Abbott Laboratories (ABT) delivers a balanced shareholder reward with a 1.96% dividend yield and a moderate 29% payout ratio, supported by strong free cash flow coverage. Its steady buyback program further enhances returns. Edwards Lifesciences (EW) pays no dividend but aggressively reinvests in growth, showing a high gross margin (79%) and strong profitability. However, EW’s buybacks are minimal, limiting immediate shareholder cash returns. I see ABT’s sustainable dividend plus buybacks as a superior total return model in 2026, combining income and capital appreciation, while EW’s growth focus carries higher execution risk.
Comparative Score Analysis: The Strategic Profile
The radar chart reveals the fundamental DNA and trade-offs of Abbott Laboratories and Edwards Lifesciences Corporation:
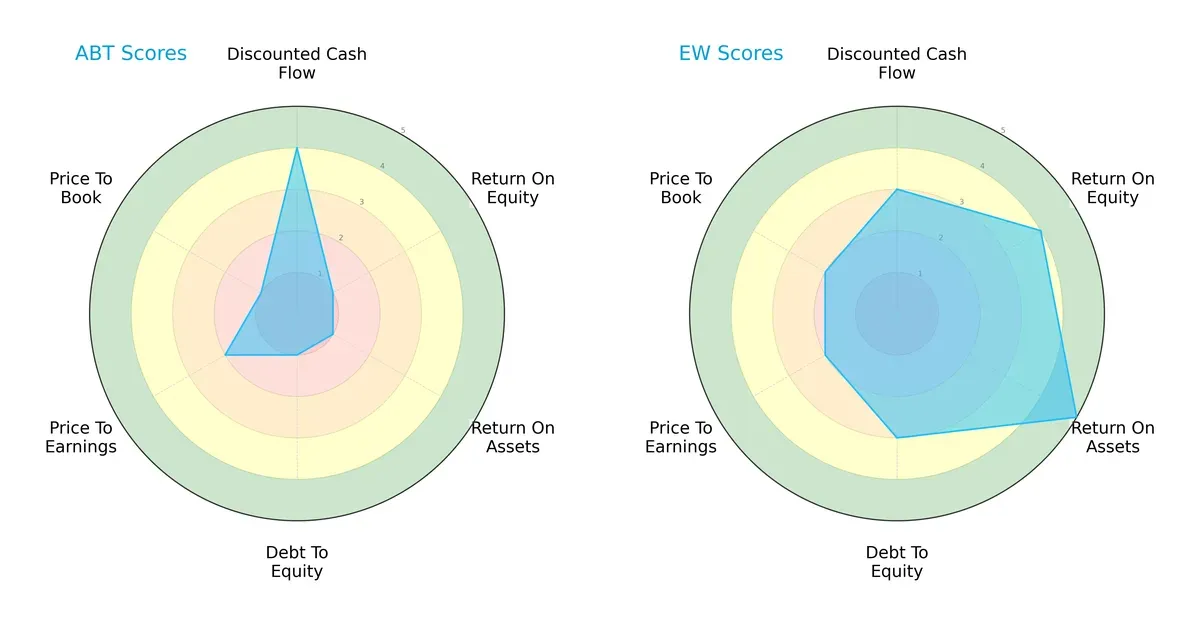
Edwards Lifesciences shows superior operational efficiency with high ROE (4) and ROA (5) scores. Abbott Labs excels in discounted cash flow (4) but struggles with profitability metrics (ROE and ROA at 1) and financial leverage (debt-to-equity score 1). Edwards presents a more balanced profile, while Abbott relies heavily on cash flow strength despite weak asset returns and high leverage risk.
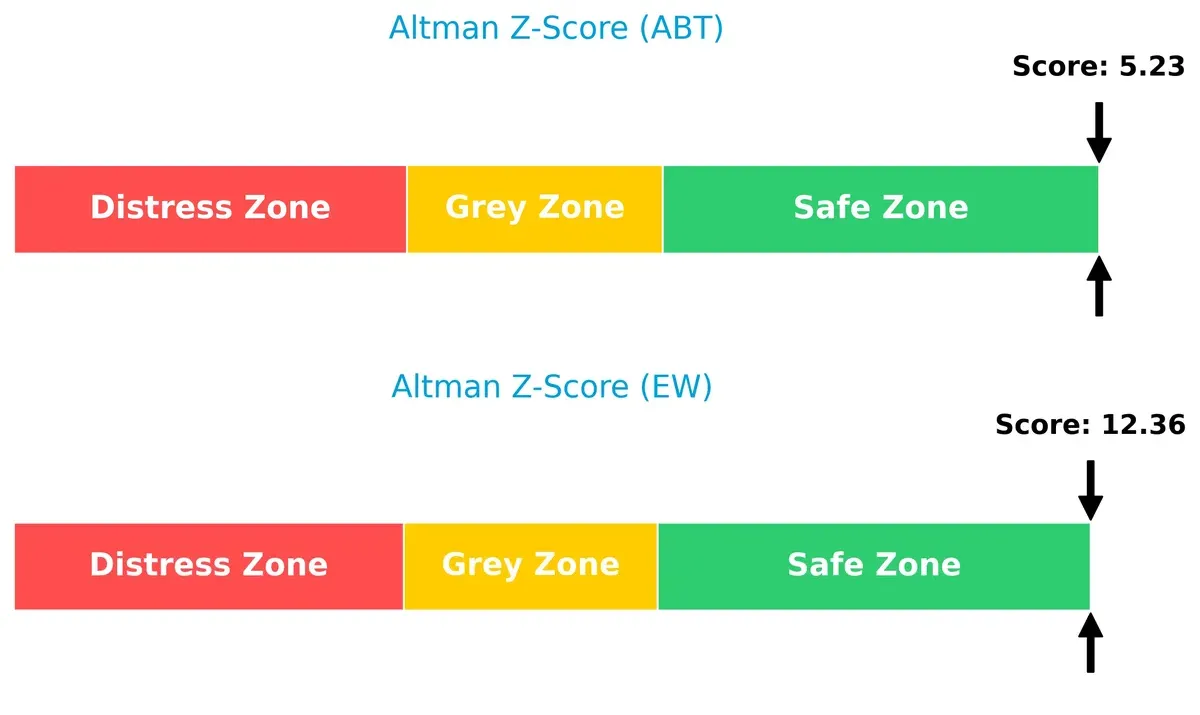
Bankruptcy Risk: Solvency Showdown
Edwards Lifesciences holds a significantly higher Altman Z-Score (12.36) compared to Abbott’s 5.23, indicating a stronger solvency position and lower bankruptcy risk in this economic cycle:
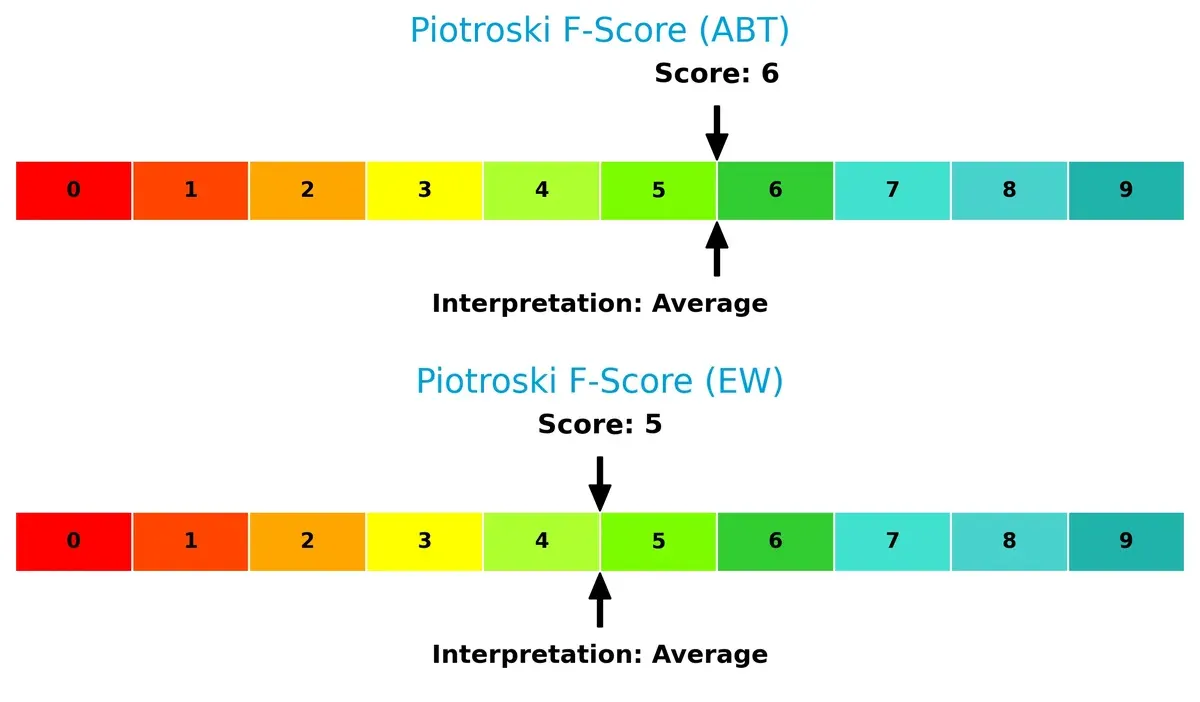
Financial Health: Quality of Operations
Abbott scores 6 on the Piotroski F-Score, slightly edging Edwards’ 5, suggesting marginally better internal financial health. Neither firm shows critical red flags, but both remain in the average zone for operational quality:
How are the two companies positioned?
This section dissects the operational DNA of Abbott and Edwards by comparing revenue distribution by segment and analyzing internal strengths and weaknesses. The goal is to confront their economic moats and identify which model offers the most resilient competitive advantage today.
Revenue Segmentation: The Strategic Mix
This visual comparison dissects how Abbott Laboratories and Edwards Lifesciences diversify their income streams and reveals where their primary sector bets lie:
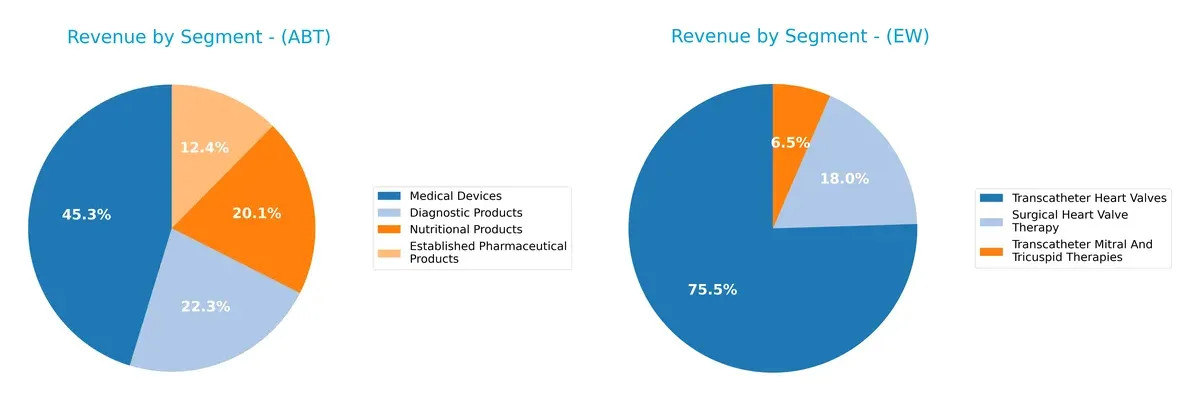
I observe Abbott boasts a well-balanced portfolio, with Medical Devices at $19B anchoring revenue alongside Diagnostic ($9.3B), Nutritional ($8.4B), and Pharmaceuticals ($5.2B). Edwards Lifesciences, by contrast, pivots heavily on Transcatheter Heart Valves at $4.1B, dwarfing Surgical Heart Valve Therapy ($981M) and smaller niches. Abbott’s diversification reduces concentration risk, while Edwards relies on niche dominance, betting on heart valve innovation and ecosystem lock-in in cardiovascular care.
Strengths and Weaknesses Comparison
This table compares the Strengths and Weaknesses of Abbott Laboratories and Edwards Lifesciences Corporation:
Abbott Laboratories Strengths
- Broad product diversification across diagnostics, pharmaceuticals, devices, and nutrition
- Strong global revenue balance between US and Non-US markets
- Favorable net margin indicating operational efficiency
- Low debt-to-assets ratio and strong interest coverage
Edwards Lifesciences Strengths
- High profitability with superior net margin and ROE
- Efficient capital allocation with ROIC above WACC
- Strong quick ratio and low debt levels indicate solid liquidity
- Specialized product focus with strong market share in heart valve therapies
Abbott Laboratories Weaknesses
- Unfavorable ROE and ROIC show weak returns on capital
- Poor liquidity ratios raise concerns about short-term financial health
- Above-average PE ratio may indicate overvaluation
- Low asset turnover suggests inefficient use of assets
Edwards Lifesciences Weaknesses
- High price-to-book ratio could indicate premium valuation risk
- Current ratio flagged as unfavorable despite good quick ratio
- Asset turnover remains low, limiting operational efficiency
- Absence of dividend yield may deter income-focused investors
Abbott Laboratories shows strength in product and geographic diversification but faces challenges in capital efficiency and liquidity. Edwards Lifesciences demonstrates outstanding profitability and focused innovation but carries valuation and operational efficiency risks. These factors shape each company’s strategic priorities in managing growth and capital.
The Moat Duel: Analyzing Competitive Defensibility
A structural moat is the only reliable shield protecting long-term profits from relentless competition erosion. Let’s dissect the moats of two medical device giants:
Abbott Laboratories: Diversified Innovation Moat
Abbott’s moat rests on broad product diversification and intangible assets like proprietary diagnostics and device technology. Its stable margins reflect this strength. Yet, slowing ROIC signals looming pressure in 2026.
Edwards Lifesciences Corporation: Precision Structural Heart Moat
Edwards dominates with specialized structural heart devices, leveraging high switching costs and regulatory barriers. Its superior ROIC and margin expansion validate a slightly favorable moat despite recent profitability declines. New valve tech could deepen its edge.
Moat Battle: Diversification vs. Specialized Innovation
Edwards holds the deeper moat with consistently above-cost-of-capital returns and focused innovation. Abbott’s broad portfolio offers resilience but faces margin and ROIC headwinds. Edwards stands better poised to defend and grow market share in 2026.
Which stock offers better returns?
The past year shows both Abbott Laboratories and Edwards Lifesciences with downward price trends, marked by decelerating declines and distinct trading volume dynamics.
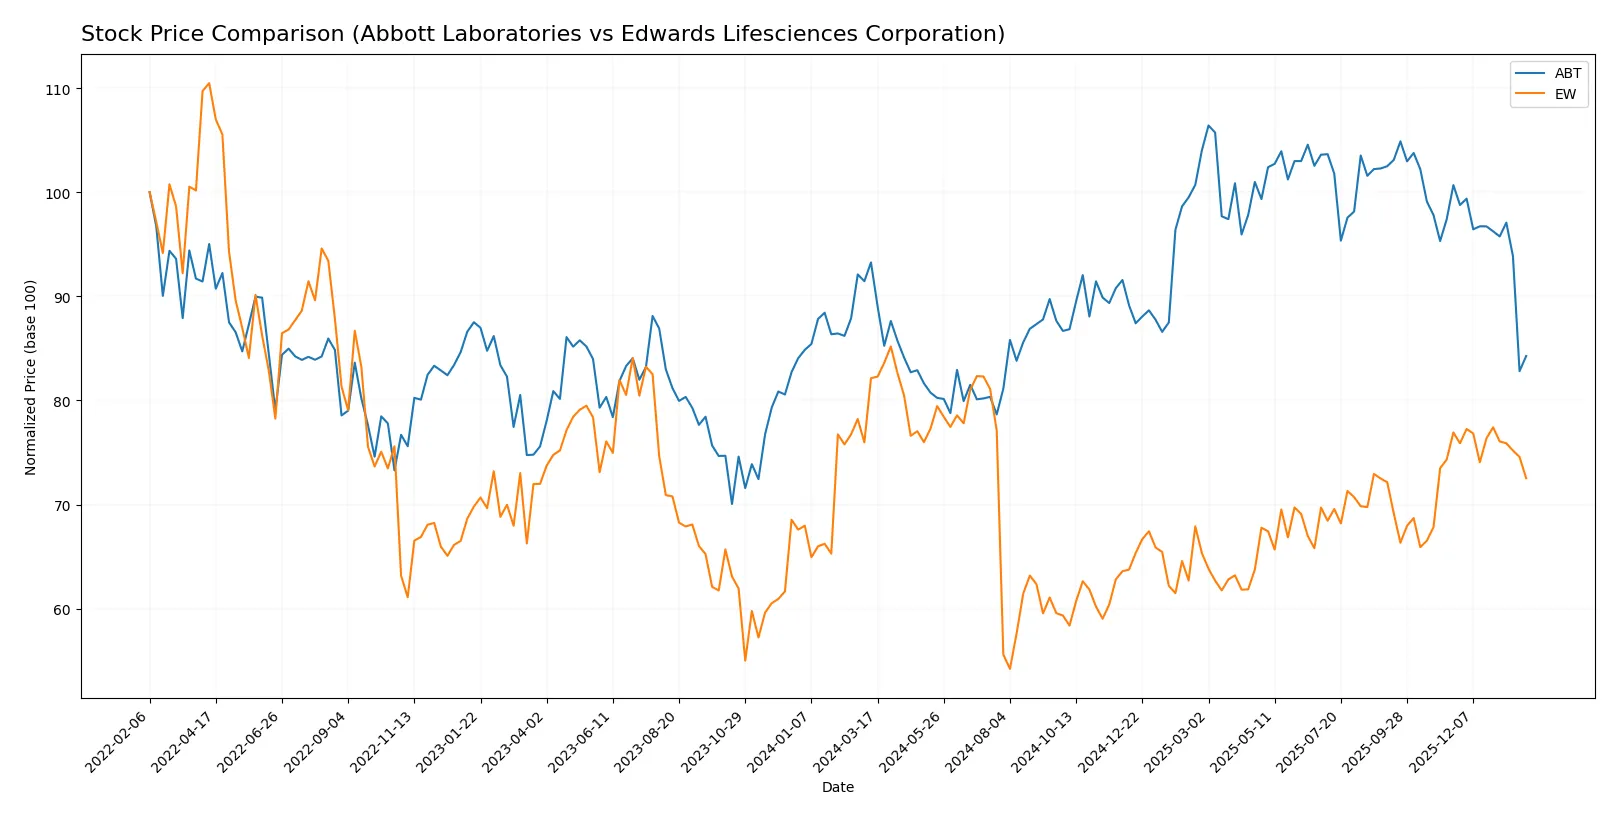
Trend Comparison
Abbott Laboratories’ stock declined 9.64% over 12 months, revealing a bearish trend with decelerating losses. Volatility remains elevated with a 10.54% standard deviation.
Edwards Lifesciences’ stock fell 11.7% over the same period, also bearish and decelerating. Its volatility is lower at 8.24%, with a notable price range between 60.83 and 95.56.
Abbott’s decline is less steep, delivering comparatively better market performance than Edwards Lifesciences during this timeframe.
Target Prices
Analysts present a moderately optimistic consensus for Abbott Laboratories and Edwards Lifesciences Corporation.
| Company | Target Low | Target High | Consensus |
|---|---|---|---|
| Abbott Laboratories | 120 | 169 | 137.09 |
| Edwards Lifesciences Corporation | 87 | 110 | 97.31 |
Abbott’s target consensus sits about 25% above its current price of 109.3, signaling potential upside. Edwards Lifesciences shows a roughly 20% premium to its 81.36 stock price, reflecting positive analyst expectations.

Don’t Let Luck Decide Your Entry Point
Optimize your entry points with our advanced ProRealTime indicators. You’ll get efficient buy signals with precise price targets for maximum performance. Start outperforming now!
How do institutions grade them?
The grades assigned by major financial institutions for Abbott Laboratories and Edwards Lifesciences Corporation are as follows:
Abbott Laboratories Grades
The following table summarizes recent grades from reputable grading firms for Abbott Laboratories:
| Grading Company | Action | New Grade | Date |
|---|---|---|---|
| Citigroup | Maintain | Buy | 2026-01-23 |
| BTIG | Maintain | Buy | 2026-01-23 |
| Evercore ISI Group | Maintain | Outperform | 2026-01-23 |
| Bernstein | Maintain | Outperform | 2026-01-23 |
| Piper Sandler | Maintain | Overweight | 2026-01-23 |
| Oppenheimer | Maintain | Outperform | 2026-01-23 |
| RBC Capital | Maintain | Outperform | 2026-01-23 |
| Bernstein | Maintain | Outperform | 2026-01-09 |
| Barclays | Maintain | Overweight | 2026-01-05 |
| BTIG | Maintain | Buy | 2025-11-20 |
Edwards Lifesciences Corporation Grades
Below are recent institutional grades for Edwards Lifesciences Corporation from credible sources:
| Grading Company | Action | New Grade | Date |
|---|---|---|---|
| Stifel | Maintain | Buy | 2026-01-20 |
| Piper Sandler | Maintain | Overweight | 2026-01-20 |
| Barclays | Maintain | Overweight | 2026-01-12 |
| UBS | Maintain | Neutral | 2026-01-12 |
| TD Cowen | Upgrade | Buy | 2026-01-09 |
| Stifel | Maintain | Buy | 2026-01-07 |
| JP Morgan | Upgrade | Overweight | 2025-12-18 |
| Canaccord Genuity | Maintain | Hold | 2025-12-17 |
| Baird | Maintain | Neutral | 2025-12-16 |
| Citigroup | Maintain | Buy | 2025-12-11 |
Which company has the best grades?
Abbott Laboratories consistently receives higher grades, predominantly “Outperform” and “Buy,” while Edwards Lifesciences has more mixed ratings including “Neutral” and “Hold.” Abbott’s stronger consensus may signal greater institutional confidence, potentially influencing investor sentiment positively.
Risks specific to each company
The following categories identify the critical pressure points and systemic threats facing both firms in the 2026 market environment:
1. Market & Competition
Abbott Laboratories
- Large diversified medical device and pharma portfolio, facing intense competition from generics and diagnostics innovation.
Edwards Lifesciences Corporation
- Focused on structural heart devices, competing in a niche but highly innovative and fast-evolving segment.
2. Capital Structure & Debt
Abbott Laboratories
- Favorable debt-to-equity metrics and strong interest coverage reduce financial risk.
Edwards Lifesciences Corporation
- Low debt levels and excellent interest coverage support financial stability and growth flexibility.
3. Stock Volatility
Abbott Laboratories
- Beta at 0.72 suggests lower volatility than the broader market, appealing for risk-averse investors.
Edwards Lifesciences Corporation
- Beta near 0.96 indicates close to market volatility, reflecting higher sensitivity to economic cycles.
4. Regulatory & Legal
Abbott Laboratories
- Exposure to pharmaceutical and medical device regulations globally, with potential drug approval delays.
Edwards Lifesciences Corporation
- Faces rigorous FDA scrutiny on innovative heart valve products, with risks from clinical trial outcomes.
5. Supply Chain & Operations
Abbott Laboratories
- Large global operations with complex supply chains vulnerable to disruption or cost inflation.
Edwards Lifesciences Corporation
- Smaller scale but high dependency on specialized components for heart devices increases operational risk.
6. ESG & Climate Transition
Abbott Laboratories
- ESG initiatives are well established but must continuously adapt to evolving healthcare sustainability demands.
Edwards Lifesciences Corporation
- Increasing pressure on reducing carbon footprint in manufacturing and product lifecycle management.
7. Geopolitical Exposure
Abbott Laboratories
- Broad international footprint exposes it to trade tensions, tariffs, and regulatory variance worldwide.
Edwards Lifesciences Corporation
- Moderate global sales concentration; geopolitical risks mainly from US and European regulatory environments.
Which company shows a better risk-adjusted profile?
Edwards Lifesciences faces its greatest risk in regulatory and clinical trial execution, critical in maintaining its leadership in structural heart devices. Abbott’s most impactful risk lies in market competition and operational complexity amid rapid innovation and pricing pressures. From a risk-adjusted perspective, Edwards shows stronger financial resilience, with superior profitability and balance sheet strength. Abbott’s valuation metrics and liquidity ratios raise caution despite its size. Edwards’ recent robust Altman Z-Score (12.36) versus Abbott’s lower Piotroski Score (6) confirms better financial stability and risk management in the current market environment.
Final Verdict: Which stock to choose?
Abbott Laboratories excels as a resilient cash generator with steady operational margins. Its main point of vigilance is the declining profitability trend, which could pressure future returns. This stock might suit investors seeking exposure in established healthcare names with moderate growth expectations.
Edwards Lifesciences commands a strategic moat through its strong innovation pipeline and recurring revenue model. Its financial strength and favorable profitability metrics offer better stability compared to Abbott. This company could appeal to investors focused on GARP—growth at a reasonable price—with a tilt toward innovation leadership.
If you prioritize steady cash flow and established market presence, Abbott appears compelling despite margin pressures. However, if you seek growth with a durable competitive advantage and stronger profitability, Edwards outshines as the choice offering better stability and innovation upside. Each stock fits distinct investor profiles with differing risk appetites and strategic goals.
Disclaimer: Investment carries a risk of loss of initial capital. The past performance is not a reliable indicator of future results. Be sure to understand risks before making an investment decision.
Go Further
I encourage you to read the complete analyses of Abbott Laboratories and Edwards Lifesciences Corporation to enhance your investment decisions: