Home > Comparison > Healthcare > ABT vs DXCM
The strategic rivalry between Abbott Laboratories and DexCom, Inc. shapes innovation in the healthcare medical devices sector. Abbott operates as a diversified healthcare giant with multiple segments, including pharmaceuticals and diagnostics. DexCom, by contrast, focuses exclusively on high-growth continuous glucose monitoring systems. This head-to-head pits broad-based stability against specialized innovation. This analysis aims to identify which company presents the superior risk-adjusted opportunity for a balanced investment portfolio.

Table of contents
Companies Overview
Abbott Laboratories and DexCom, Inc. both hold significant stakes in the medical devices market, shaping healthcare innovation worldwide.
Abbott Laboratories: Diversified Healthcare Powerhouse
Abbott Laboratories dominates the healthcare sector through a diversified portfolio spanning pharmaceuticals, diagnostics, nutrition, and medical devices. Its core revenue derives from innovative products like cardiovascular devices and diagnostic systems. In 2026, Abbott emphasizes expanding its diagnostic and remote patient monitoring capabilities to capture evolving healthcare demands.
DexCom, Inc.: Continuous Glucose Monitoring Specialist
DexCom, Inc. leads the continuous glucose monitoring (CGM) market with cutting-edge systems designed for diabetes management. Its revenue engine revolves around advanced CGM devices, including the DexCom G6 and G7 platforms. In 2026, DexCom focuses on enhancing integration with digital health through APIs and partnerships to solidify its technological edge.
Strategic Collision: Similarities & Divergences
Abbott pursues a broad healthcare strategy, while DexCom specializes deeply in diabetes care. Their competition centers on medical device innovation and market penetration in diabetes management tools. Abbott’s scale contrasts with DexCom’s niche focus, creating distinct investment profiles—one anchored in diversification, the other in specialized technological leadership.
Income Statement Comparison
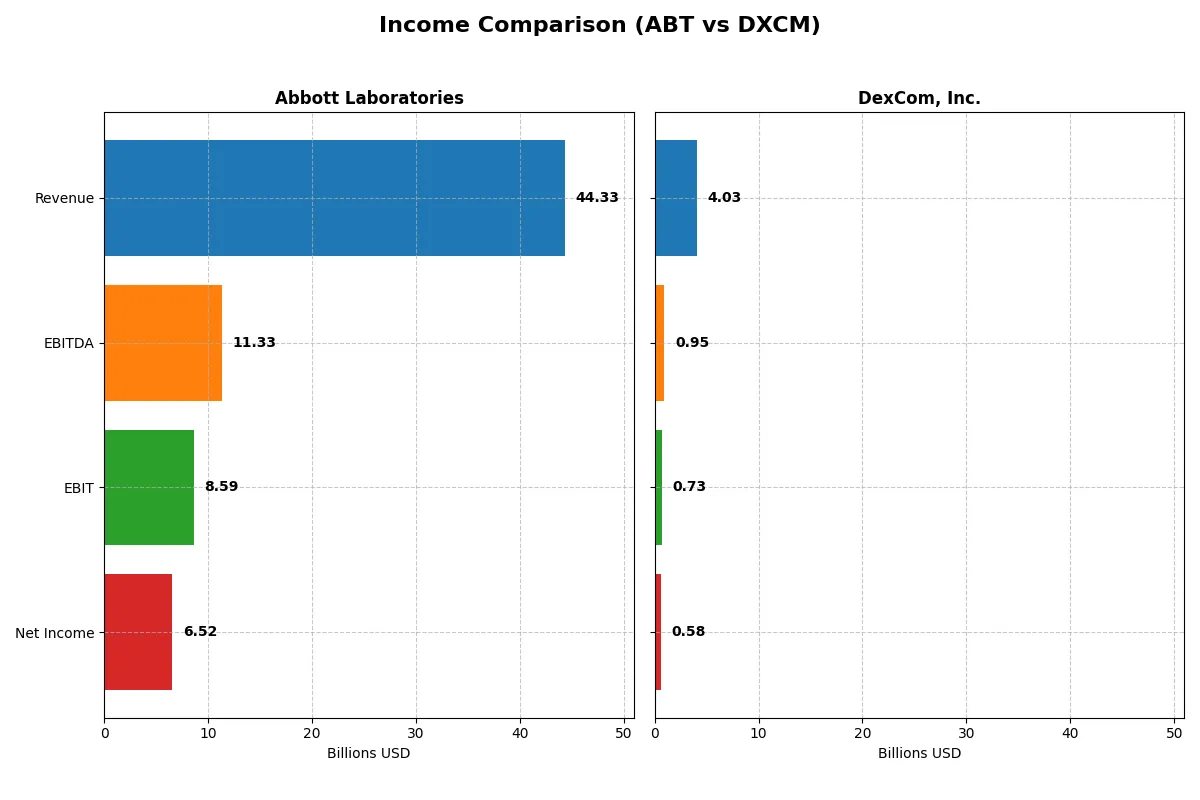
This data dissects the core profitability and scalability of both corporate engines to reveal who dominates the bottom line:
| Metric | Abbott Laboratories (ABT) | DexCom, Inc. (DXCM) |
|---|---|---|
| Revenue | 44.3B | 4.0B |
| Cost of Revenue | 19.7B | 1.6B |
| Operating Expenses | 16.6B | 1.8B |
| Gross Profit | 24.6B | 2.4B |
| EBITDA | 11.3B | 946M |
| EBIT | 8.6B | 728M |
| Interest Expense | 341M | 19M |
| Net Income | 6.5B | 587.7M |
| EPS | 3.74 | 1.46 |
| Fiscal Year | 2025 | 2024 |
Income Statement Analysis: The Bottom-Line Duel
This income statement comparison reveals how efficiently Abbott Laboratories and DexCom power their business engines through revenue and profitability.
Abbott Laboratories Analysis
Abbott’s revenue grew moderately to $44.3B in 2025, with net income at $6.5B, down sharply from a peak in 2024. Its gross margin stands strong at 55.5%, but net margin fell to 14.7%, reflecting increased expenses and tax anomalies. The company shows solid operating income but struggles to sustain bottom-line momentum despite steady revenue growth.
DexCom, Inc. Analysis
DexCom’s revenue climbed robustly to $4.0B in 2024, supported by steady gross margins above 60%. Net income reached $587M, showing consistent improvement over the years. While EBIT margin slipped slightly to 18%, DexCom maintains favorable expense control and EPS growth. The company demonstrates strong top-line momentum and improving profitability metrics amid expanding scale.
Margin Strength vs. Growth Trajectory
Abbott excels in scale and stable gross margins but faces pressure on net profitability and earnings growth. DexCom delivers superior revenue growth and margin expansion with a leaner cost structure. For investors, DexCom’s profile is more attractive for growth and efficiency, while Abbott offers scale with margin compression risks.
Financial Ratios Comparison
These vital ratios act as a diagnostic tool to expose the underlying fiscal health, valuation premiums, and capital efficiency of the companies compared below:
| Ratios | Abbott Laboratories (ABT) | DexCom, Inc. (DXCM) |
|---|---|---|
| ROE | 28.1% (2024) | 27.4% (2024) |
| ROIC | 9.9% (2024) | 10.2% (2024) |
| P/E | 14.6 (2024) | 54.6 (2024) |
| P/B | 4.11 (2024) | 14.97 (2024) |
| Current Ratio | 1.67 (2024) | 1.47 (2024) |
| Quick Ratio | 1.23 (2024) | 1.28 (2024) |
| D/E | 0.32 (2024) | 1.23 (2024) |
| Debt-to-Assets | 18.8% (2024) | 39.9% (2024) |
| Interest Coverage | 11.3 (2024) | 31.6 (2024) |
| Asset Turnover | 0.52 (2024) | 0.62 (2024) |
| Fixed Asset Turnover | 3.58 (2024) | 2.88 (2024) |
| Payout Ratio | 29% (2024) | 0% (2024) |
| Dividend Yield | 1.96% (2024) | 0% (2024) |
| Fiscal Year | 2024 | 2024 |
Efficiency & Valuation Duel: The Vital Signs
Financial ratios act as a company’s DNA, exposing hidden risks and operational strengths critical for investor insight.
Abbott Laboratories
Abbott shows a solid net margin at 14.72%, reflecting efficient profitability despite ROE and ROIC being unavailable, signaling data gaps. Its P/E of 33.55 suggests the stock trades at a premium, possibly stretched. Dividend yield stands at 1.88%, offering modest shareholder returns alongside ongoing R&D investment at 6.7% of revenue.
DexCom, Inc.
DexCom posts a strong ROE of 27.4% and an ROIC of 10.2%, confirming operational efficiency. However, a high P/E of 54.61 and P/B of 14.97 mark the stock as expensive. The company pays no dividends, reinvesting heavily in R&D (13.7%) to fuel growth, balancing elevated valuation with future potential.
Premium Valuation vs. Operational Efficiency
DexCom commands a higher valuation but delivers superior profitability metrics, while Abbott offers moderate returns with partial dividend payouts. Investors seeking growth may lean toward DexCom’s innovation focus, whereas those prioritizing income might consider Abbott’s steadier dividend profile.
Which one offers the Superior Shareholder Reward?
Abbott Laboratories (ABT) delivers a balanced shareholder reward with a 1.96% dividend yield and a moderate 29% payout ratio, supported by strong free cash flow. ABT also engages in consistent buybacks, enhancing total returns. DexCom, Inc. (DXCM) pays no dividends but reinvests heavily in R&D and growth, reflecting in a higher valuation multiple. However, DXCM’s buyback activity is limited, and its debt load is higher, posing sustainability risks. I see ABT’s disciplined distribution, combining yield and buybacks, as the superior total return choice for 2026 investors.
Comparative Score Analysis: The Strategic Profile
The radar chart reveals the fundamental DNA and trade-offs of Abbott Laboratories and DexCom, Inc., highlighting their strategic strengths and vulnerabilities:
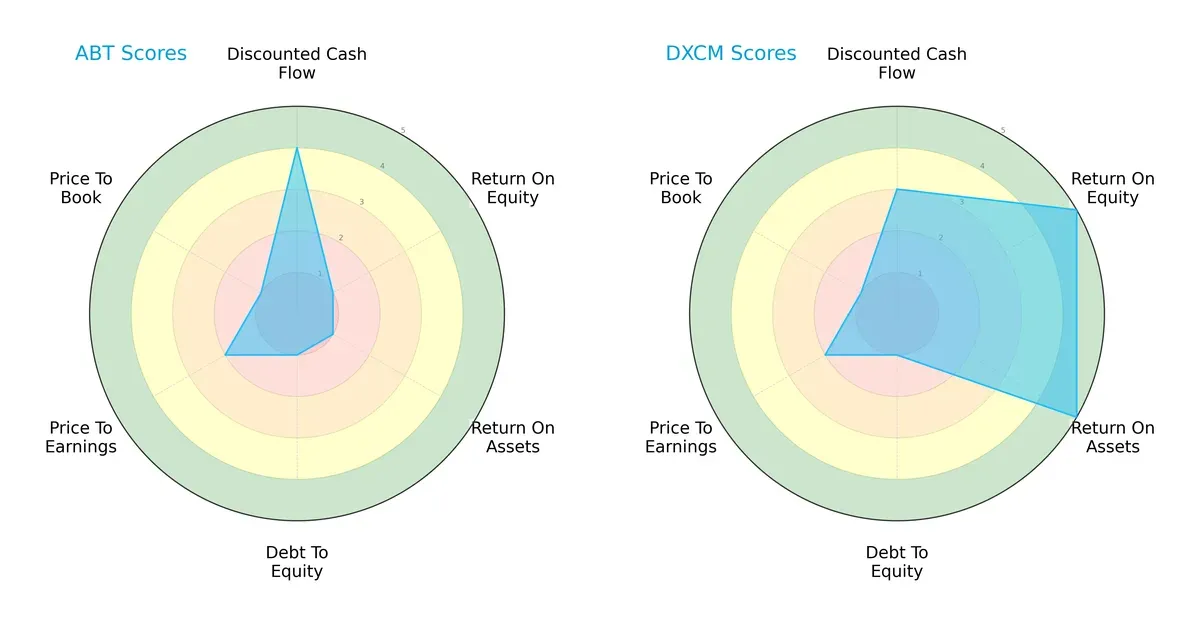
Abbott shows a strong discounted cash flow score (4) but struggles with profitability metrics (ROE and ROA at 1 each) and balance sheet strength (debt-to-equity at 1). DexCom excels in profitability (ROE and ROA at 5) but shares Abbott’s weakness in leverage (debt-to-equity at 1). DexCom presents a more balanced financial profile driven by operational efficiency, while Abbott leans heavily on cash flow valuation.
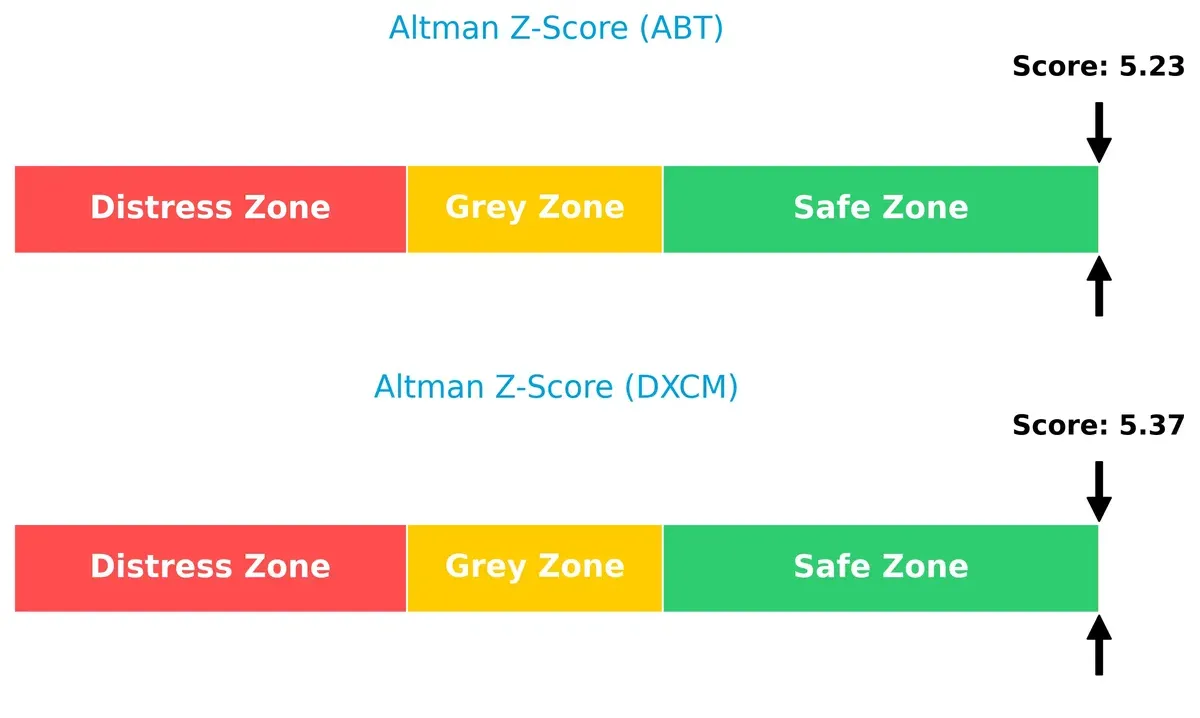
Bankruptcy Risk: Solvency Showdown
DexCom’s Altman Z-Score slightly edges Abbott’s, both safely above 5, signaling robust financial health and low bankruptcy risk in this cycle:
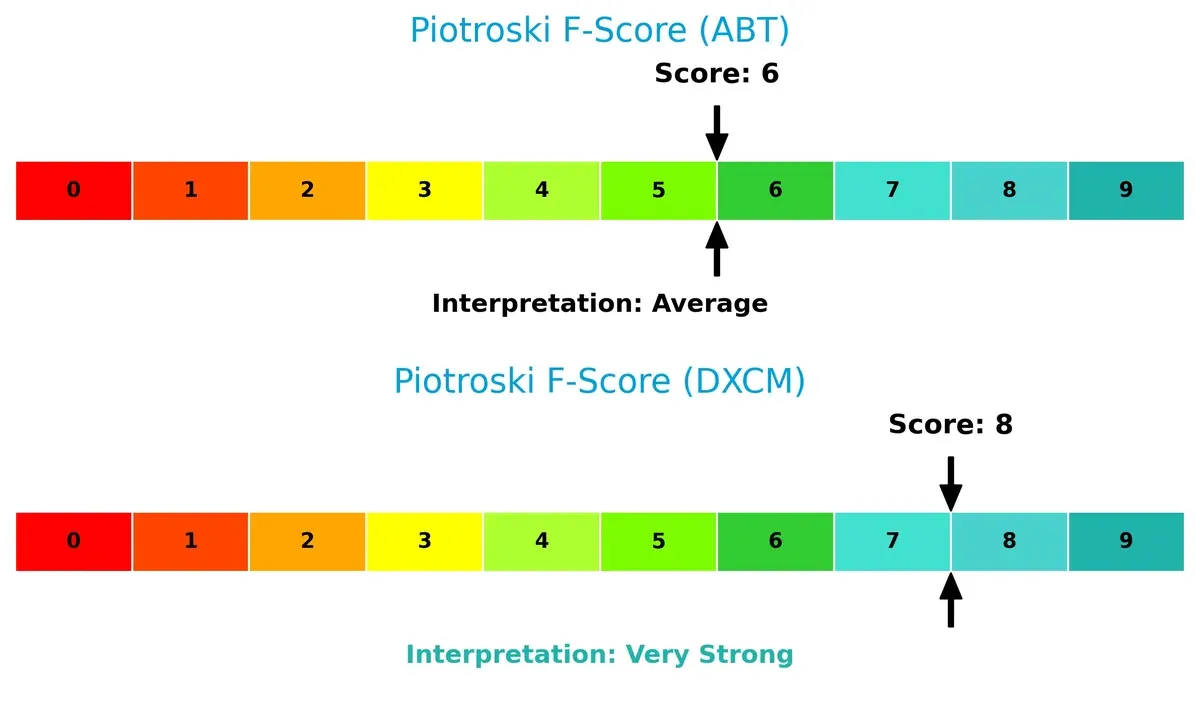
Financial Health: Quality of Operations
DexCom’s Piotroski F-Score of 8 indicates very strong financial health. Abbott’s score of 6 is average, suggesting some internal red flags in operational or financial quality:
How are the two companies positioned?
This section dissects Abbott and DexCom’s operational DNA by comparing their revenue distribution and internal dynamics, including strengths and weaknesses. The goal is to confront their economic moats and identify which model offers a more resilient, sustainable competitive advantage today.
Revenue Segmentation: The Strategic Mix
This visual comparison dissects how Abbott Laboratories and DexCom, Inc. diversify their income streams and where their primary sector bets lie:
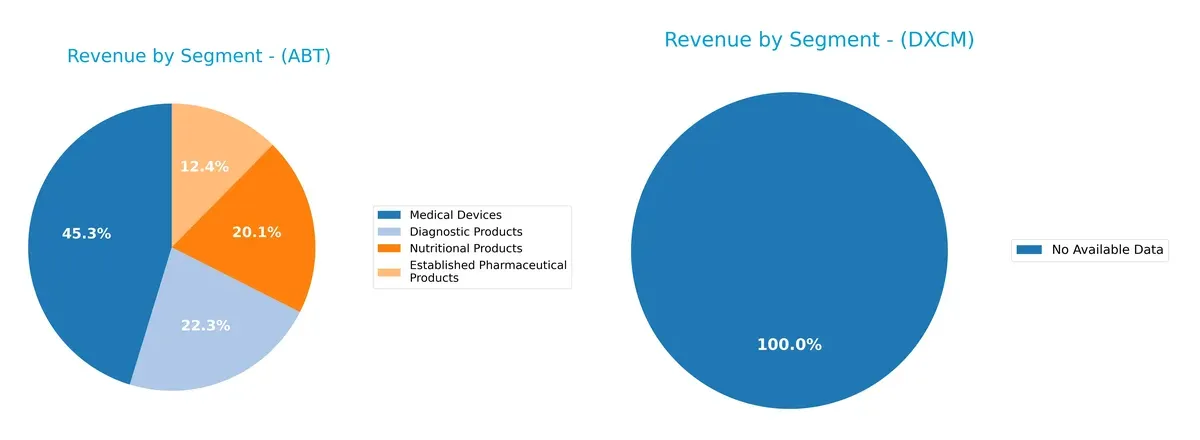
Abbott Laboratories boasts a highly diversified revenue base, spanning Medical Devices ($19B), Diagnostic Products ($9.3B), Nutritional Products ($8.4B), and Established Pharmaceuticals ($5.2B). Abbott’s broad mix anchors its ecosystem, reducing concentration risk and leveraging multiple healthcare verticals for resilience. DexCom lacks available segment data, preventing comparison.
Strengths and Weaknesses Comparison
This table compares the Strengths and Weaknesses of Abbott Laboratories and DexCom, Inc.:
Abbott Laboratories Strengths
- Diverse revenue streams across Diagnostics, Medical Devices, Pharmaceuticals, and Nutrition
- Strong global presence with $14.8B Non-US revenue in 2024
- Favorable net margin at 14.72%
- High interest coverage ratio at 25.18 supports debt servicing
DexCom, Inc. Strengths
- Strong profitability with ROE at 27.4% and ROIC at 10.2%
- Favorable net margin of 14.29%
- Healthy quick ratio at 1.28 indicates good liquidity
- Interest coverage ratio of 38.32 reflects solid earnings to cover interest
Abbott Laboratories Weaknesses
- Unfavorable ROE and ROIC at 0%, indicating weak capital efficiency
- Unfavorable liquidity ratios with current and quick ratios at 0
- High P/E of 33.55 suggests pricey valuation
- Asset turnover ratios unavailable, limiting operational efficiency assessment
DexCom, Inc. Weaknesses
- High P/E ratio at 54.61 and PB at 14.97 denote stretched valuation
- Debt-to-equity at 1.23 and debt-to-assets near 40% show leverage concerns
- No dividend yield limits income returns
- WACC higher than ROIC at 10.19% signals potential value destruction
Abbott’s strength lies in its diversified portfolio and global reach but suffers from capital efficiency and liquidity concerns. DexCom shows superior profitability and liquidity but faces valuation and leverage risks. These factors shape each firm’s strategic financial positioning.
The Moat Duel: Analyzing Competitive Defensibility
A structural moat is the only true shield protecting long-term profits from relentless competitive erosion. Let’s break down the moats of two healthcare device leaders:
Abbott Laboratories: Diversified Scale and Intangible Assets Moat
Abbott’s moat stems from its diversified product portfolio and strong brand recognition. This manifests in stable margins, but declining ROIC signals potential pressure. New diagnostics and global expansion could deepen its moat if innovation accelerates.
DexCom, Inc.: Innovation-Driven Network Effects Moat
DexCom’s competitive edge lies in its cutting-edge continuous glucose monitoring technology and ecosystem integration. Its growing ROIC and robust revenue growth show strengthening market grip, with further gains expected from new product launches and partnerships.
Innovation Edge vs. Diversified Scale: Who Defends Market Share Better?
DexCom holds a deeper, innovation-fueled moat with improving ROIC and rapid growth. Abbott’s broad diversification offers stability but faces margin and ROIC headwinds. DexCom is better positioned to protect and expand its market share in 2026.
Which stock offers better returns?
The past year reveals contrasting price dynamics for Abbott Laboratories and DexCom, Inc., with Abbott showing a steady decline and DexCom experiencing sharp downturns followed by recent recovery signs.
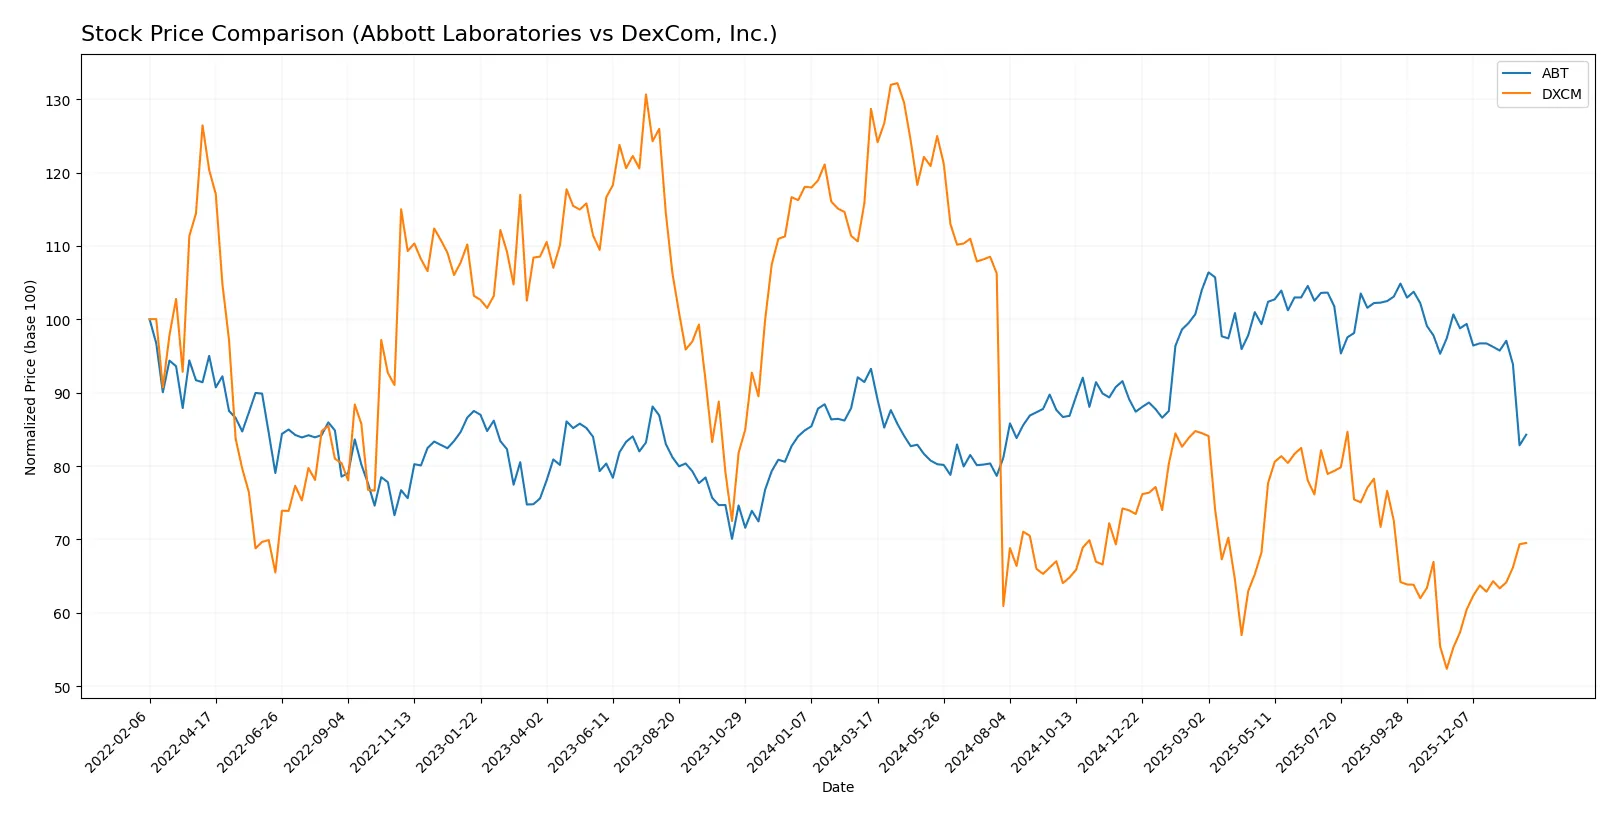
Trend Comparison
Abbott Laboratories’ stock fell 9.64% over the past year, marking a bearish trend with deceleration and a high volatility of 10.54. Its price ranged between 138.01 and 102.03.
DexCom, Inc. declined sharply by 46.0% over the same period, a bearish trend with accelerating losses and elevated volatility at 21.98. Recently, it rebounded 25.8%, showing early signs of recovery.
DexCom’s overall market performance lagged Abbott’s, despite its recent upward move. Abbott’s smaller decline reflects relatively better price stability through 2025–2026.
Target Prices
Analysts present a balanced target consensus for Abbott Laboratories and DexCom, reflecting cautious optimism.
| Company | Target Low | Target High | Consensus |
|---|---|---|---|
| Abbott Laboratories | 120 | 169 | 137.09 |
| DexCom, Inc. | 71 | 99 | 84.55 |
Abbott’s consensus target of 137.09 implies roughly 25% upside from the current 109.3 stock price. DexCom’s 84.55 target suggests a 16% potential gain versus the 73.04 market price.

Don’t Let Luck Decide Your Entry Point
Optimize your entry points with our advanced ProRealTime indicators. You’ll get efficient buy signals with precise price targets for maximum performance. Start outperforming now!
How do institutions grade them?
Abbott Laboratories Grades
The following table summarizes recent institutional grades for Abbott Laboratories:
| Grading Company | Action | New Grade | Date |
|---|---|---|---|
| Citigroup | Maintain | Buy | 2026-01-23 |
| BTIG | Maintain | Buy | 2026-01-23 |
| Evercore ISI Group | Maintain | Outperform | 2026-01-23 |
| Bernstein | Maintain | Outperform | 2026-01-23 |
| Piper Sandler | Maintain | Overweight | 2026-01-23 |
| Oppenheimer | Maintain | Outperform | 2026-01-23 |
| RBC Capital | Maintain | Outperform | 2026-01-23 |
| Bernstein | Maintain | Outperform | 2026-01-09 |
| Barclays | Maintain | Overweight | 2026-01-05 |
| BTIG | Maintain | Buy | 2025-11-20 |
DexCom, Inc. Grades
The following table summarizes recent institutional grades for DexCom, Inc.:
| Grading Company | Action | New Grade | Date |
|---|---|---|---|
| Barclays | Downgrade | Underweight | 2026-01-12 |
| Bernstein | Maintain | Outperform | 2026-01-09 |
| Mizuho | Maintain | Outperform | 2025-12-17 |
| Citigroup | Maintain | Buy | 2025-12-11 |
| Morgan Stanley | Upgrade | Overweight | 2025-12-02 |
| Morgan Stanley | Maintain | Equal Weight | 2025-11-10 |
| Argus Research | Maintain | Buy | 2025-11-07 |
| UBS | Maintain | Buy | 2025-11-03 |
| Barclays | Maintain | Equal Weight | 2025-11-03 |
| Truist Securities | Maintain | Buy | 2025-11-03 |
Which company has the best grades?
Abbott Laboratories consistently receives favorable grades, including multiple “Outperform” and “Buy” ratings, reflecting strong institutional confidence. DexCom, Inc. shows more mixed grades with recent downgrades from Barclays, which may introduce caution for investors. Abbott’s uniform positive outlook could suggest steadier institutional support.
Risks specific to each company
The following categories identify the critical pressure points and systemic threats facing both firms in the 2026 market environment:
1. Market & Competition
Abbott Laboratories
- Operates in diversified healthcare segments, facing intense competition from global medical device and pharma players.
DexCom, Inc.
- Focuses on continuous glucose monitoring, competing with established and emerging CGM and digital health companies.
2. Capital Structure & Debt
Abbott Laboratories
- Strong interest coverage of 25.18 but limited data on debt ratios; overall slightly favorable leverage profile.
DexCom, Inc.
- Higher debt-to-equity of 1.23 and 39.9% debt-to-assets signals elevated financial risk despite solid interest coverage.
3. Stock Volatility
Abbott Laboratories
- Beta of 0.72 implies lower volatility and defensive stock characteristics.
DexCom, Inc.
- Beta of 1.48 reflects higher volatility, sensitive to market swings and investor sentiment.
4. Regulatory & Legal
Abbott Laboratories
- Exposure to complex global healthcare regulations across pharma and device lines increases compliance costs and risks.
DexCom, Inc.
- Regulatory scrutiny on medical devices and digital health data privacy presents ongoing challenges.
5. Supply Chain & Operations
Abbott Laboratories
- Large global operations may face supply chain disruptions but benefit from scale and diversified sourcing.
DexCom, Inc.
- Smaller scale and reliance on specialized components make it more vulnerable to supply chain interruptions.
6. ESG & Climate Transition
Abbott Laboratories
- Increasing pressure to meet ESG standards across pharmaceutical manufacturing and device production.
DexCom, Inc.
- Innovates in digital health, but must address ESG risks related to device lifecycle and data security.
7. Geopolitical Exposure
Abbott Laboratories
- Broad international footprint exposes it to geopolitical risks, currency fluctuations, and trade tensions.
DexCom, Inc.
- More concentrated US-centric operations reduce geopolitical risk but limit global growth opportunities.
Which company shows a better risk-adjusted profile?
DexCom’s most significant risk lies in its leveraged capital structure and stock volatility. Abbott faces regulatory complexity and less favorable liquidity ratios. DexCom’s very strong Piotroski score and safe Altman Z-score suggest robust financial health despite debt. Abbott’s zero ROE and ROIC scores raise caution. Overall, DexCom presents a better risk-adjusted profile fueled by operational efficiency and strong profitability metrics, while Abbott’s diverse operations offer stability but with mixed financial signals.
Final Verdict: Which stock to choose?
Abbott Laboratories excels as a cash-generating powerhouse with solid margins and dependable income quality. Its main point of vigilance lies in a declining ROIC trend and unfavorable growth metrics, suggesting caution. It suits investors seeking steady dividend income within a conservative or income-focused portfolio.
DexCom’s strategic moat is its growing return on invested capital and innovation-led recurring revenue model in diabetes care. It offers stronger profitability metrics and a robust Piotroski score but carries higher financial leverage risks. It fits well in a Growth at a Reasonable Price (GARP) portfolio with a tolerance for volatility.
If you prioritize stable cash flow and income, Abbott Laboratories is the compelling choice due to its resilient margin profile and dividend yield. However, if you seek growth fueled by innovation and improving capital efficiency, DexCom offers better upside potential despite higher risk. Both require careful monitoring of their evolving fundamentals and market dynamics.
Disclaimer: Investment carries a risk of loss of initial capital. The past performance is not a reliable indicator of future results. Be sure to understand risks before making an investment decision.
Go Further
I encourage you to read the complete analyses of Abbott Laboratories and DexCom, Inc. to enhance your investment decisions: