Home > Comparison > Healthcare > ABT vs BSX
The strategic rivalry between Abbott Laboratories and Boston Scientific defines the current trajectory of the healthcare medical devices sector. Abbott operates as a diversified healthcare giant spanning pharmaceuticals, diagnostics, nutrition, and devices, while Boston Scientific focuses on specialized interventional medical technologies. This analysis explores their contrasting operational models and growth strategies to determine which offers a superior risk-adjusted outlook for diversified portfolios in an evolving healthcare landscape.
Table of contents
Companies Overview
Abbott Laboratories and Boston Scientific dominate the medical devices sector with broad global reach and innovation-driven models.
Abbott Laboratories: Global Healthcare Innovator
Abbott leads as a diversified healthcare giant with four core segments: pharmaceuticals, diagnostics, nutrition, and medical devices. Its revenue engine thrives on innovative diagnostics and cardiovascular devices. In 2026, Abbott sharpened its focus on expanding remote patient monitoring and precision diagnostics to fortify its competitive edge.
Boston Scientific Corporation: Interventional Medical Specialist
Boston Scientific excels in medical devices for interventional specialties, focusing on cardiovascular, rhythm management, and neuro therapies. Its revenue stems from high-tech implantable devices and minimally invasive solutions. The 2026 strategy emphasized advancing cardiac mapping and ablation technologies to capture growing demand in heart rhythm disorder treatments.
Strategic Collision: Similarities & Divergences
Both companies emphasize medical devices, yet Abbott prioritizes a diversified healthcare portfolio, while Boston Scientific specializes in interventional cardiology and neuro devices. They fiercely compete in cardiovascular innovation, particularly in rhythm management. Abbott’s broad product mix contrasts with Boston Scientific’s focused innovation, shaping distinct risk and growth profiles for investors to consider.
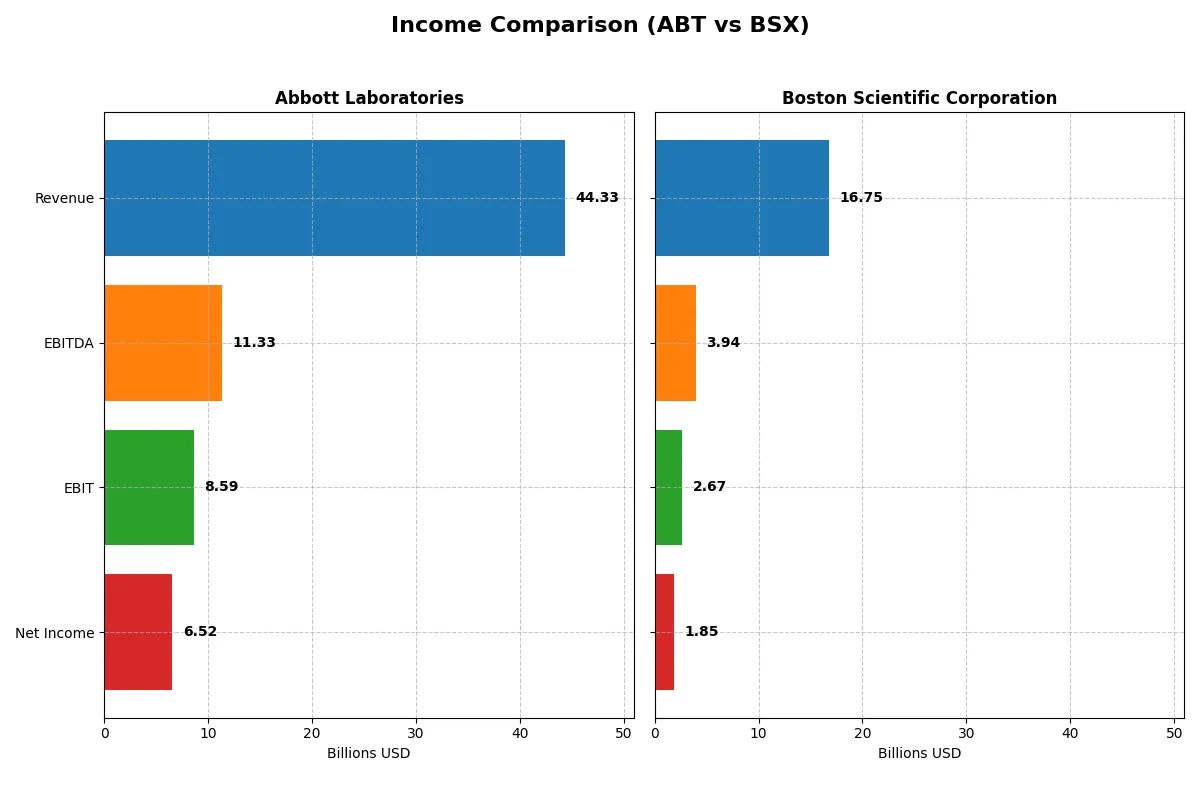
Income Statement Comparison
This data dissects the core profitability and scalability of both corporate engines to reveal who dominates the bottom line:
| Metric | Abbott Laboratories (ABT) | Boston Scientific Corporation (BSX) |
|---|---|---|
| Revenue | 44.3B | 16.7B |
| Cost of Revenue | 19.7B | 6.5B |
| Operating Expenses | 16.6B | 7.6B |
| Gross Profit | 24.6B | 10.3B |
| EBITDA | 11.3B | 3.9B |
| EBIT | 8.6B | 2.7B |
| Interest Expense | 341M | 387M |
| Net Income | 6.5B | 1.9B |
| EPS | 3.74 | 1.26 |
| Fiscal Year | 2025 | 2024 |
Income Statement Analysis: The Bottom-Line Duel
This income statement comparison reveals how Abbott Laboratories and Boston Scientific shape their financial efficiency through revenue and profit trends.
Abbott Laboratories Analysis
Abbott’s revenue grew modestly to $44.3B in 2025, with net income at $6.5B, reflecting a mixed performance over five years. Its gross margin holds strong at 55.5%, while net margin declined to 14.7%, signaling margin pressure despite a 12.7% EBIT growth. Efficiency faces challenges as net income and EPS dropped significantly in the latest year.
Boston Scientific Corporation Analysis
Boston Scientific expanded revenue sharply by 17.6% in 2024 to $16.7B, with net income rising to $1.85B, reflecting robust growth over five years. Its gross margin outperforms at 61.3%, and EBIT margin stands at a healthy 15.9%. Boston Scientific maintains momentum with strong EBIT and EPS growth, underscoring operational leverage and margin improvement.
Margin Strength vs. Growth Momentum
Boston Scientific leads with superior revenue and net income growth, paired with expanding margins, showcasing a dynamic growth profile. Abbott maintains higher absolute profit levels but struggles with shrinking net margins and earnings. For investors prioritizing growth and margin expansion, Boston Scientific’s profile appears more compelling despite Abbott’s scale.
Financial Ratios Comparison
These vital ratios act as a diagnostic tool to expose the underlying fiscal health, valuation premiums, and capital efficiency of the companies compared below:
| Ratios | Abbott Laboratories (ABT) | Boston Scientific Corporation (BSX) |
|---|---|---|
| ROE | 28.1% (2024) | 8.5% (2024) |
| ROIC | 9.9% (2024) | 6.1% (2024) |
| P/E | 14.6 (2024) | 70.9 (2024) |
| P/B | 4.1 (2024) | 6.0 (2024) |
| Current Ratio | 1.67 (2024) | 1.08 (2024) |
| Quick Ratio | 1.23 (2024) | 0.64 (2024) |
| D/E | 0.32 (2024) | 0.51 (2024) |
| Debt-to-Assets | 18.8% (2024) | 28.3% (2024) |
| Interest Coverage | 11.3 (2024) | 6.8 (2024) |
| Asset Turnover | 0.52 (2024) | 0.43 (2024) |
| Fixed Asset Turnover | 3.58 (2024) | 4.47 (2024) |
| Payout ratio | 28.6% (2024) | 0% (2024) |
| Dividend yield | 1.96% (2024) | 0% (2024) |
| Fiscal Year | 2024 | 2024 |
Efficiency & Valuation Duel: The Vital Signs
Financial ratios act as a company’s DNA, unveiling hidden risks and operational excellence critical for informed investment decisions.
Abbott Laboratories
Abbott shows a strong net margin of 14.72%, indicating solid profitability, but its ROE and ROIC are unavailable, limiting return insights. The stock trades at a stretched P/E of 33.55, reflecting high valuation. Abbott offers a modest 1.88% dividend yield, balancing payouts with reinvestment in R&D, visible in a 6.7% R&D-to-revenue ratio.
Boston Scientific Corporation
Boston Scientific posts a favorable net margin of 11.07%, though its ROE at 8.52% remains low versus peers. The P/E ratio at 70.89 signals an expensive valuation, compounded by a high P/B of 6.04. The company pays no dividend, opting instead to fuel growth through R&D, allocating nearly 9.6% of revenue to innovation.
Valuation Stretch vs. Profitability Resilience
Both companies face slightly unfavorable ratio profiles, with Boston Scientific’s valuation markedly more stretched. Abbott balances profitability and shareholder returns more evenly. Investors seeking income and moderate risk may lean toward Abbott, while growth-focused profiles might tolerate Boston Scientific’s premium.
Which one offers the Superior Shareholder Reward?
I see Abbott Laboratories (ABT) delivers a balanced shareholder reward via a 1.96% dividend yield and a modest 29% payout ratio. ABT sustains this with strong free cash flow coverage and steady buybacks. Boston Scientific (BSX) pays no meaningful dividend, opting instead for reinvestment and moderate buybacks. BSX’s aggressive growth focus inflates its valuation (P/E ~70), signaling risk. I favor ABT’s sustainable distribution model in 2026, offering a more attractive total return with lower valuation risk.
Comparative Score Analysis: The Strategic Profile
The radar chart reveals the fundamental DNA and trade-offs of Abbott Laboratories and Boston Scientific Corporation, highlighting their core financial strengths and weaknesses:
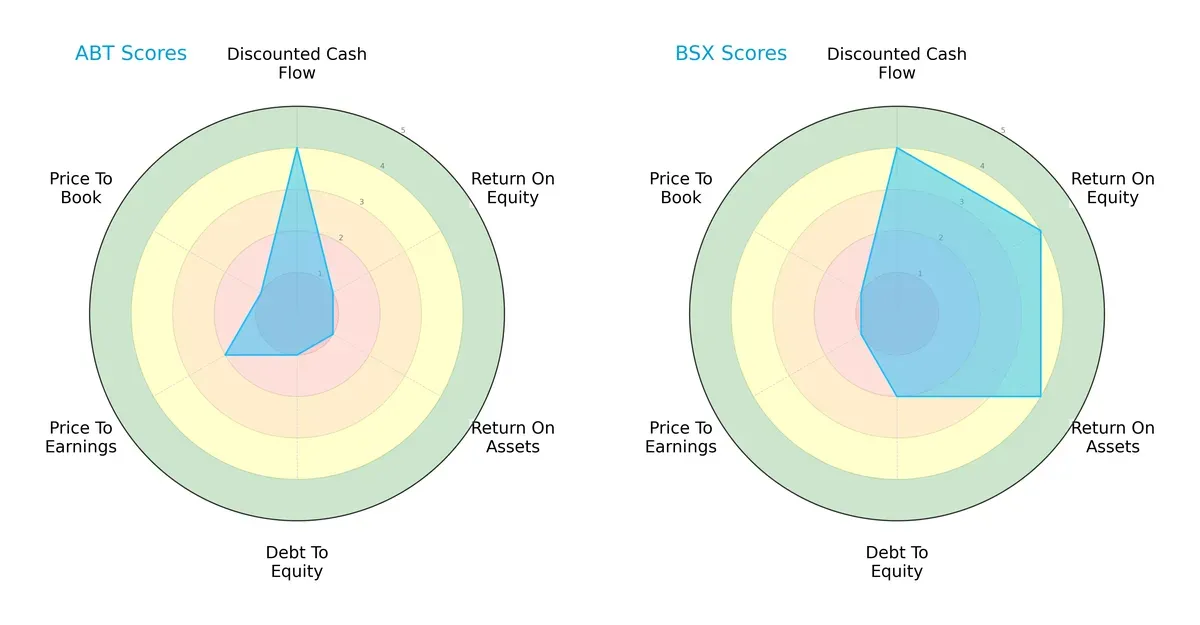
Boston Scientific exhibits a more balanced profile with strong ROE (4) and ROA (4) scores, indicating efficient profitability and asset use. Abbott shows strength only in discounted cash flow (4) but struggles with profitability (ROE 1, ROA 1) and financial leverage (Debt/Equity 1). Abbott’s valuation metrics (PE 2, PB 1) remain moderate to weak, while Boston Scientific’s valuation scores are low, suggesting potential overvaluation risks despite operational strength.
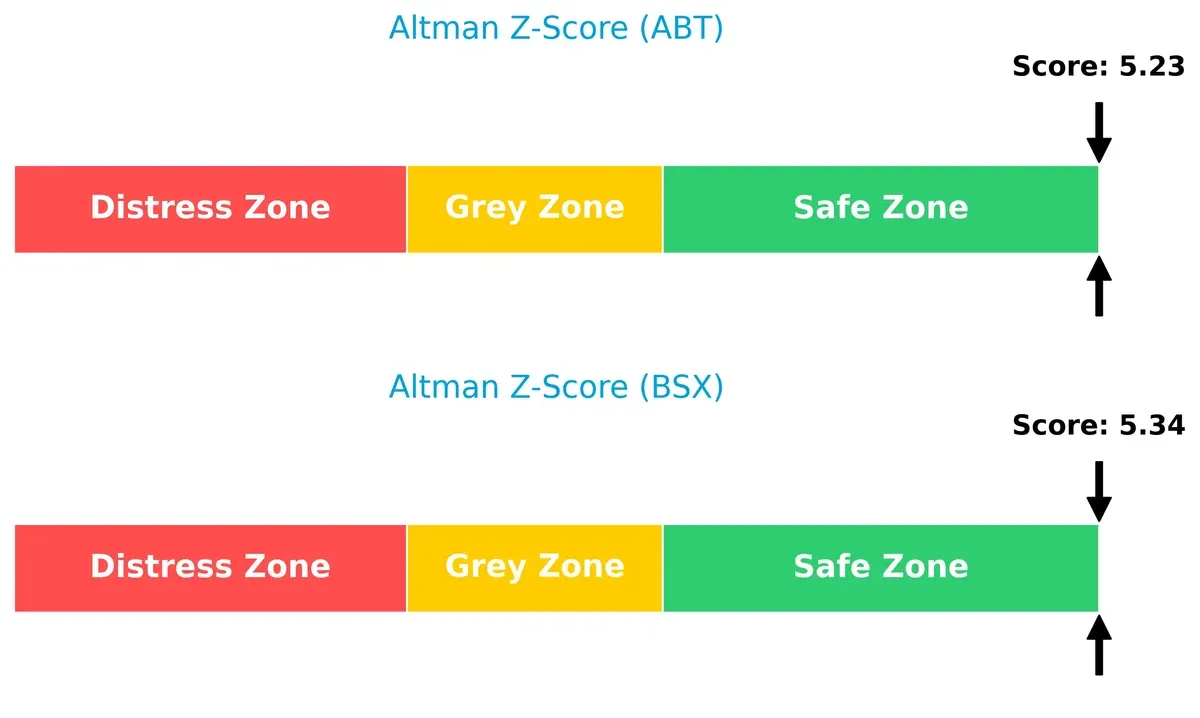
Bankruptcy Risk: Solvency Showdown
Both firms sit comfortably in the safe zone with Altman Z-Scores above 5, signaling robust financial stability and low bankruptcy risk in today’s volatile market cycle:
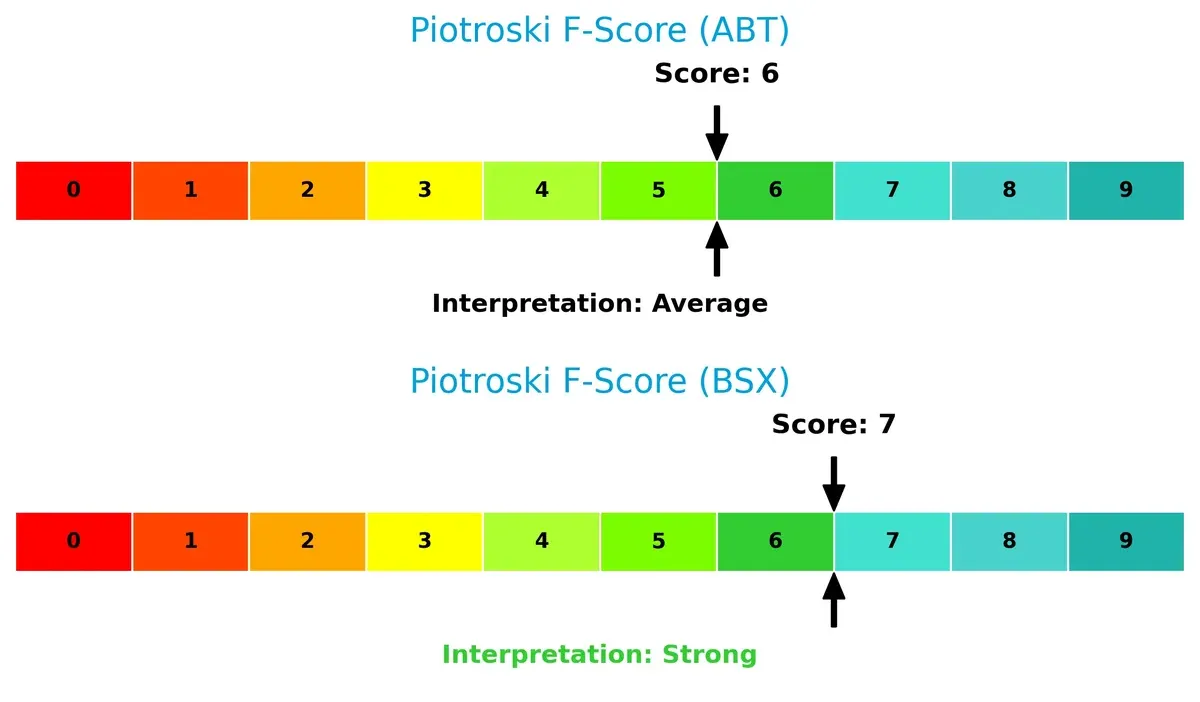
Financial Health: Quality of Operations
Boston Scientific leads with a Piotroski F-Score of 7, reflecting strong internal financial health and operational quality. Abbott’s score of 6, while decent, flags some weaknesses in its financial fundamentals compared to its peer:
How are the two companies positioned?
This section dissects Abbott and Boston Scientific’s operational DNA by comparing revenue distribution and internal dynamics. Its goal is to confront their economic moats to reveal which model delivers the most durable competitive advantage today.
Revenue Segmentation: The Strategic Mix
This visual comparison dissects how Abbott Laboratories and Boston Scientific diversify their income streams and where their primary sector bets lie:
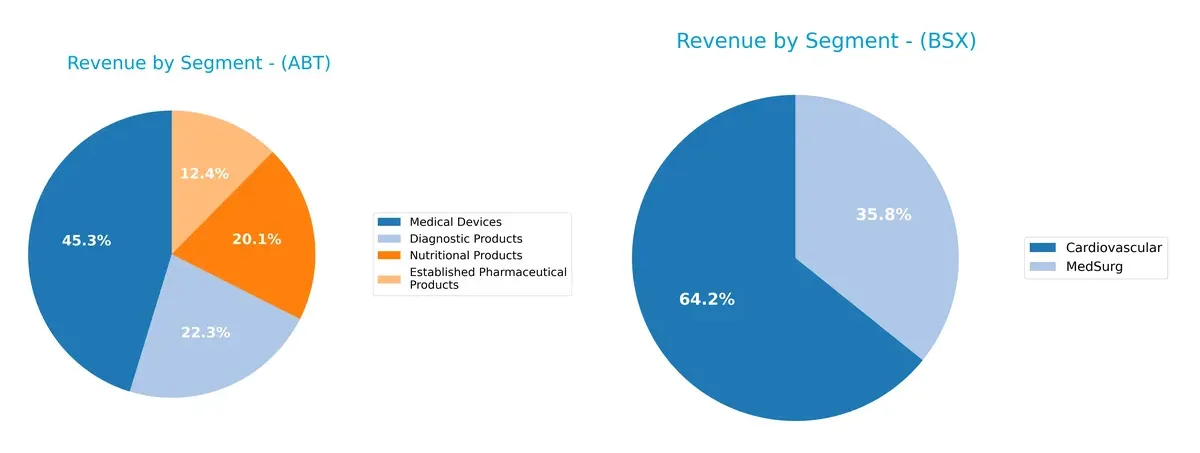
I observe Abbott Laboratories anchors its revenue in three major segments: Medical Devices at $19B, Diagnostic Products at $9.3B, and Nutritional Products at $8.4B. Its mix spreads risk across healthcare domains, supporting ecosystem lock-in. Boston Scientific, by contrast, pivots mainly on Cardiovascular ($10.8B) and MedSurg ($6B). This concentration signals infrastructure dominance but implies higher sector-specific risk versus Abbott’s broader diversification.
Strengths and Weaknesses Comparison
This table compares the strengths and weaknesses of Abbott Laboratories (ABT) and Boston Scientific Corporation (BSX):
ABT Strengths
- Diverse product segments including diagnostics, pharmaceuticals, devices, and nutrition
- Strong global presence with significant US and Non-US revenue
- Favorable net margin at 14.72%
- Low debt-to-assets ratio and high interest coverage ratio
BSX Strengths
- Focused cardiovascular and MedSurg product lines with growing revenue
- Favorable net margin at 11.07%
- Positive WACC and solid fixed asset turnover
- Moderate debt ratio with favorable interest coverage
- Established US market presence with growing international sales
ABT Weaknesses
- Unfavorable ROE and ROIC indicating efficiency concerns
- Unavailable WACC data limits cost of capital assessment
- High P/E ratio at 33.55 signals valuation risk
- Poor liquidity ratios (current and quick ratios at 0)
- Unfavorable asset and fixed asset turnover ratios
BSX Weaknesses
- Low ROE at 8.52% and neutral ROIC at 6.13% suggest profitability challenges
- High P/E at 70.89 and PB at 6.04 indicate overvaluation risk
- Unfavorable quick ratio at 0.64 shows liquidity issues
- Absence of dividend yield may deter income investors
- Asset turnover remains weak despite fixed asset efficiency
Both companies show strengths in profitability and market presence, but face challenges in capital efficiency and liquidity. These weaknesses highlight areas for operational focus and risk management in their strategic planning.
The Moat Duel: Analyzing Competitive Defensibility
A durable structural moat is the sole barrier protecting long-term profits from relentless competitive erosion. Let’s dissect the moats of Abbott Laboratories and Boston Scientific:
Abbott Laboratories: Diversified Innovation Moat
Abbott relies on intangible assets and broad product diversification, reflected in stable margins near 19% EBIT. However, declining ROIC signals looming pressure on capital efficiency in 2026.
Boston Scientific Corporation: Operational Efficiency Moat
Boston Scientific’s moat centers on cost advantages and a focus on interventional devices, driving strong revenue growth and improving ROIC. Its expanding product pipeline supports deeper moat prospects in 2026.
Moat Strength Showdown: Diversification vs. Operational Efficiency
Boston Scientific exhibits a more durable and expanding moat, with accelerating ROIC and robust growth, while Abbott’s declining capital returns suggest weakening competitive defenses. Boston Scientific is better positioned to defend market share.
Which stock offers better returns?
Over the past year, Abbott Laboratories’ stock declined steadily, while Boston Scientific Corporation delivered strong gains despite recent softness in trading momentum.
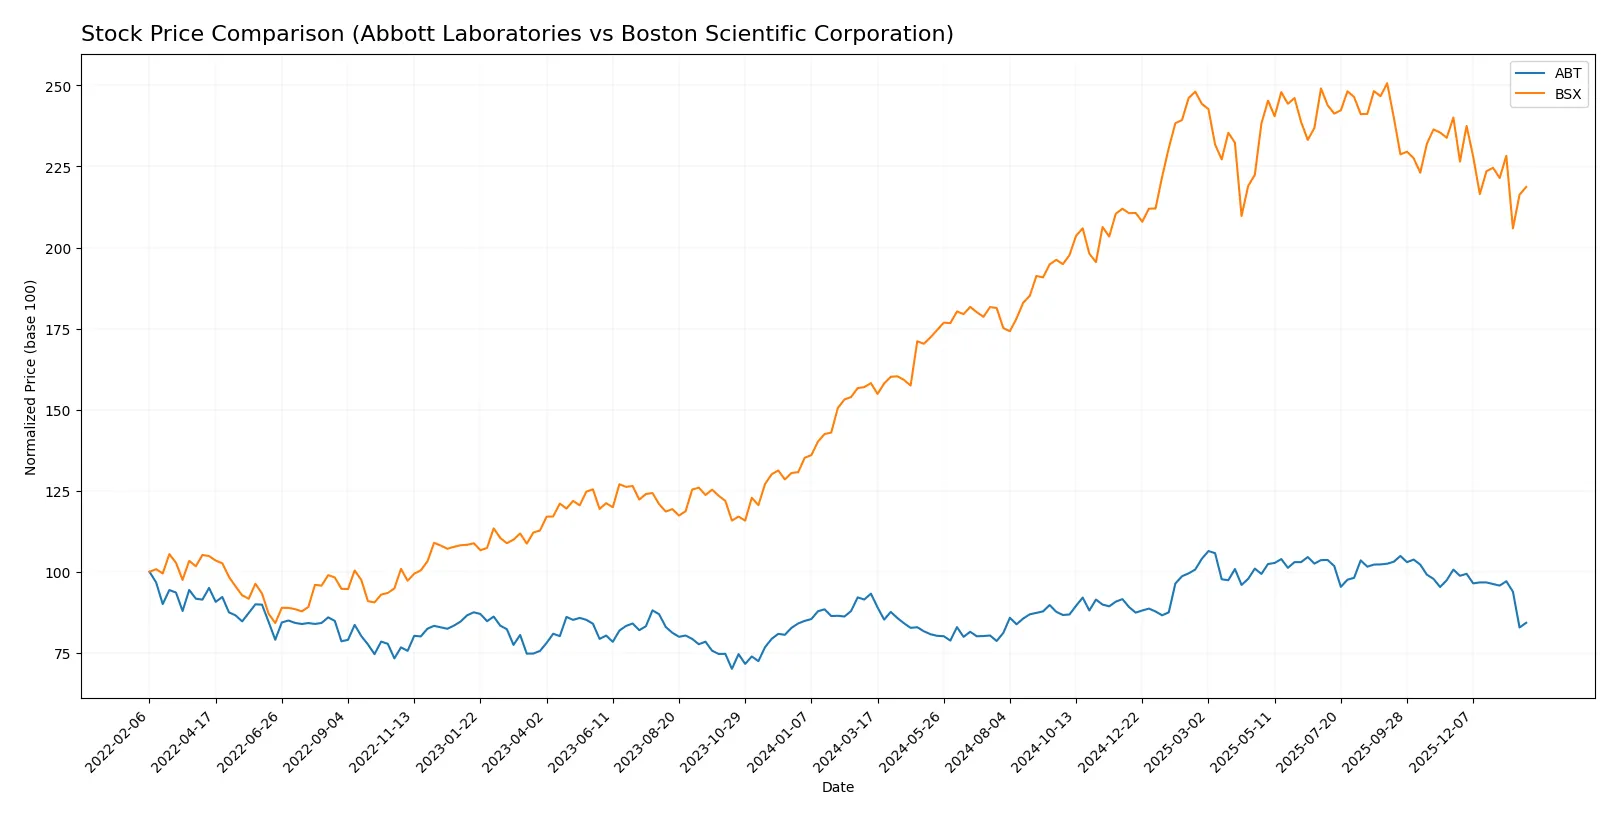
Trend Comparison
Abbott Laboratories’ stock fell 9.64% over the last 12 months, showing a bearish trend with deceleration. Price hit a high of 138.01 and a low of 102.03, with a volatility of 10.54%.
Boston Scientific Corporation surged 38.24% over the same period, reflecting a bullish trend with deceleration. Its price ranged from 66.23 to 107.22, accompanied by higher volatility at 12.01%.
Boston Scientific outperformed Abbott Laboratories significantly, posting the highest market returns despite both stocks showing recent downward momentum.
Target Prices
Analysts present a constructive consensus for Abbott Laboratories and Boston Scientific Corporation.
| Company | Target Low | Target High | Consensus |
|---|---|---|---|
| Abbott Laboratories | 120 | 169 | 137.09 |
| Boston Scientific Corporation | 100 | 140 | 124.67 |
Abbott’s target consensus of 137.09 is 25% above the current 109.3 price, signaling upside potential. Boston Scientific’s 124.67 target implies a 33% gain from 93.53, reflecting bullish analyst expectations.

Don’t Let Luck Decide Your Entry Point
Optimize your entry points with our advanced ProRealTime indicators. You’ll get efficient buy signals with precise price targets for maximum performance. Start outperforming now!
How do institutions grade them?
Abbott Laboratories Grades
The following table summarizes recent institutional grades for Abbott Laboratories:
| Grading Company | Action | New Grade | Date |
|---|---|---|---|
| Citigroup | Maintain | Buy | 2026-01-23 |
| BTIG | Maintain | Buy | 2026-01-23 |
| Evercore ISI Group | Maintain | Outperform | 2026-01-23 |
| Bernstein | Maintain | Outperform | 2026-01-23 |
| Piper Sandler | Maintain | Overweight | 2026-01-23 |
| Oppenheimer | Maintain | Outperform | 2026-01-23 |
| RBC Capital | Maintain | Outperform | 2026-01-23 |
| Bernstein | Maintain | Outperform | 2026-01-09 |
| Barclays | Maintain | Overweight | 2026-01-05 |
| BTIG | Maintain | Buy | 2025-11-20 |
Boston Scientific Corporation Grades
The following table summarizes recent institutional grades for Boston Scientific Corporation:
| Grading Company | Action | New Grade | Date |
|---|---|---|---|
| Oppenheimer | Maintain | Outperform | 2026-01-16 |
| Truist Securities | Maintain | Buy | 2025-12-18 |
| Canaccord Genuity | Maintain | Buy | 2025-12-17 |
| RBC Capital | Maintain | Outperform | 2025-12-17 |
| BTIG | Maintain | Buy | 2025-11-21 |
| Truist Securities | Maintain | Buy | 2025-10-23 |
| Canaccord Genuity | Maintain | Buy | 2025-10-23 |
| Wells Fargo | Maintain | Overweight | 2025-10-23 |
| Morgan Stanley | Maintain | Overweight | 2025-10-23 |
| UBS | Maintain | Buy | 2025-10-23 |
Which company has the best grades?
Abbott Laboratories and Boston Scientific both receive strong institutional support with mostly Buy, Outperform, and Overweight grades. Abbott shows a slightly higher frequency of Outperform ratings. This could indicate stronger analyst conviction, potentially influencing investor confidence positively.
Risks specific to each company
The following categories identify the critical pressure points and systemic threats facing both firms in the 2026 market environment:
1. Market & Competition
Abbott Laboratories
- Large market cap (190B) supports competitive resilience but faces pricing pressure and innovation demands.
Boston Scientific Corporation
- Smaller market cap (139B) with growth potential but high valuation (PE 70.9) raises competitive risk amid innovation race.
2. Capital Structure & Debt
Abbott Laboratories
- Strong interest coverage (25.18) and favorable debt metrics indicate solid financial stability.
Boston Scientific Corporation
- Moderate debt-to-equity (0.51) and interest coverage (6.9) suggest manageable but higher leverage risk.
3. Stock Volatility
Abbott Laboratories
- Beta 0.72 signals moderate volatility, lower than market average, aiding risk management.
Boston Scientific Corporation
- Beta 0.67 indicates slightly lower volatility, offering a stable risk profile relative to peers.
4. Regulatory & Legal
Abbott Laboratories
- Exposure to pharmaceutical regulations and diagnostic approvals increases compliance risks.
Boston Scientific Corporation
- Medical device regulation and product liability remain significant, with evolving safety standards.
5. Supply Chain & Operations
Abbott Laboratories
- Complex global supply chain for diversified products may face disruption risks.
Boston Scientific Corporation
- Concentrated manufacturing footprint could be vulnerable to operational interruptions.
6. ESG & Climate Transition
Abbott Laboratories
- Increasing pressure to improve sustainability in manufacturing and product lifecycle.
Boston Scientific Corporation
- Active in innovation, but ESG metrics may lag peers, posing reputational risks.
7. Geopolitical Exposure
Abbott Laboratories
- Global operations expose company to trade tensions and regulatory divergence.
Boston Scientific Corporation
- US-centric, but international sales subject to geopolitical uncertainty and currency fluctuations.
Which company shows a better risk-adjusted profile?
Abbott faces its largest risk in regulatory complexity due to its pharmaceutical and diagnostic segments. Boston Scientific’s most impactful risk is its stretched valuation amid competitive pressures. Despite some leverage concerns, Boston Scientific’s stronger profitability scores and safer Altman Z-Score indicate a slightly better risk-adjusted profile. Recent data show Abbott’s unfavorable ROE and liquidity ratios warrant caution despite its size and interest coverage strength.
Final Verdict: Which stock to choose?
Abbott Laboratories stands out as a cash-generating powerhouse with a solid gross margin and favorable interest coverage. Its point of vigilance lies in declining returns on invested capital and net income pressures. It suits portfolios seeking steady income with some tolerance for cyclical earnings variability.
Boston Scientific’s strategic moat lies in its growing return on capital and robust revenue expansion, supported by strong income quality. Despite higher leverage and valuation multiples, it offers relatively better stability than Abbott in growth execution. It fits well in GARP-oriented portfolios balancing growth and valuation discipline.
If you prioritize reliable cash flow and dividend income, Abbott Laboratories is the compelling choice due to its operational efficiency and scale. However, if you seek growth with improving profitability and a rising ROIC trend, Boston Scientific offers better stability and upside potential despite its higher leverage and multiple.
Disclaimer: Investment carries a risk of loss of initial capital. The past performance is not a reliable indicator of future results. Be sure to understand risks before making an investment decision.
Go Further
I encourage you to read the complete analyses of Abbott Laboratories and Boston Scientific Corporation to enhance your investment decisions: