Home > Comparison > Healthcare > ABT vs ALGN
The strategic rivalry between Abbott Laboratories and Align Technology defines the current trajectory of the healthcare medical devices sector. Abbott operates as a diversified healthcare giant with multiple product lines, while Align focuses on high-margin, innovative orthodontic devices and digital services. This head-to-head reflects a battle between broad-based stability and focused growth potential. This analysis aims to identify which corporate model offers the best risk-adjusted returns for a diversified portfolio.
Table of contents
Companies Overview
Abbott Laboratories and Align Technology, Inc. are pivotal players transforming the medical devices landscape through innovation and scale.
Abbott Laboratories: Healthcare Giant with Diversified Medical Solutions
Abbott Laboratories leads as a diversified healthcare company with a strong foothold in medical devices, diagnostics, pharmaceuticals, and nutrition. Its core revenue derives from a broad portfolio including cardiovascular devices, diagnostic systems, and generic pharmaceuticals. In 2026, Abbott strategically focused on expanding its diagnostic and cardiovascular device segments, leveraging innovation to sustain its global market dominance.
Align Technology, Inc.: Clear Aligner Innovator
Align Technology stands out for its specialization in clear aligner orthodontics and digital scanning technology. Its revenue engine centers on Invisalign aligners and iTero scanners, marketed globally to orthodontists and dentists. In 2026, Align prioritized enhancing its scanner software and expanding its product range for younger patients, aiming to deepen market penetration through technology-driven orthodontic solutions.
Strategic Collision: Similarities & Divergences
Both companies operate within the medical devices sector but diverge sharply in scope and approach. Abbott pursues a diversified portfolio across multiple healthcare segments, while Align focuses on a niche, tech-driven orthodontic ecosystem. Their primary battleground lies in advancing medical device innovation, yet Abbott’s scale contrasts with Align’s agility. Investors face distinct profiles: Abbott offers broad stability; Align presents growth through specialized innovation.
Income Statement Comparison
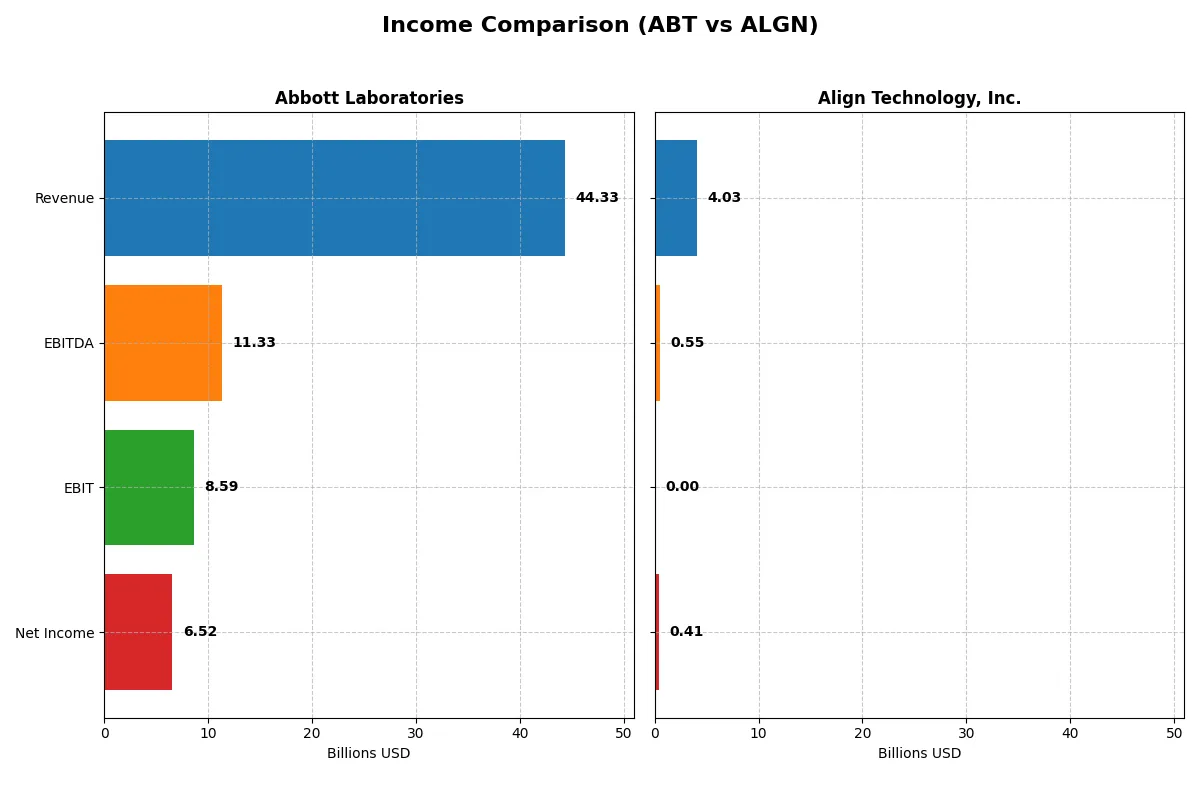
The following data dissects the core profitability and scalability of both corporate engines to reveal who dominates the bottom line:
| Metric | Abbott Laboratories (ABT) | Align Technology, Inc. (ALGN) |
|---|---|---|
| Revenue | 44.3B | 4.0B |
| Cost of Revenue | 19.7B | 1.3B |
| Operating Expenses | 16.6B | 2.1B |
| Gross Profit | 24.6B | 2.7B |
| EBITDA | 11.3B | 546M |
| EBIT | 8.6B | 0 |
| Interest Expense | 341M | 0 |
| Net Income | 6.5B | 410M |
| EPS | 3.74 | 5.66 |
| Fiscal Year | 2025 | 2025 |
Income Statement Analysis: The Bottom-Line Duel
This income statement comparison reveals which company operates its business with greater efficiency and margin discipline over recent years.
Abbott Laboratories Analysis
Abbott’s revenue climbed steadily from 43B in 2021 to 44.3B in 2025, while net income showed volatility, peaking at 13.4B in 2024 before dropping to 6.5B in 2025. Gross margins remain solid around 55.5%, reflecting consistent cost control. However, net margin contraction and EPS decline in 2025 signal emerging profitability pressures despite stable revenue growth.
Align Technology, Inc. Analysis
Align’s revenue hovered near 4B from 2021 to 2025, with net income retreating sharply from 772M in 2021 to 410M in 2025. The company boasts a superior gross margin of 67%, but its EBIT margin fell to zero in 2025, indicating operational challenges. The sharp net income decline and margin compression highlight struggles to convert top-line into sustainable profits.
Margin Strength vs. Profit Stability
Abbott leads in revenue scale and delivers healthier gross and EBIT margins despite recent net income volatility. Align excels in gross margin but fails to sustain operating profitability, causing net income to plummet. For investors, Abbott’s larger, more stable earnings profile offers greater fundamental strength amid sector headwinds compared to Align’s shrinking profit base.
Financial Ratios Comparison
These vital ratios act as a diagnostic tool to expose underlying fiscal health, valuation premiums, and capital efficiency for Abbott Laboratories (ABT) and Align Technology, Inc. (ALGN):
| Ratios | Abbott Laboratories (ABT) | Align Technology, Inc. (ALGN) |
|---|---|---|
| ROE | 28.1% | 10.9% |
| ROIC | 9.9% | 10.0% |
| P/E | 14.6 | 37.1 |
| P/B | 4.1 | 4.1 |
| Current Ratio | 1.67 | 1.22 |
| Quick Ratio | 1.23 | 1.10 |
| D/E | 0.32 | 0.03 |
| Debt-to-Assets | 18.8% | 1.9% |
| Interest Coverage | 11.3 | N/A |
| Asset Turnover | 0.52 | 0.64 |
| Fixed Asset Turnover | 3.58 | 2.89 |
| Payout ratio | 28.6% | 0% |
| Dividend yield | 1.96% | 0% |
| Fiscal Year | 2025 | 2024 |
Efficiency & Valuation Duel: The Vital Signs
Financial ratios act as a company’s DNA, revealing hidden risks and operational excellence that raw numbers often mask.
Abbott Laboratories
Abbott shows a strong net margin of 14.7%, indicating efficient core profitability. However, its ROE and ROIC are unfavorable or unavailable, suggesting challenges in capital efficiency. The stock trades at a stretched P/E of 33.55, reflecting high valuation. Abbott offers a modest dividend yield of 1.88%, balancing shareholder returns with careful reinvestment.
Align Technology, Inc.
Align posts a favorable net margin of 10.5% and neutral ROE (10.9%) and ROIC (10.0%), signaling moderate profitability and capital use. Its valuation appears expensive with a P/E of 37.05 and a high P/B of 4.05. Align pays no dividend, signaling growth focus and reinvestment in R&D (9.1% of revenue), aiming for expansion over yield.
Valuation Stretch vs. Operational Balance
Abbott offers stronger profitability and shareholder returns but struggles with capital efficiency. Align balances moderate returns with a neutral ratio profile and no dividend. Investors seeking income may lean toward Abbott, while those favoring growth and reinvestment might prefer Align’s profile.
Which one offers the Superior Shareholder Reward?
Abbott Laboratories (ABT) pays a steady dividend with a yield near 1.9%, supported by a conservative payout ratio around 63%. Its free cash flow comfortably covers distributions, indicating sustainability. ABT also executes moderate buybacks, enhancing shareholder value steadily. Align Technology (ALGN) pays no dividend, instead reinvesting heavily in growth and R&D. ALGN’s buyback program is less prominent but free cash flow margins remain strong. Historically, ABT’s balanced distribution model offers more predictable total returns in 2026. I conclude Abbott delivers superior shareholder reward through a mix of dividends and buybacks, while Align’s growth focus entails higher risk and less immediate yield.
Comparative Score Analysis: The Strategic Profile
The radar chart reveals the fundamental DNA and trade-offs of Abbott Laboratories and Align Technology, highlighting their financial strengths and weaknesses:
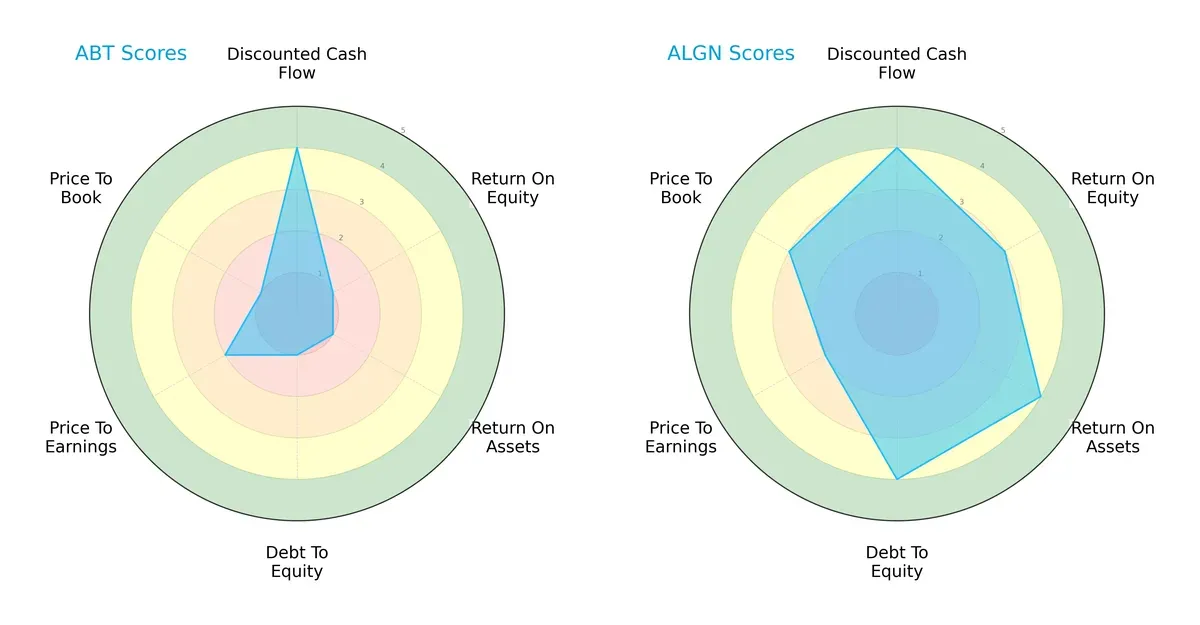
Align Technology dominates in return metrics with a strong ROE (3) and ROA (4), signaling efficient profit and asset use. Abbott shows a more moderate discounted cash flow score (4) but lags significantly in profitability and leverage, with very unfavorable scores in ROE (1), ROA (1), and debt-to-equity (1). Align’s balanced profile extends to valuation metrics (P/B of 3 vs. Abbott’s 1), suggesting it leverages multiple competitive edges. Abbott relies primarily on discounted cash flow strength but carries notable financial risks.
Bankruptcy Risk: Solvency Showdown
Align Technology and Abbott Laboratories both reside comfortably in the safe zone by Altman Z-Score, but the difference is telling:
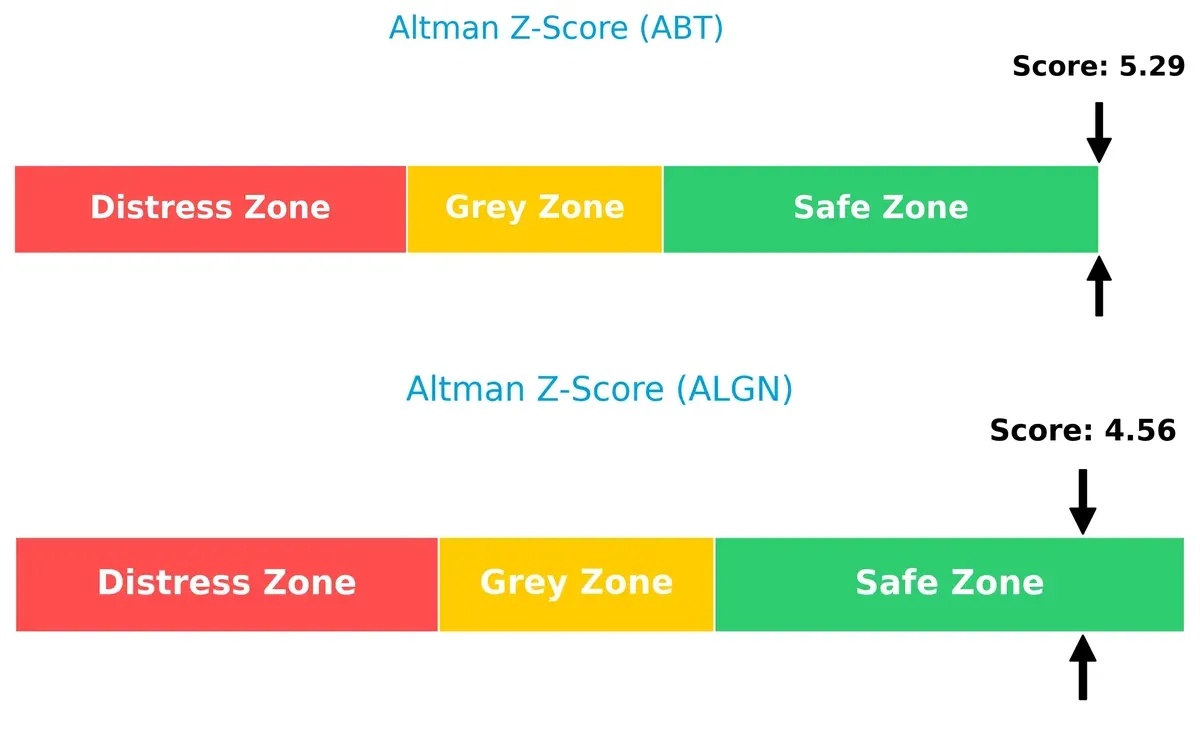
Abbott’s higher Altman Z-Score (5.29) suggests superior solvency and resilience versus Align’s 4.56. Historically, firms above 3 withstand downturns better, and Abbott’s score implies a stronger buffer against financial distress in this late-cycle environment.
Financial Health: Quality of Operations
Align Technology edges Abbott in operational quality, reflected in its Piotroski F-Score:
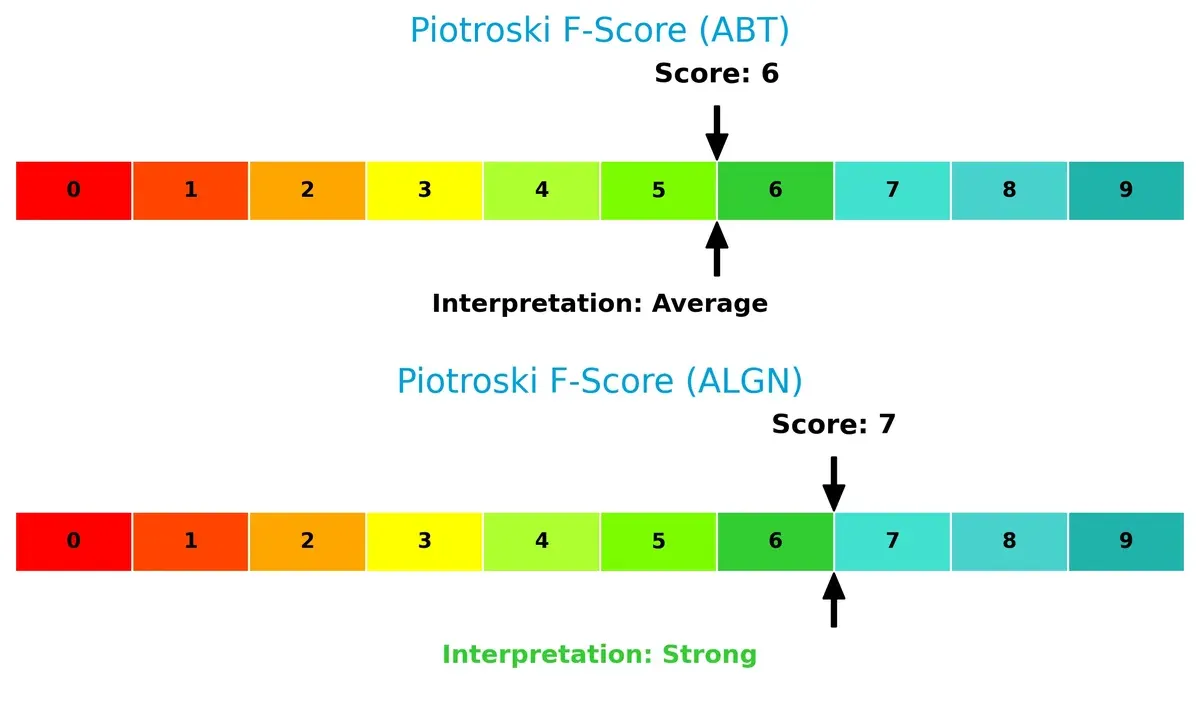
Align’s score of 7 signals strong internal financial health, with solid profitability, efficiency, and liquidity metrics. Abbott’s average score of 6 indicates acceptable health but raises mild caution on some internal factors. Investors should monitor Abbott’s internal metrics for potential red flags relative to Align’s stronger operational footing.
How are the two companies positioned?
This section dissects the operational DNA of Abbott and Align by comparing their revenue distribution and internal dynamics. The goal is to confront their economic moats to identify which model offers the most resilient competitive edge today.
Revenue Segmentation: The Strategic Mix
This visual comparison dissects how Abbott Laboratories and Align Technology diversify their income streams and where their primary sector bets lie:
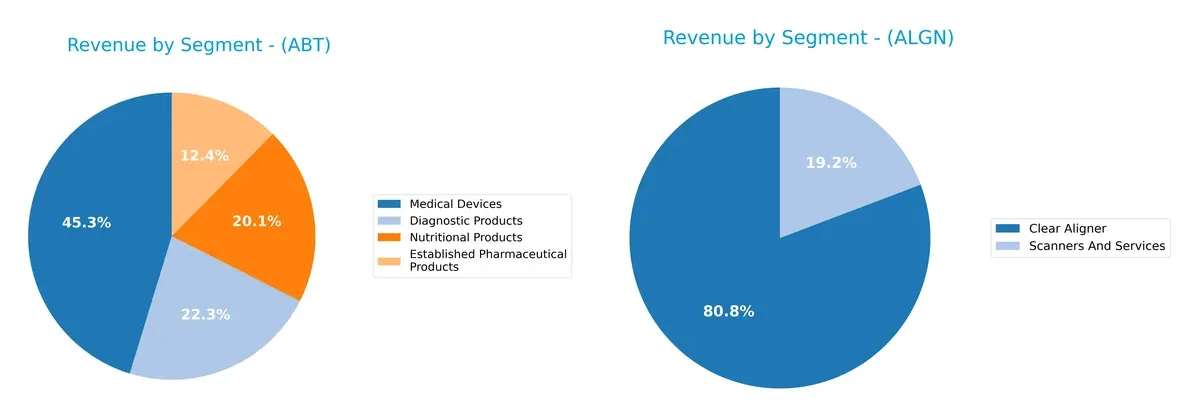
Abbott Laboratories commands a broad revenue base, with Medical Devices at $19B anchoring its portfolio alongside Diagnostic ($9.3B), Nutritional ($8.4B), and Pharmaceuticals ($5.2B). In contrast, Align Technology pivots heavily on its Clear Aligner segment, generating $3.2B, dwarfing Scanners and Services at $769M. Abbott’s diversification reduces concentration risk and leverages multiple healthcare ecosystems. Align’s reliance on Clear Aligners signals a focused moat but exposes it to market shifts in orthodontics.
Strengths and Weaknesses Comparison
This table compares the Strengths and Weaknesses of Abbott Laboratories and Align Technology, Inc.:
Abbott Laboratories Strengths
- Diversified revenue across Diagnostic, Medical Devices, Pharmaceuticals, Nutrition
- Strong global presence with substantial US and Non-US sales
- Favorable net margin of 14.72%
- High interest coverage ratio of 25.18
- Low debt-to-assets ratio indicating conservative leverage
Align Technology Strengths
- Focused innovation in Clear Aligner and Scanners segments
- Favorable net margin of 10.54%
- Healthy quick ratio of 1.1 and low debt-to-equity of 0.03
- Neutral asset turnover ratios suggest efficient asset use
- Expanding international presence including US, Switzerland, and Other International markets
Abbott Laboratories Weaknesses
- Unfavorable ROE and ROIC at 0% indicate weak capital returns
- Unfavorable current and quick ratios raise liquidity concerns
- Unfavorable PE ratio at 33.55 and zero PB ratio data
- Asset turnover metrics are unfavorable, indicating inefficiency
- Slightly unfavorable overall financial ratio profile
Align Technology Weaknesses
- Unfavorable PE at 37.05 and high PB of 4.05 suggest possible overvaluation
- Unfavorable interest coverage ratio at 0 raises solvency risk
- No dividend yield reduces income appeal
- Neutral ROE and ROIC around 10% may limit capital efficiency upside
- Less diversified revenue, concentrated in Clear Aligners and related services
Abbott demonstrates notable diversification and financial conservatism but faces challenges in capital efficiency and liquidity. Align shows innovation strength and solid liquidity but risks valuation and solvency concerns due to concentrated product exposure. Each company’s financial profile shapes distinct strategic priorities.
The Moat Duel: Analyzing Competitive Defensibility
A structural moat is the sole shield guarding long-term profits against relentless competitive erosion. Let’s dissect the nature of these moats:
Abbott Laboratories: Diversified Product Portfolio Moat
Abbott’s moat stems from its broad healthcare product range, spanning pharmaceuticals to diagnostics. This diversification stabilizes margins around 19% EBIT, though ROIC trends decline. Expansion into diagnostics and remote monitoring could bolster this moat in 2026.
Align Technology, Inc.: Innovation-Driven Network Effects
Align dominates with its Invisalign system, supported by a digital scanner ecosystem creating high switching costs. Despite a 67% gross margin, EBIT margins falter. Continued tech upgrades and global market penetration offer growth, but margin pressure signals risks.
Moat Strength Showdown: Diversification vs. Digital Ecosystem
Abbott’s diversified portfolio offers a wider moat by cushioning against sector shocks, unlike Align’s narrower but innovative moat. I see Abbott better positioned to defend and grow market share amid evolving healthcare demands.
Which stock offers better returns?
Both Abbott Laboratories and Align Technology, Inc. experienced notable price shifts over the past year, with distinct trading volumes and trend dynamics shaping their market performance.
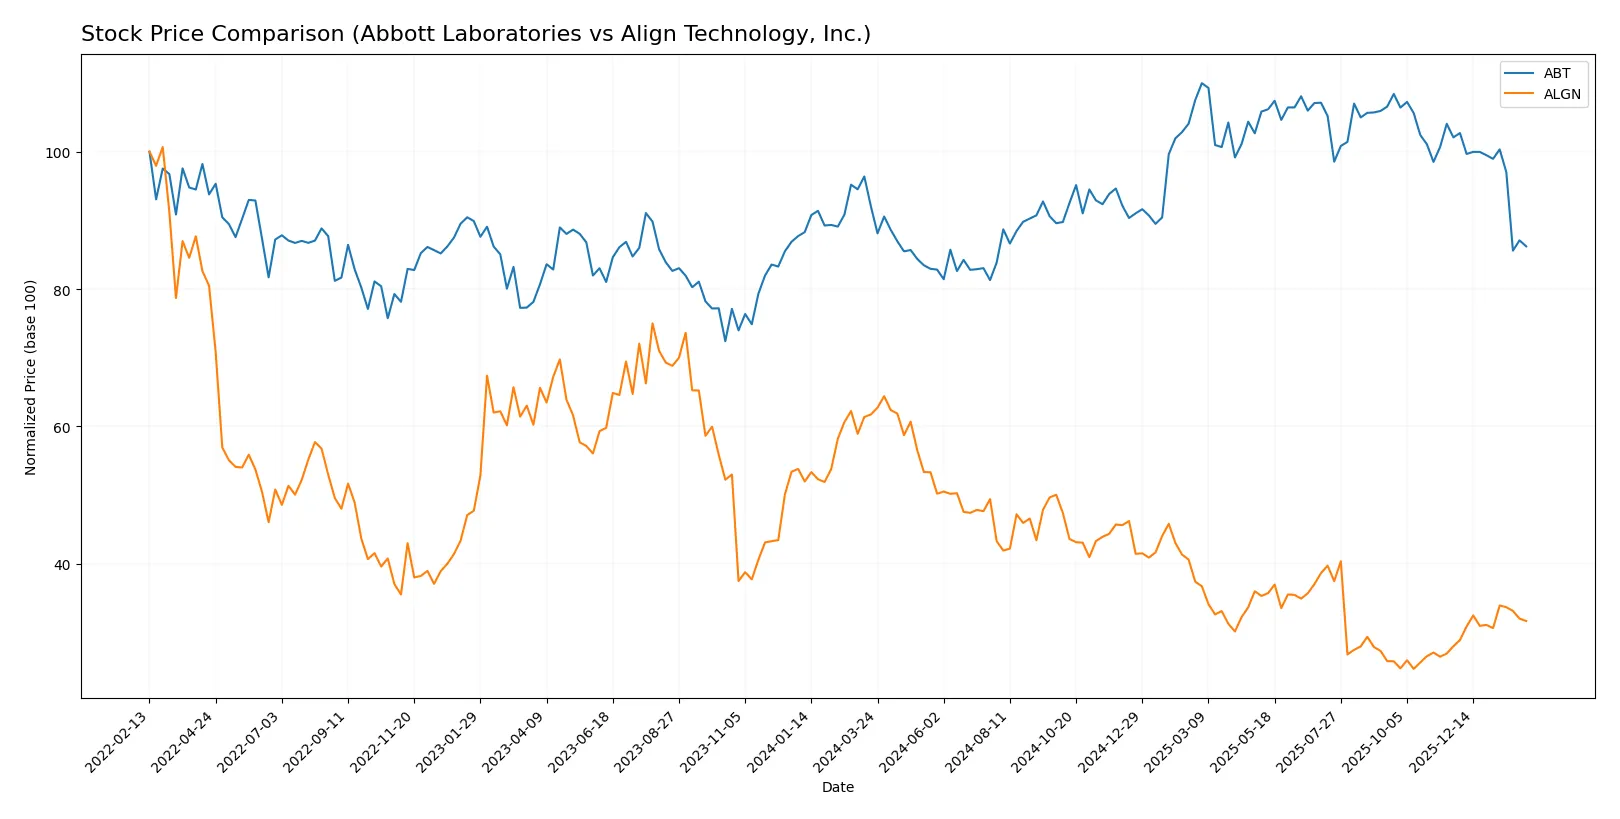
Trend Comparison
Abbott Laboratories’ stock declined 6.31% over the past year, showing a bearish trend with decelerating negative momentum and a high volatility level of 10.62. The price ranged between 102.03 and 138.01.
Align Technology’s stock plunged 48.69% over the same period, reflecting a bearish trend with accelerating losses and extreme volatility at 50.54. The price fluctuated widely from 125.79 to 327.92.
Comparing both, Abbott Laboratories delivered the highest market performance with a less severe decline and more stable price movement than Align Technology’s steep losses and volatility.
Target Prices
Analysts present a bullish consensus for Abbott Laboratories and Align Technology, reflecting confidence in their growth prospects.
| Company | Target Low | Target High | Consensus |
|---|---|---|---|
| Abbott Laboratories | 120 | 152 | 134.64 |
| Align Technology, Inc. | 140 | 200 | 176.43 |
Abbott’s consensus target of 134.64 implies a 24% upside from the current 108.2 price. Align Technology’s 176.43 target suggests a 9% gain from 161.3, signaling strong analyst optimism.

Don’t Let Luck Decide Your Entry Point
Optimize your entry points with our advanced ProRealTime indicators. You’ll get efficient buy signals with precise price targets for maximum performance. Start outperforming now!
How do institutions grade them?
Abbott Laboratories Grades
Below is a summary of recent institutional grades for Abbott Laboratories:
| Grading Company | Action | New Grade | Date |
|---|---|---|---|
| Barclays | maintain | Overweight | 2026-02-02 |
| Evercore ISI Group | maintain | Outperform | 2026-01-23 |
| Bernstein | maintain | Outperform | 2026-01-23 |
| Piper Sandler | maintain | Overweight | 2026-01-23 |
| Citigroup | maintain | Buy | 2026-01-23 |
| Oppenheimer | maintain | Outperform | 2026-01-23 |
| RBC Capital | maintain | Outperform | 2026-01-23 |
| BTIG | maintain | Buy | 2026-01-23 |
| Bernstein | maintain | Outperform | 2026-01-09 |
| Barclays | maintain | Overweight | 2026-01-05 |
Align Technology, Inc. Grades
Here are the latest institutional grades for Align Technology, Inc.:
| Grading Company | Action | New Grade | Date |
|---|---|---|---|
| Mizuho | maintain | Outperform | 2026-01-20 |
| Piper Sandler | maintain | Overweight | 2025-10-30 |
| Morgan Stanley | maintain | Equal Weight | 2025-10-30 |
| Wells Fargo | maintain | Overweight | 2025-10-30 |
| Evercore ISI Group | maintain | Outperform | 2025-10-30 |
| Morgan Stanley | maintain | Equal Weight | 2025-10-21 |
| UBS | maintain | Neutral | 2025-10-16 |
| Mizuho | maintain | Outperform | 2025-10-13 |
| Jefferies | downgrade | Hold | 2025-10-10 |
| Evercore ISI Group | maintain | Outperform | 2025-10-08 |
Which company has the best grades?
Abbott Laboratories consistently receives high marks, mostly “Outperform” and “Buy,” signaling strong institutional confidence. Align Technology shows more mixed grades, including some “Equal Weight” and a recent downgrade to “Hold,” indicating more cautious sentiment. Investors might view Abbott as the more favored choice based on current institutional grading trends.
Risks specific to each company
The following categories identify the critical pressure points and systemic threats facing both firms in the 2026 market environment:
1. Market & Competition
Abbott Laboratories
- Operates in diversified healthcare segments; faces intense competition in medical devices and diagnostics.
Align Technology, Inc.
- Focused on orthodontic devices with strong innovation but highly competitive niche market.
2. Capital Structure & Debt
Abbott Laboratories
- Favorable debt metrics with strong interest coverage; low leverage reduces financial risk.
Align Technology, Inc.
- Low debt-to-equity ratio, manageable leverage, but interest coverage appears weak or unreported, signaling potential risk.
3. Stock Volatility
Abbott Laboratories
- Beta of 0.75 indicates lower volatility than the market, appealing to risk-averse investors.
Align Technology, Inc.
- Beta of 1.83 signals high stock price volatility, increasing investment risk in turbulent markets.
4. Regulatory & Legal
Abbott Laboratories
- Subject to stringent healthcare regulations across multiple segments, raising compliance costs and legal exposure.
Align Technology, Inc.
- Faces regulatory scrutiny mainly in medical devices and software, with risks linked to innovation and product approvals.
5. Supply Chain & Operations
Abbott Laboratories
- Large global footprint may pose supply chain complexity but benefits from scale and diversification.
Align Technology, Inc.
- Smaller scale and reliance on specialized components could amplify supply chain disruptions.
6. ESG & Climate Transition
Abbott Laboratories
- Larger firm likely has established ESG programs but faces pressure to reduce environmental footprint across diverse operations.
Align Technology, Inc.
- ESG efforts less documented; climate transition risks may affect manufacturing and product lifecycle sustainability.
7. Geopolitical Exposure
Abbott Laboratories
- Global presence exposes it to geopolitical risks but also provides geographic revenue diversification.
Align Technology, Inc.
- International sales expose company to trade tensions and regulatory shifts, but with less geographic spread than ABT.
Which company shows a better risk-adjusted profile?
Abbott’s key risk lies in its lower profitability and valuation concerns despite strong capital structure and low volatility. Align faces heightened stock volatility and weaker interest coverage but shows stronger profitability ratios and financial health scores. Given these factors, Align Technology presents a comparatively better risk-adjusted profile, supported by its strong Piotroski score and Altman Z-score in the safe zone. However, Align’s higher beta and regulatory risks require vigilance. Abbott’s lower ROE and unfavorable price-to-earnings metrics justify caution despite safer stock volatility.
Final Verdict: Which stock to choose?
Abbott Laboratories boasts a resilient cash-generating engine, driven by solid margins and a strong interest coverage ratio. Its declining ROIC trend signals a point of vigilance, requiring close monitoring of capital efficiency. This stock suits investors targeting steady income with moderate growth ambitions.
Align Technology, Inc. leverages a strategic moat in its innovative dental alignment solutions, supported by recurring revenue and robust free cash flow yield. Compared to Abbott, Align offers a leaner balance sheet and stronger financial health scores, appealing to investors favoring growth with a balanced risk profile.
If you prioritize resilient cash flow and income stability, Abbott outshines due to its robust margins and debt management. However, if you seek growth with better financial health and innovation-driven moats, Align offers superior strategic positioning despite steeper recent price volatility.
Disclaimer: Investment carries a risk of loss of initial capital. The past performance is not a reliable indicator of future results. Be sure to understand risks before making an investment decision.
Go Further
I encourage you to read the complete analyses of Abbott Laboratories and Align Technology, Inc. to enhance your investment decisions: