Home > Comparison > Industrials > XYL vs AOS
The strategic rivalry between Xylem Inc. and A. O. Smith Corporation shapes the industrial machinery sector’s future. Xylem operates as a diversified water technology leader, blending engineered solutions and smart infrastructure. A. O. Smith focuses on residential and commercial water heating and treatment, relying on brand strength and distribution reach. This analysis pits innovation against market penetration to identify which trajectory delivers superior risk-adjusted returns for a diversified portfolio.

Table of contents
Companies Overview
Xylem Inc. and A. O. Smith Corporation lead critical niches in industrial machinery, shaping water technology markets globally.
Xylem Inc.: Water Technology Innovator
Xylem Inc. commands the industrial machinery sector with a diversified portfolio focused on water and wastewater solutions. Its revenue stems from engineered products across Water Infrastructure, Applied Water, and Measurement & Control segments. In 2026, Xylem prioritizes smart water management and digital analytics for asset optimization, reinforcing its reputation for cutting-edge water technology.
A. O. Smith Corporation: Residential and Commercial Water Systems
A. O. Smith Corporation specializes in manufacturing water heaters and treatment products for residential and commercial use. Its core income comes from gas, electric, and heat pump water heaters alongside water filtration systems. In 2026, the company emphasizes expanding its global footprint, especially in China and India, while focusing on energy-efficient and sustainable water heating technologies.
Strategic Collision: Similarities & Divergences
Both companies operate in industrial machinery with a focus on water solutions but diverge in business philosophy. Xylem pursues a technology-driven ecosystem emphasizing smart infrastructure, while A. O. Smith focuses on product innovation and global market penetration. Their primary battleground is commercial water system efficiency. Investors face distinct profiles: Xylem offers digital innovation exposure, while A. O. Smith provides steady growth from core water heating markets.
Income Statement Comparison
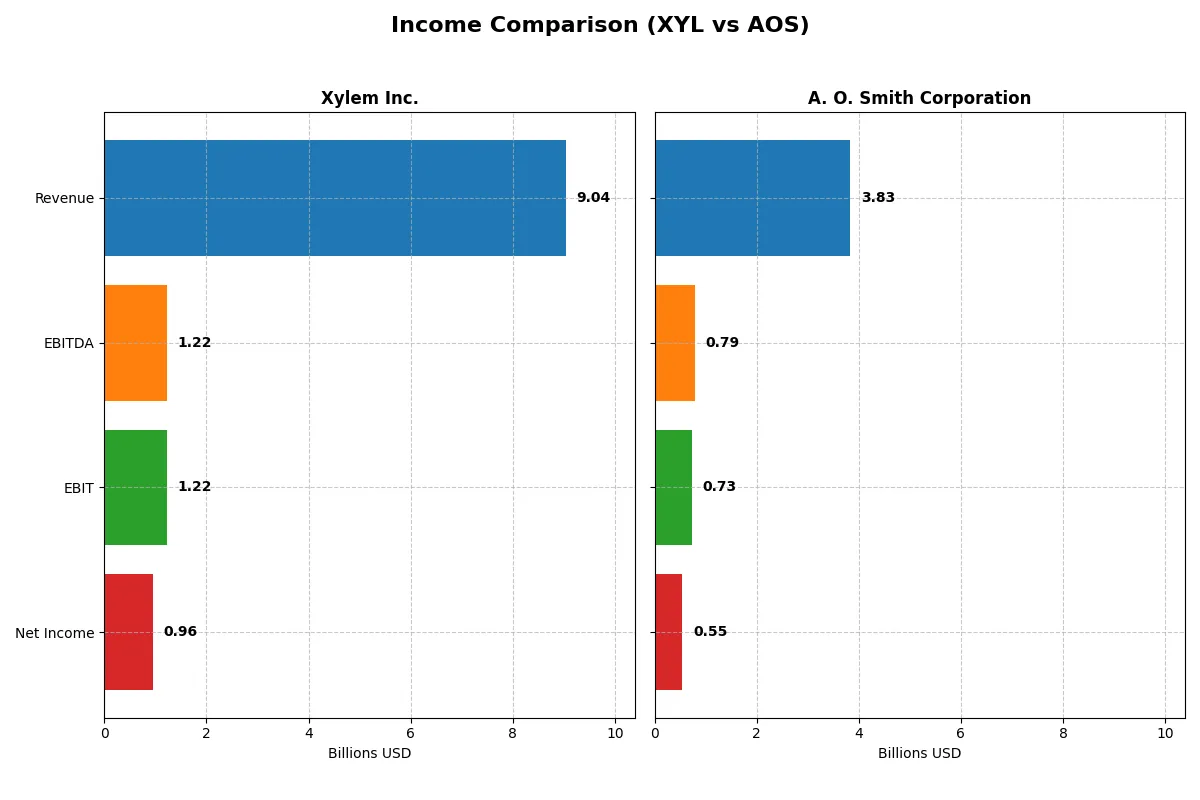
This data dissects the core profitability and scalability of both corporate engines to reveal who dominates the bottom line:
| Metric | Xylem Inc. (XYL) | A. O. Smith Corporation (AOS) |
|---|---|---|
| Revenue | 9.04B | 3.83B |
| Cost of Revenue | 5.56B | 2.34B |
| Operating Expenses | 2.25B | 759M |
| Gross Profit | 3.48B | 1.49B |
| EBITDA | 1.22B | 792M |
| EBIT | 1.22B | 729M |
| Interest Expense | 29M | 13.5M |
| Net Income | 957M | 546M |
| EPS | 3.93 | 3.86 |
| Fiscal Year | 2025 | 2025 |
Income Statement Analysis: The Bottom-Line Duel
The upcoming income statement comparison reveals which company drives superior efficiency and profitability from its revenue streams.
Xylem Inc. Analysis
Xylem’s revenue surged from $5.2B in 2021 to $9B in 2025, doubling net income from $427M to $957M. The company sustains healthy gross margins near 38.5% and net margins above 10%, reflecting disciplined cost control. In 2025, EBIT rose impressively to $1.2B, underlining strong operational momentum and efficient expense management.
A. O. Smith Corporation Analysis
A. O. Smith’s revenue grew modestly from $3.5B in 2021 to $3.8B in 2025, with net income climbing from $487M to $546M. Gross margin holds steady around 38.8%, while net margin improved to 14.3%, signaling a robust profit conversion. EBIT margin above 19% in 2025 highlights superior operational efficiency despite slower top-line growth.
Verdict: Growth Power vs. Margin Strength
Xylem dominates in revenue and net income growth, more than doubling profits over five years, supported by solid margin expansion. A. O. Smith boasts stronger net and EBIT margins but lags in revenue momentum. For investors prioritizing growth and scalable earnings, Xylem offers a compelling profile. Margin-focused investors may find A. O. Smith’s efficiency attractive despite its slower growth.
Financial Ratios Comparison
These vital ratios act as a diagnostic tool to expose the underlying fiscal health, valuation premiums, and capital efficiency of the companies compared below:
| Ratios | Xylem Inc. (XYL) | A. O. Smith Corporation (AOS) |
|---|---|---|
| ROE | 8.3% | 29.4% |
| ROIC | 6.4% | 23.9% |
| P/E | 34.6 | 17.1 |
| P/B | 2.9 | 5.0 |
| Current Ratio | 1.63 | 1.50 |
| Quick Ratio | 1.28 | 0.94 |
| D/E (Debt-to-Equity) | 0.17 | 0.10 |
| Debt-to-Assets | 11.0% | 6.1% |
| Interest Coverage | 42.2 | 53.9 |
| Asset Turnover | 0.51 | 1.22 |
| Fixed Asset Turnover | 7.80 | 5.62 |
| Payout ratio | 41% | 36% |
| Dividend yield | 1.18% | 2.09% |
| Fiscal Year | 2025 | 2025 |
Efficiency & Valuation Duel: The Vital Signs
Financial ratios act as the company’s DNA, exposing both hidden risks and operational strengths critical for investment insight.
Xylem Inc.
Xylem demonstrates moderate profitability with an 8.34% ROE and a favorable 10.59% net margin, but trades at a stretched P/E of 34.64. Its valuation appears expensive relative to peers. The company returns value via a modest 1.18% dividend yield while balancing reinvestment into R&D to support future growth.
A. O. Smith Corporation
A. O. Smith excels with robust profitability, showing a 29.4% ROE and a strong 14.26% net margin. Its P/E of 17.13 suggests a reasonable valuation, though the price-to-book ratio at 5.04 is a caution signal. The firm offers a healthy 2.09% dividend yield, reflecting disciplined capital allocation and shareholder returns.
Premium Valuation vs. Operational Safety
A. O. Smith provides a superior balance of high returns and reasonable valuation despite a stretched P/B ratio. Xylem’s higher P/E and lower ROE suggest more risk for less reward. Investors prioritizing stable profitability and dividends may find A. O. Smith’s profile more fitting.
Which one offers the Superior Shareholder Reward?
Xylem Inc. (XYL) and A. O. Smith Corporation (AOS) both return capital via dividends and buybacks but differ in yield and payout intensity. XYL yields ~1.2% with a ~40% payout ratio, balancing dividends and buybacks sustainably. AOS offers a higher 2.1% yield and a lower ~36% payout ratio, with more aggressive buybacks supporting total return. Historically, AOS’s stronger free cash flow coverage (88%) and lower debt levels underpin more robust distributions. I see AOS’s distribution model as more sustainable and superior for total shareholder reward in 2026.
Comparative Score Analysis: The Strategic Profile
The radar chart reveals the fundamental DNA and trade-offs of Xylem Inc. and A. O. Smith Corporation’s financial profiles:
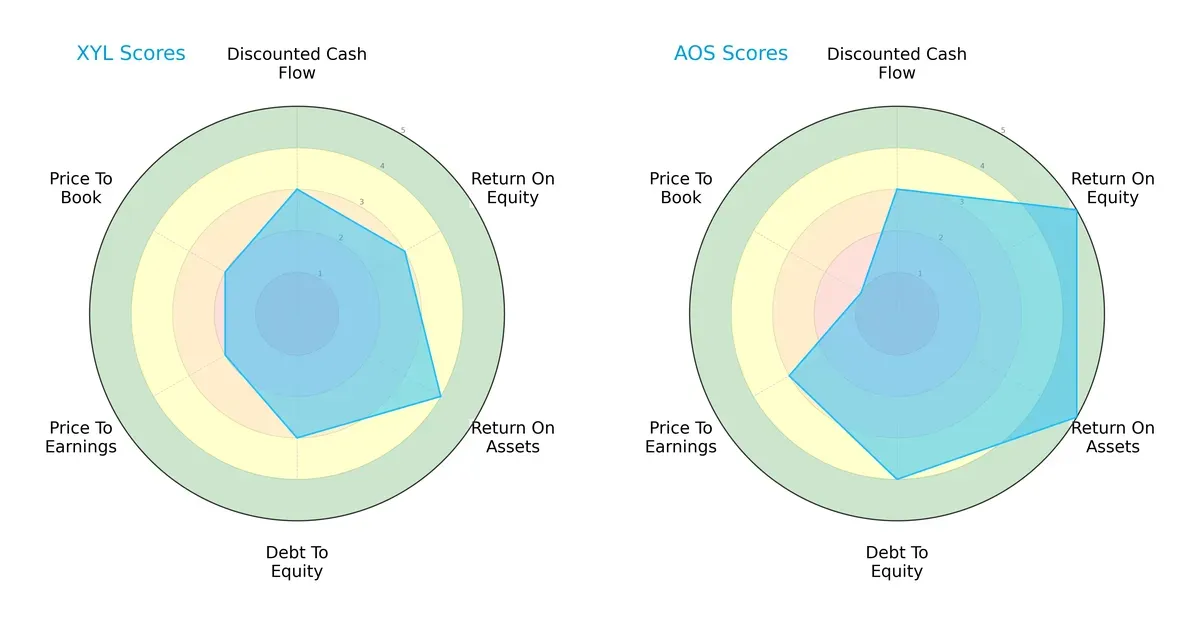
A. O. Smith leads with a more balanced profile, excelling in ROE (5) and ROA (5) compared to Xylem’s moderate ROE (3) and favorable ROA (4). Both show moderate DCF scores (3), but A. O. Smith sustains a stronger debt-to-equity position (4 vs. 3). Xylem lags in valuation metrics, scoring 2 in both P/E and P/B, while A. O. Smith’s P/E is moderate (3) but suffers from a very unfavorable P/B score (1). Overall, A. O. Smith demonstrates robust profitability and financial stability, while Xylem relies more on asset efficiency but is less attractively valued.
Bankruptcy Risk: Solvency Showdown
The Altman Z-Score difference strongly favors A. O. Smith’s superior solvency, indicating a safer buffer against bankruptcy risk in this cycle:
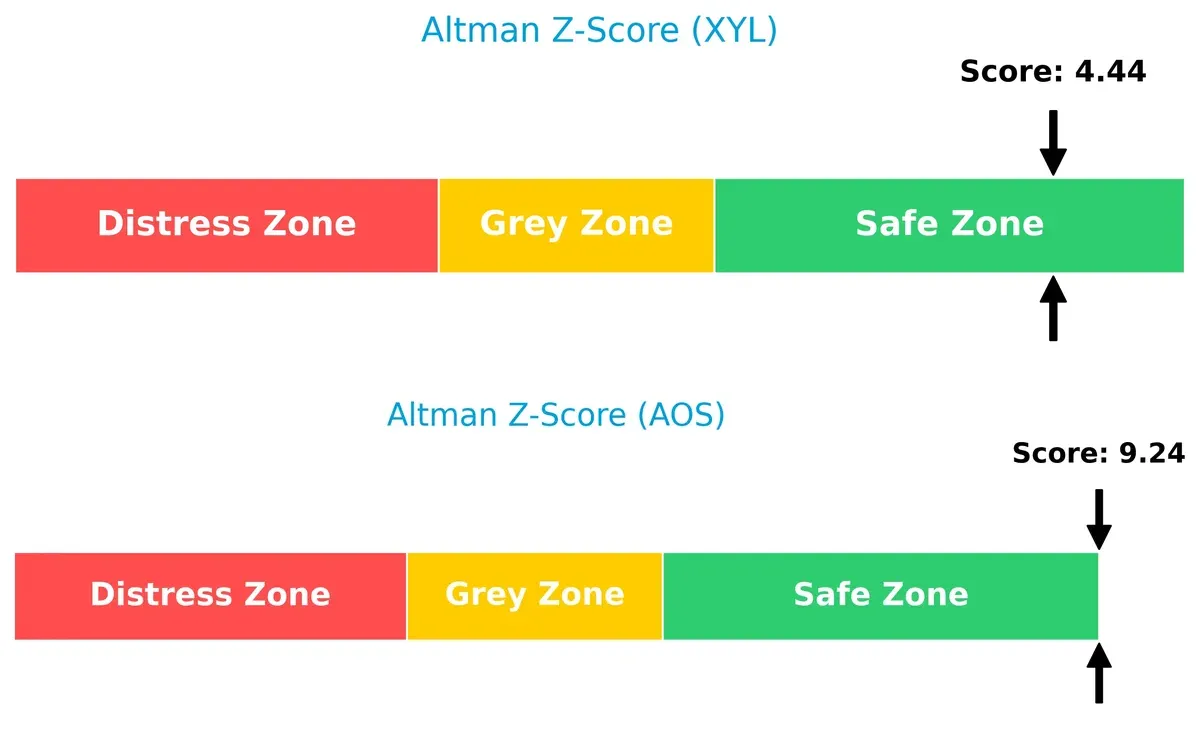
A. O. Smith’s score of 9.24 far exceeds Xylem’s 4.44, placing both firms safely above distress thresholds. However, A. O. Smith’s elevated Z-Score signals exceptionally strong financial health and resilience, while Xylem, though safe, shows more moderate security margins.
Financial Health: Quality of Operations
Both companies share a strong Piotroski F-Score of 7, reflecting solid internal financial metrics and operational quality:
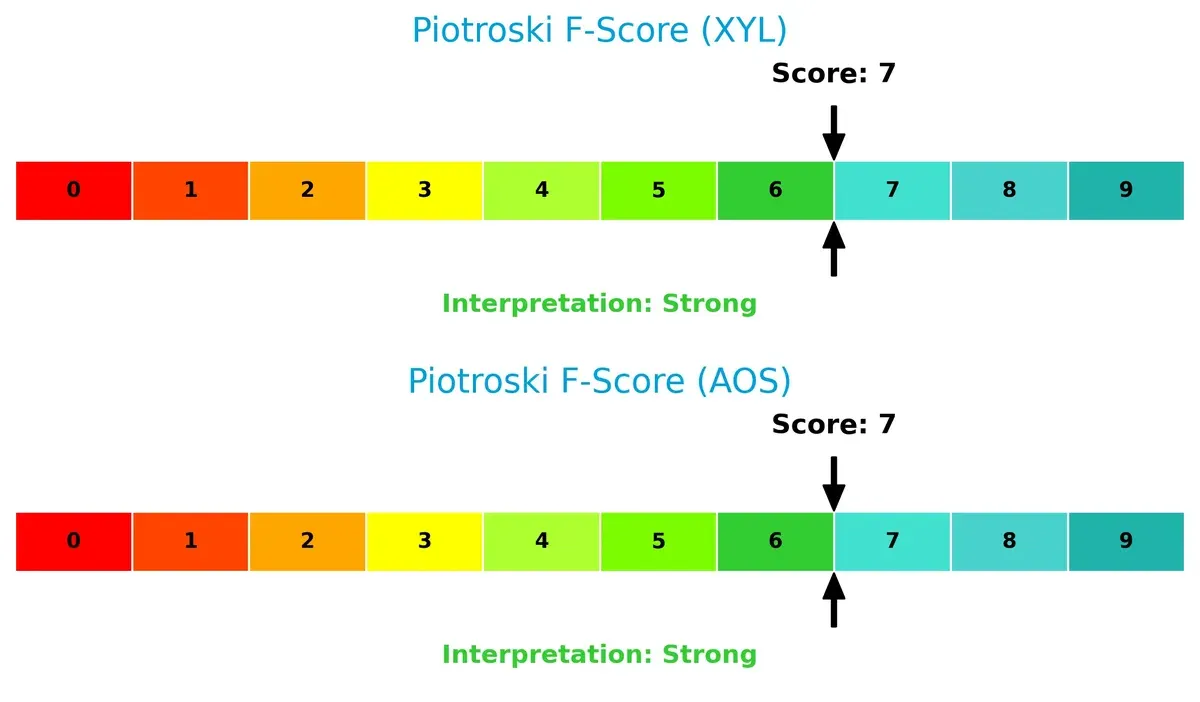
Their scores suggest vigorous profitability, liquidity, and efficiency. Neither firm displays red flags, but the parity indicates that operational quality alone may not differentiate them. Investors should weigh this alongside solvency and valuation metrics for a full picture.
How are the two companies positioned?
This section dissects the operational DNA of Xylem and A. O. Smith by comparing their revenue distribution and internal strengths and weaknesses. The goal is to confront their economic moats and identify which model offers the most resilient, sustainable competitive advantage today.
Revenue Segmentation: The Strategic Mix
This visual comparison dissects how Xylem Inc. and A. O. Smith Corporation diversify their income streams and where their primary sector bets lie:
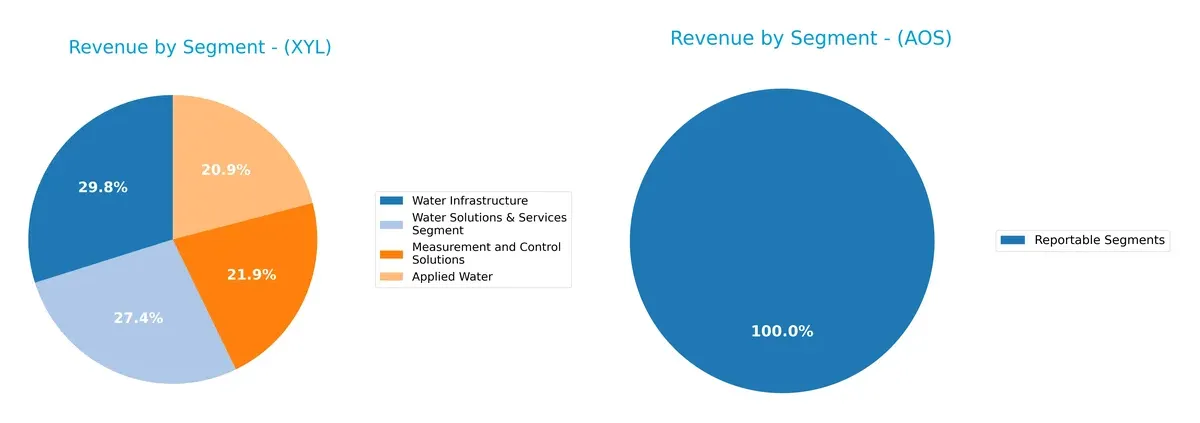
Xylem shows a well-diversified revenue base with Applied Water ($1.79B), Measurement & Control Solutions ($1.87B), Water Infrastructure ($2.56B), and Water Solutions & Services ($2.34B) in 2024. In contrast, A. O. Smith reports a single segment at $3.83B, indicating concentration risk. Xylem’s multi-segment approach reduces dependency on one market, anchoring its ecosystem lock-in strategy. A. O. Smith pivots solely on its core segment, exposing it to sector-specific headwinds.
Strengths and Weaknesses Comparison
This table compares the Strengths and Weaknesses of Xylem Inc. and A. O. Smith Corporation:
Xylem Inc. Strengths
- Diversified water infrastructure and control segments
- Favorable net margin at 10.59%
- Strong liquidity ratios with current ratio 1.62 and quick ratio 1.28
- Low leverage with debt-to-assets at 11.01%
- Global presence with significant revenue from US, Europe, Asia Pacific
- Favorable interest coverage at 42.17
A. O. Smith Corporation Strengths
- Higher net margin at 14.26% and strong ROE at 29.4%
- Robust ROIC at 23.94%, exceeding WACC
- Favorable asset turnover and fixed asset turnover
- Low debt-to-assets at 6.11% with strong interest coverage 54.03
- Solid global presence in North America and Rest of World segments
- Higher dividend yield at 2.09%
Xylem Inc. Weaknesses
- ROE below WACC indicating potential capital inefficiency
- PE ratio high at 34.64, possibly overvalued
- Neutral ROIC vs. WACC balance
- Moderate asset turnover at 0.51
- Some revenue segments show volatility
A. O. Smith Corporation Weaknesses
- Higher PB ratio at 5.04 may signal valuation premium
- Neutral liquidity ratios with quick ratio below 1
- Less diversified product segmentation with one major segment
- Slightly higher WACC at 9.88%
Xylem’s strengths lie in its diversified segments and solid liquidity profile, but it faces challenges in capital efficiency. A. O. Smith shows superior profitability and capital returns yet carries valuation and liquidity considerations. Both companies’ profiles suggest distinct strategic priorities around growth and capital allocation.
The Moat Duel: Analyzing Competitive Defensibility
A structural moat is the only reliable shield protecting long-term profits from relentless competitive pressures:
Xylem Inc.: Intangible Assets Driving Water Innovation
Xylem leverages proprietary technology and brand strength, reflected in stable margins but suffers declining ROIC, signaling eroding capital efficiency in 2026.
A. O. Smith Corporation: Efficient Capital Allocation with Robust Cost Advantage
A. O. Smith contrasts with Xylem by delivering superior ROIC well above WACC, demonstrating effective capital use and margin expansion with steady growth potential.
Capital Efficiency vs. Innovation Edge: Who Defends Their Turf Better?
A. O. Smith holds a wider moat, evidenced by growing ROIC and value creation. Xylem’s declining returns reveal vulnerability. A. O. Smith is better positioned to defend market share.
Which stock offers better returns?
The past year shows contrasting price dynamics for Xylem Inc. and A. O. Smith Corporation, with both stocks experiencing notable shifts and divergent recent trends.
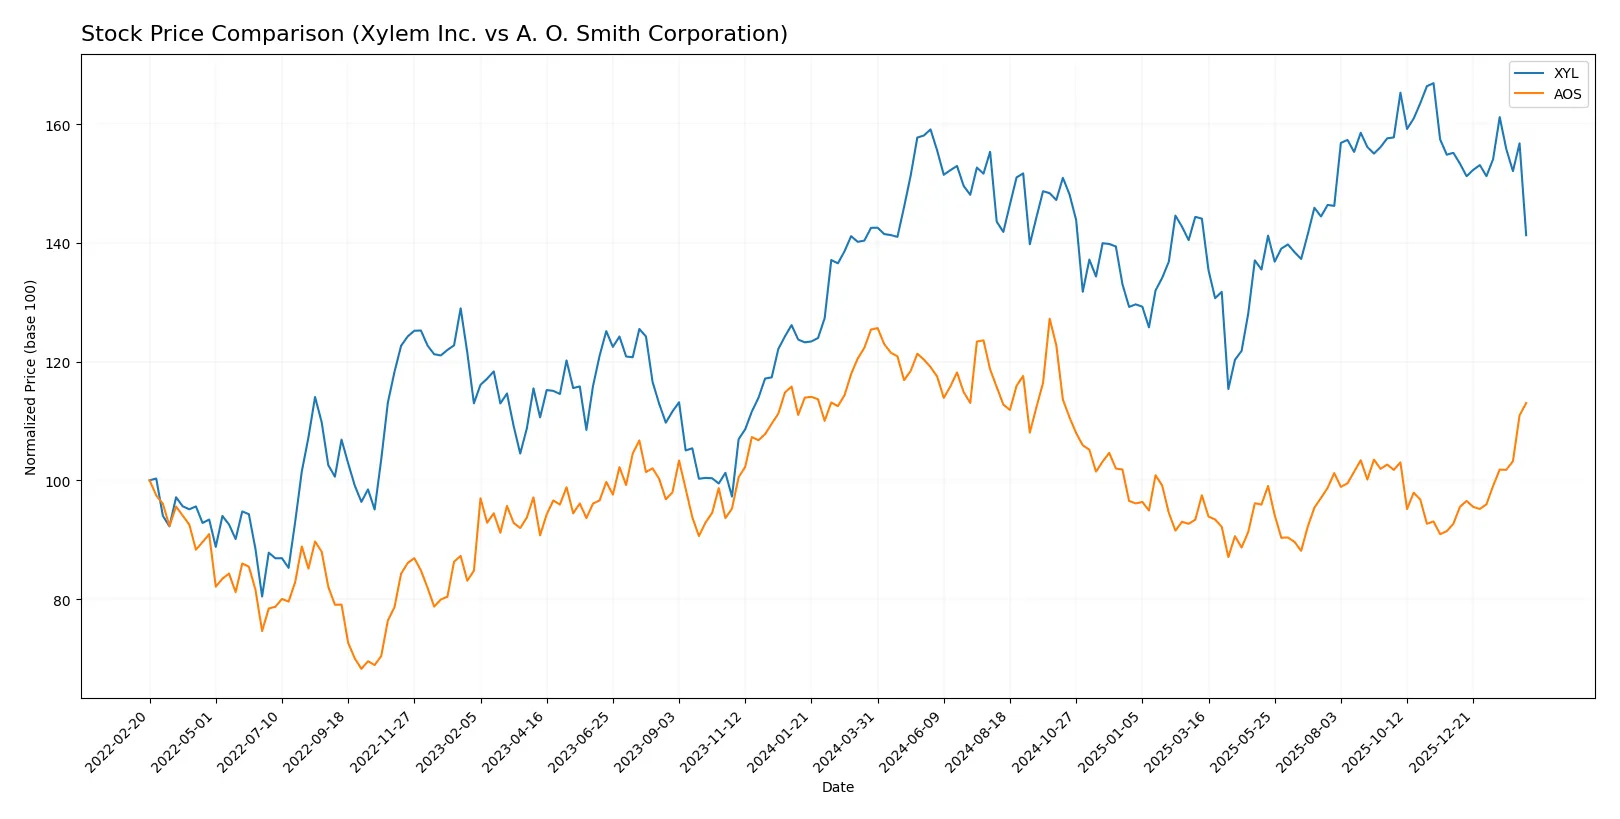
Trend Comparison
Xylem Inc. recorded a -0.87% price change over 12 months, marking a bearish trend with decelerating momentum. The stock fluctuated between 104.6 and 151.31, showing moderate volatility (9.59 std dev).
A. O. Smith Corporation fell 9.88% over the same period, reflecting a bearish trend with accelerating decline. It ranged from 61.99 to 90.59, with lower volatility (7.71 std dev) compared to Xylem.
Recently, A. O. Smith outperformed Xylem, gaining 21.95% versus Xylem’s -8.94%, delivering the highest market performance in the latest quarter.
Target Prices
Analysts project solid upside potential for both Xylem Inc. and A. O. Smith Corporation based on current consensus targets.
| Company | Target Low | Target High | Consensus |
|---|---|---|---|
| Xylem Inc. | 138 | 176 | 162.67 |
| A. O. Smith Corporation | 69 | 85 | 76.2 |
Xylem’s consensus target exceeds its current price of 128.09 by nearly 27%, signaling strong market confidence. A. O. Smith’s target consensus stands slightly below its current price of 80.46, suggesting limited near-term upside.

Don’t Let Luck Decide Your Entry Point
Optimize your entry points with our advanced ProRealTime indicators. You’ll get efficient buy signals with precise price targets for maximum performance. Start outperforming now!
How do institutions grade them?
Here is a summary of the recent institutional grades for Xylem Inc. and A. O. Smith Corporation:
Xylem Inc. Grades
The following table presents recent grades issued by reputable financial institutions for Xylem Inc.:
| Grading Company | Action | New Grade | Date |
|---|---|---|---|
| Citigroup | Maintain | Buy | 2026-02-11 |
| Stifel | Maintain | Buy | 2026-02-11 |
| RBC Capital | Maintain | Outperform | 2026-02-11 |
| Barclays | Maintain | Overweight | 2026-02-11 |
| Barclays | Maintain | Overweight | 2026-01-07 |
| Mizuho | Maintain | Neutral | 2026-01-05 |
| TD Cowen | Maintain | Hold | 2025-12-05 |
| UBS | Maintain | Buy | 2025-11-06 |
| Stifel | Maintain | Buy | 2025-10-29 |
| RBC Capital | Maintain | Outperform | 2025-10-29 |
A. O. Smith Corporation Grades
Below are the recent grades from credible institutions for A. O. Smith Corporation:
| Grading Company | Action | New Grade | Date |
|---|---|---|---|
| DA Davidson | Maintain | Neutral | 2026-02-02 |
| Stifel | Maintain | Buy | 2026-01-30 |
| Citigroup | Maintain | Neutral | 2026-01-30 |
| DA Davidson | Maintain | Neutral | 2025-11-13 |
| Citigroup | Maintain | Neutral | 2025-10-29 |
| Stifel | Maintain | Buy | 2025-10-29 |
| UBS | Maintain | Neutral | 2025-07-28 |
| Oppenheimer | Maintain | Outperform | 2025-07-28 |
| Stifel | Maintain | Buy | 2025-07-25 |
| Baird | Maintain | Neutral | 2025-07-25 |
Which company has the best grades?
Xylem Inc. consistently receives stronger grades, including multiple “Buy,” “Outperform,” and “Overweight” ratings. A. O. Smith leans more towards “Neutral” with some “Buy” and a single “Outperform.” This suggests Xylem commands higher institutional confidence, potentially impacting investor sentiment and valuation.
Risks specific to each company
The following categories identify critical pressure points and systemic threats facing Xylem Inc. and A. O. Smith Corporation in the 2026 market environment:
1. Market & Competition
Xylem Inc.
- Operates in global water infrastructure with strong brand portfolio but faces intense industrial machinery competition.
A. O. Smith Corporation
- Focuses on residential and commercial water heating, competing in diverse geographic markets with established brands.
2. Capital Structure & Debt
Xylem Inc.
- Low debt-to-equity ratio (0.17), favorable interest coverage (42.17), indicating solid financial stability.
A. O. Smith Corporation
- Even lower debt-to-equity (0.10) and higher interest coverage (54.03), demonstrating very strong balance sheet resilience.
3. Stock Volatility
Xylem Inc.
- Beta of 1.16 signals moderate market volatility, slightly above average for industrials.
A. O. Smith Corporation
- Higher beta at 1.34 suggests greater sensitivity to market swings, increasing equity risk.
4. Regulatory & Legal
Xylem Inc.
- Operates in heavily regulated water treatment sectors with compliance costs and evolving environmental rules.
A. O. Smith Corporation
- Faces regulatory scrutiny mainly in product safety and environmental standards across multiple regions.
5. Supply Chain & Operations
Xylem Inc.
- Global manufacturing and distribution expose it to supply chain disruptions but diversified supplier base mitigates risks.
A. O. Smith Corporation
- Relies on complex global supply chains, especially in Asia and North America, vulnerable to geopolitical tensions.
6. ESG & Climate Transition
Xylem Inc.
- Heavy focus on water sustainability solutions aligns well with climate transition trends and ESG investor demand.
A. O. Smith Corporation
- Increasing investments in energy-efficient water heaters bolster ESG credentials but must manage resource use impacts.
7. Geopolitical Exposure
Xylem Inc.
- Significant exposure to international markets including Asia-Pacific, adding currency and political risk.
A. O. Smith Corporation
- Also globally diversified but with stronger North America reliance, slightly reducing geopolitical risk compared to Xylem.
Which company shows a better risk-adjusted profile?
Xylem’s largest risk lies in geopolitical exposure and regulatory compliance costs in a complex global water market. A. O. Smith’s key risk is higher stock volatility and supply chain vulnerability, especially in Asia. Overall, A. O. Smith exhibits a stronger risk-adjusted profile supported by superior profitability metrics, lower leverage, and a robust Altman Z-score of 9.24 versus Xylem’s 4.44. The divergence in P/E ratios (17.13 vs. 34.64) reflects market recognition of A. O. Smith’s more balanced risk and return outlook.
Final Verdict: Which stock to choose?
Xylem Inc. (XYL) impresses with its operational resilience and steady cash generation, showcasing a solid business model in a cyclical sector. Its point of vigilance lies in a declining return on invested capital, which suggests caution on long-term value creation. XYL suits portfolios seeking exposure to industrial efficiency with moderate growth ambitions.
A. O. Smith Corporation (AOS) stands out for its strong economic moat, evidenced by a return on invested capital well above its cost of capital and a robust upward trend. It demonstrates superior profitability and financial stability relative to XYL. AOS fits well in Growth at a Reasonable Price (GARP) portfolios aiming for sustainable competitive advantage and income potential.
If you prioritize stable value creation and competitive moats, A. O. Smith offers a compelling choice due to its proven ability to generate excess returns and increasing profitability. However, if you seek exposure to operational efficiency with moderate risk and cyclical upside, Xylem might appeal despite its current challenges in capital efficiency.
Disclaimer: Investment carries a risk of loss of initial capital. The past performance is not a reliable indicator of future results. Be sure to understand risks before making an investment decision.
Go Further
I encourage you to read the complete analyses of Xylem Inc. and A. O. Smith Corporation to enhance your investment decisions: