Home > Comparison > Industrials > SYM vs AOS
The strategic rivalry between Symbotic Inc. and A. O. Smith Corporation shapes the industrial machinery sector’s future. Symbotic excels as a cutting-edge automation technology innovator, while A. O. Smith operates as a diversified manufacturer of water heating and treatment systems. This analysis pits Symbotic’s high-growth tech-driven model against A. O. Smith’s steady, dividend-paying industrial play. I will assess which trajectory offers superior risk-adjusted returns for a balanced portfolio.
Table of contents
Companies Overview
Symbotic Inc. and A. O. Smith Corporation both play pivotal roles in the industrial machinery sector in the United States.
Symbotic Inc.: Automation Innovator in Warehouse Efficiency
Symbotic Inc. leads in automation technology by providing robotics solutions that enhance retail and wholesale warehouse operations. Its core revenue stems from The Symbotic System, a comprehensive warehouse automation platform designed to reduce costs and maximize inventory efficiency. In 2026, the company focuses on expanding adoption of its technology to drive operational excellence for large-scale supply chains.
A. O. Smith Corporation: Water Heating and Treatment Specialist
A. O. Smith Corporation specializes in manufacturing residential and commercial water heaters and treatment products worldwide. It generates revenue through diverse product lines including boilers, water softeners, and filtration systems. The company’s 2026 strategy emphasizes global market expansion and innovation across North America, China, Europe, and India to capture broader customer segments.
Strategic Collision: Similarities & Divergences
Both companies operate in industrial machinery but pursue contrasting philosophies: Symbotic champions cutting-edge automation while A. O. Smith focuses on proven water heating and treatment solutions. Their primary battleground lies in operational technology versus traditional manufacturing. Investors face distinct profiles—Symbotic offers high growth potential amid technological disruption, whereas A. O. Smith delivers steady exposure to essential building infrastructure.
Income Statement Comparison
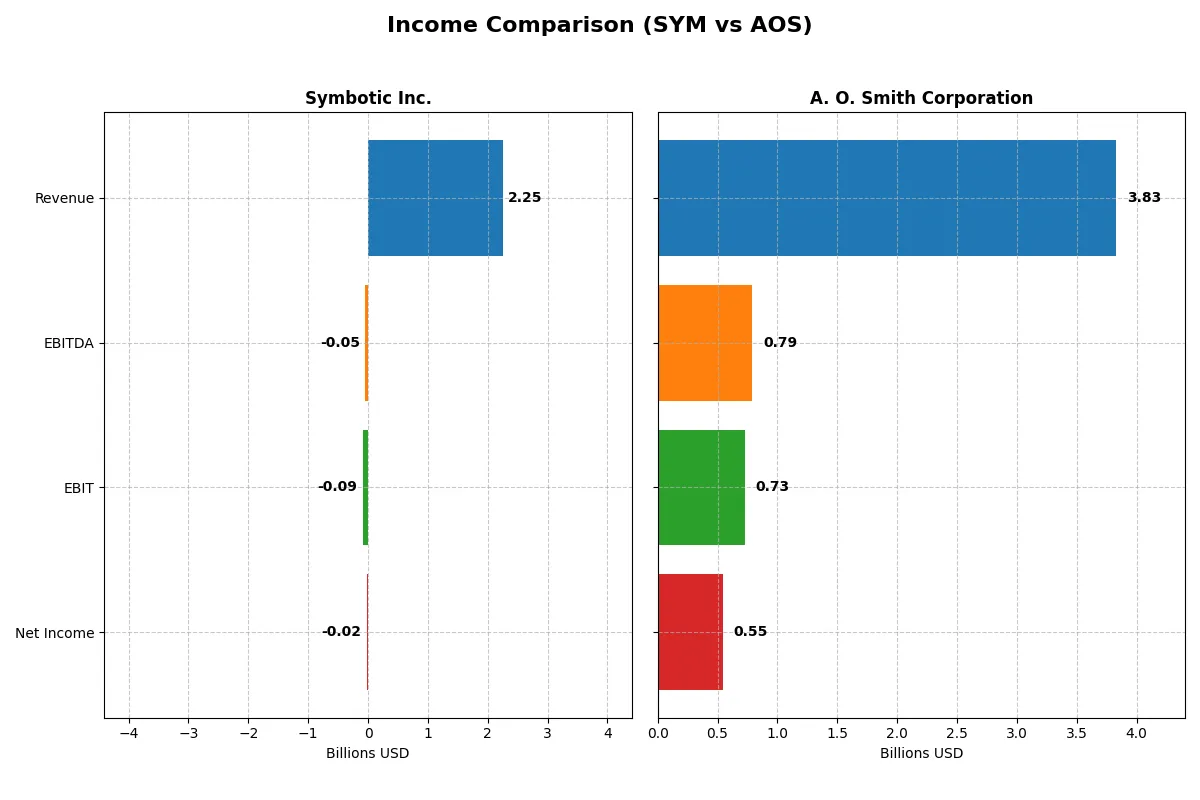
The following data dissects the core profitability and scalability of both corporate engines to reveal who dominates the bottom line:
| Metric | Symbotic Inc. (SYM) | A. O. Smith Corporation (AOS) |
|---|---|---|
| Revenue | 2.25B | 3.83B |
| Cost of Revenue | 1.82B | 2.34B |
| Operating Expenses | 538M | 759M |
| Gross Profit | 423M | 1.49B |
| EBITDA | -48M | 792M |
| EBIT | -92M | 729M |
| Interest Expense | 0 | 13.5M |
| Net Income | -17M | 546M |
| EPS | -0.16 | 3.86 |
| Fiscal Year | 2025 | 2025 |
Income Statement Analysis: The Bottom-Line Duel
This income statement comparison reveals which company runs a more efficient and profitable corporate engine through their revenue and net income trends.
Symbotic Inc. Analysis
Symbotic’s revenue surged from 251M in 2021 to 2.25B in 2025, showing strong growth momentum. Despite this, it struggles with negative EBIT and net margins, reflecting ongoing operational inefficiencies. The 2025 gross margin holds at a moderate 18.8%, but losses persist with a net income of -17M, signaling continuing challenges in scaling profits.
A. O. Smith Corporation Analysis
A. O. Smith maintains a stable revenue base near 3.8B from 2021 to 2025, with minimal growth recently. It boasts robust gross and net margins of 38.8% and 14.3% respectively in 2025, reflecting excellent cost control and profitability. The firm delivered a strong net income of 546M in 2025, demonstrating consistent earnings power and operational efficiency.
Margin Strength vs. Growth Ambition
A. O. Smith outperforms Symbotic in profitability, delivering superior margins and a solid bottom line. Symbotic impresses with rapid revenue growth but remains unprofitable, highlighting operational risks. Investors favor A. O. Smith’s reliable earnings profile, while Symbotic’s profile suits those prioritizing growth potential over current profitability.
Financial Ratios Comparison
These vital ratios act as a diagnostic tool to expose the underlying fiscal health, valuation premiums, and capital efficiency of each company:
| Ratios | Symbotic Inc. (SYM) | A. O. Smith Corporation (AOS) |
|---|---|---|
| ROE | -7.65% | 25.64% |
| ROIC | -16.63% | 23.94% |
| P/E | -335x | 17.13x |
| P/B | 25.60x | 4.39x |
| Current Ratio | 1.08 | 1.50 |
| Quick Ratio | 0.99 | 0.94 |
| D/E | 0.14 | 0.09 |
| Debt-to-Assets | 1.32% | 6.11% |
| Interest Coverage | 0 | 53.93 |
| Asset Turnover | 0.94 | 1.22 |
| Fixed Asset Turnover | 15.92 | 5.62 |
| Payout ratio | 0% | 35.83% |
| Dividend yield | 0% | 2.09% |
| Fiscal Year | 2025 | 2025 |
Efficiency & Valuation Duel: The Vital Signs
Ratios act as a company’s DNA, revealing hidden risks and operational excellence that shape investment decisions and future performance.
Symbotic Inc.
Symbotic displays unfavorable profitability with a negative ROE of -7.65% and net margin at -0.75%, signaling operational struggles. Its valuation appears stretched with a negative P/E but a high PB ratio of 25.6. The company pays no dividends, instead reinvesting heavily in R&D (about 9.6% of revenue), aiming to fuel future growth.
A. O. Smith Corporation
A. O. Smith shows robust profitability with a 25.64% ROE and a 14.26% net margin, reflecting operational efficiency. Its valuation remains moderate with a P/E of 17.13, suggesting reasonable market expectations. The company supports shareholders with a 2.09% dividend yield, balancing returns with steady capital discipline.
Clear Operational Strength vs. Growth Uncertainty
A. O. Smith offers a superior balance of profitability and valuation metrics, with favorable returns and tangible shareholder payouts. Symbotic’s profile fits investors focused on innovation and long-term growth despite current losses. Risk-averse investors may prefer A. O. Smith’s stable, profitable model.
Which one offers the Superior Shareholder Reward?
I compare Symbotic Inc. (SYM) and A. O. Smith Corporation (AOS) based on their shareholder reward strategies. SYM pays no dividends, focusing entirely on reinvestment to fuel growth, showing negative profit margins but strong free cash flow per share (7.25). It lacks buybacks, which limits immediate shareholder returns. In contrast, AOS delivers a steady 2% dividend yield with a sustainable payout ratio around 35%, supported by robust net margins (~14%) and solid free cash flow (≈3.9 per share). AOS also actively repurchases shares, enhancing total shareholder return. Given SYM’s negative earnings and zero distributions, AOS’s balanced dividend and buyback strategy offers a more attractive and sustainable total return for 2026 investors.
Comparative Score Analysis: The Strategic Profile
The radar chart reveals the fundamental DNA and trade-offs of both firms, spotlighting their core financial strengths and weaknesses:
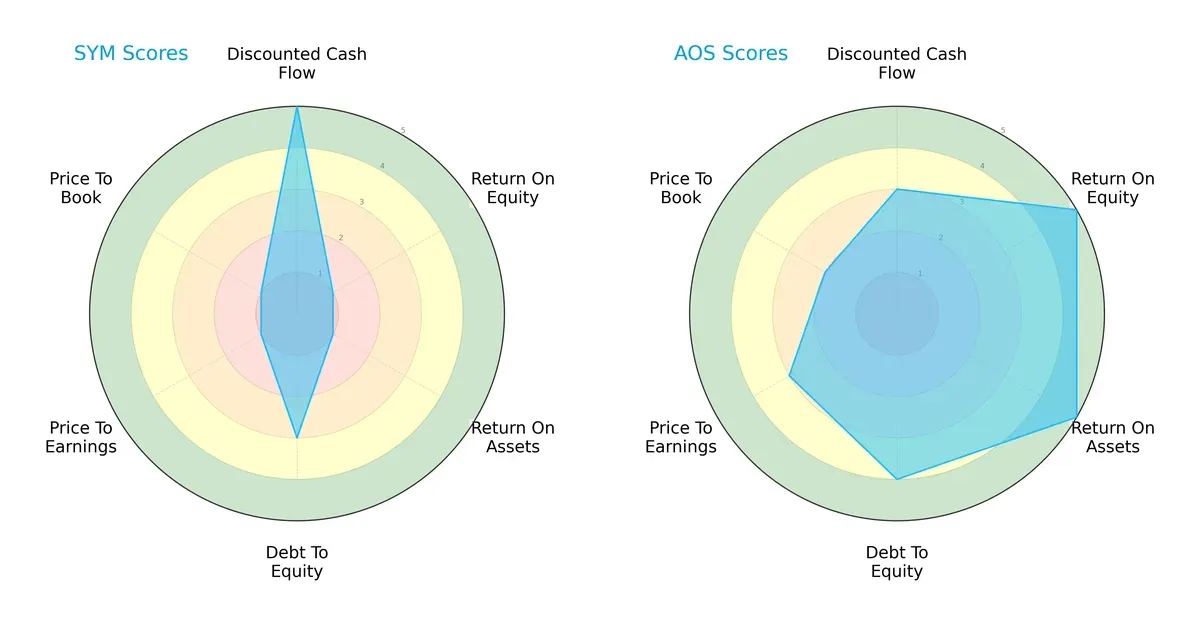
Symbotic Inc. excels in discounted cash flow with a top score of 5, signaling strong future cash flow prospects. However, it falters on profitability metrics, scoring just 1 in both ROE and ROA, indicating poor efficiency in generating returns. Its debt-to-equity and valuation scores are moderate to weak. In contrast, A. O. Smith Corporation boasts high scores in ROE (5), ROA (5), and better debt management (4), reflecting a balanced, efficient operator. Its valuation metrics are more moderate but still stronger than Symbotic’s. Overall, A. O. Smith presents a more balanced financial profile, while Symbotic depends heavily on its discounted cash flow advantage.
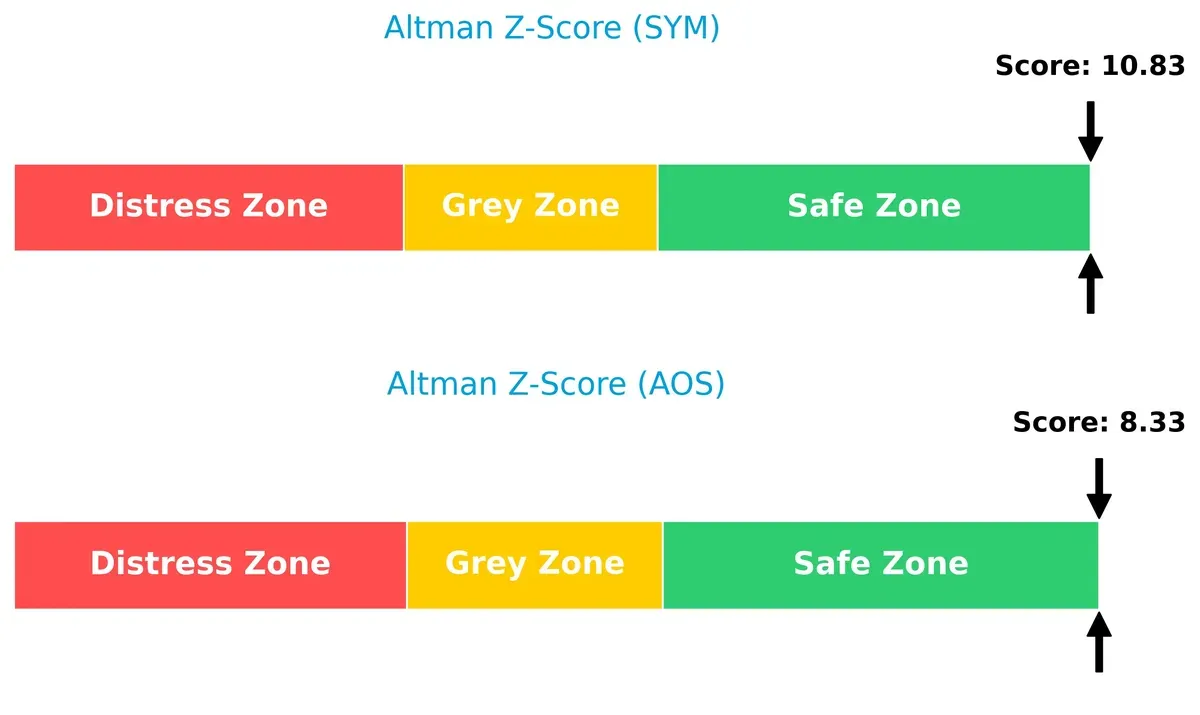
Bankruptcy Risk: Solvency Showdown
The Altman Z-Score differential shows both firms safely above distress thresholds, but Symbotic’s 10.8 score far surpasses A. O. Smith’s 8.3, indicating superior solvency and lower bankruptcy risk in this economic cycle:
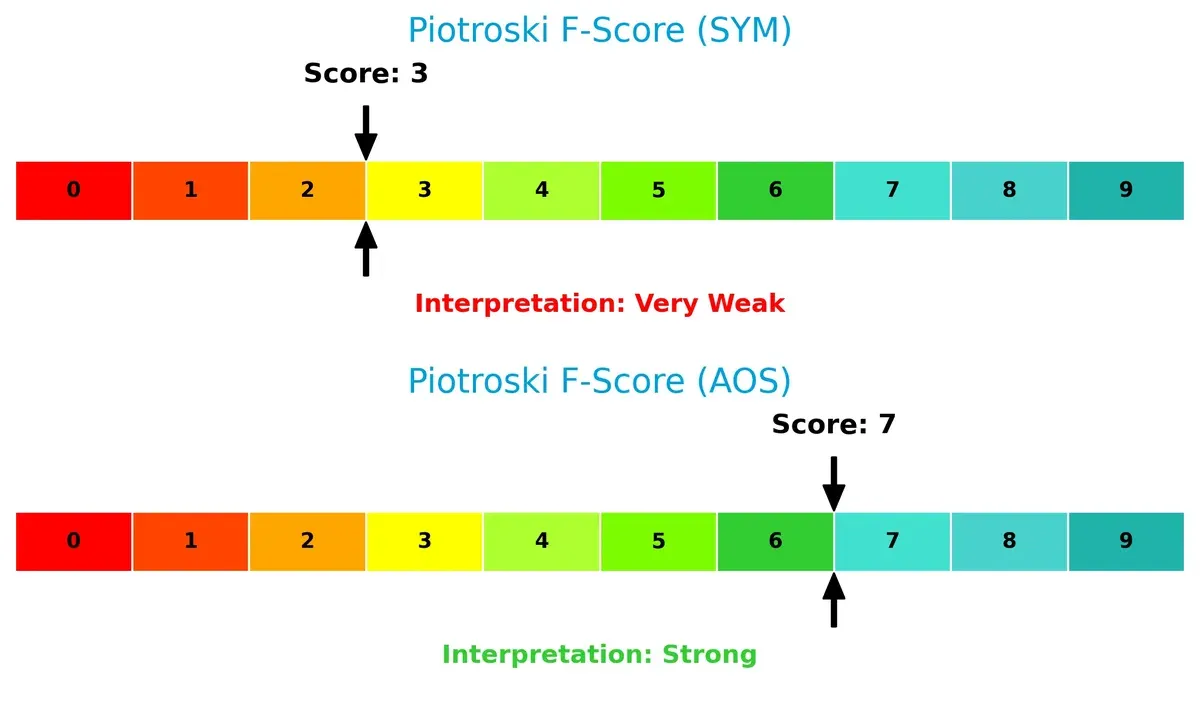
Financial Health: Quality of Operations
A. O. Smith’s Piotroski F-Score of 7 signals strong financial health and effective operational quality, while Symbotic’s score of 3 reveals potential red flags and weaker internal fundamentals:
How are the two companies positioned?
This section dissects the operational DNA of Symbotic and A. O. Smith by comparing their revenue distribution and internal dynamics. Our goal is to confront their economic moats to identify which business model delivers the most resilient, sustainable competitive advantage in today’s market.
Revenue Segmentation: The Strategic Mix
This visual comparison dissects how Symbotic Inc. and A. O. Smith Corporation diversify their income streams and reveals their primary sector bets:
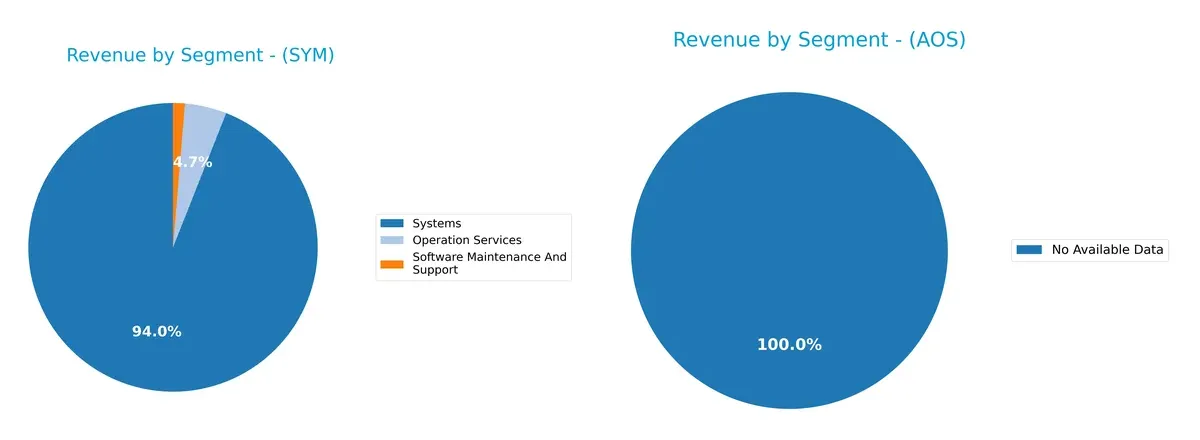
Symbotic Inc. anchors its revenue in Systems, generating $2.12B in 2025, dwarfing its Operation Services ($105M) and Software Maintenance ($30M). This concentration signals deep infrastructure dominance but elevates concentration risk. In contrast, A. O. Smith Corporation lacks available data, preventing segmentation analysis. Symbotic’s focused mix suggests a strategic bet on scalable automation ecosystems rather than broad diversification.
Strengths and Weaknesses Comparison
This table compares the strengths and weaknesses of Symbotic Inc. and A. O. Smith Corporation:
Symbotic Inc. Strengths
- Growing Systems revenue reaching 2.12B in 2025
- Favorable debt-to-equity and debt-to-assets ratios
- High fixed asset turnover indicating efficient asset use
A. O. Smith Corporation Strengths
- Strong profitability with 14.26% net margin and 25.64% ROE
- Favorable interest coverage of 54.03 supports debt servicing
- Diversified global sales with large North America and Rest of World presence
Symbotic Inc. Weaknesses
- Negative profitability metrics: -0.75% net margin and -7.65% ROE
- High price-to-book ratio at 25.6 signals potential overvaluation
- Interest coverage at zero and no dividend yield
A. O. Smith Corporation Weaknesses
- Weighted average cost of capital (WACC) at 10.08% exceeds some profitability metrics
- Price-to-book ratio 4.39 is unfavorable despite solid earnings
Symbotic shows strong asset efficiency and growth in systems revenue but struggles with profitability and valuation concerns. A. O. Smith delivers robust profitability and global diversification but faces valuation pressure and slightly elevated capital costs. These factors will shape their strategic priorities moving forward.
The Moat Duel: Analyzing Competitive Defensibility
A structural moat alone protects long-term profits from relentless competitive pressure. Let’s examine the moat dynamics of Symbotic Inc. and A. O. Smith Corporation:
Symbotic Inc.: Innovation-Driven Switching Costs
Symbotic’s moat stems from proprietary robotics and warehouse automation technology, creating high switching costs. Despite rapid revenue growth, negative ROIC signals value destruction in 2025. Future product launches could deepen the moat if profitability improves.
A. O. Smith Corporation: Durable Brand and Cost Advantage
A. O. Smith’s moat is built on strong brand recognition and cost-efficient manufacturing in water heating and treatment. It delivers a robust 19% EBIT margin with a growing ROIC, signaling sustainable value creation and steady market expansion.
Innovation vs. Brand Power: The Moat Showdown
A. O. Smith’s deeper moat combines consistent profitability and expanding ROIC, contrasting with Symbotic’s negative returns despite innovation. I see A. O. Smith better positioned to defend and grow its market share amid industrial sector competition.
Which stock offers better returns?
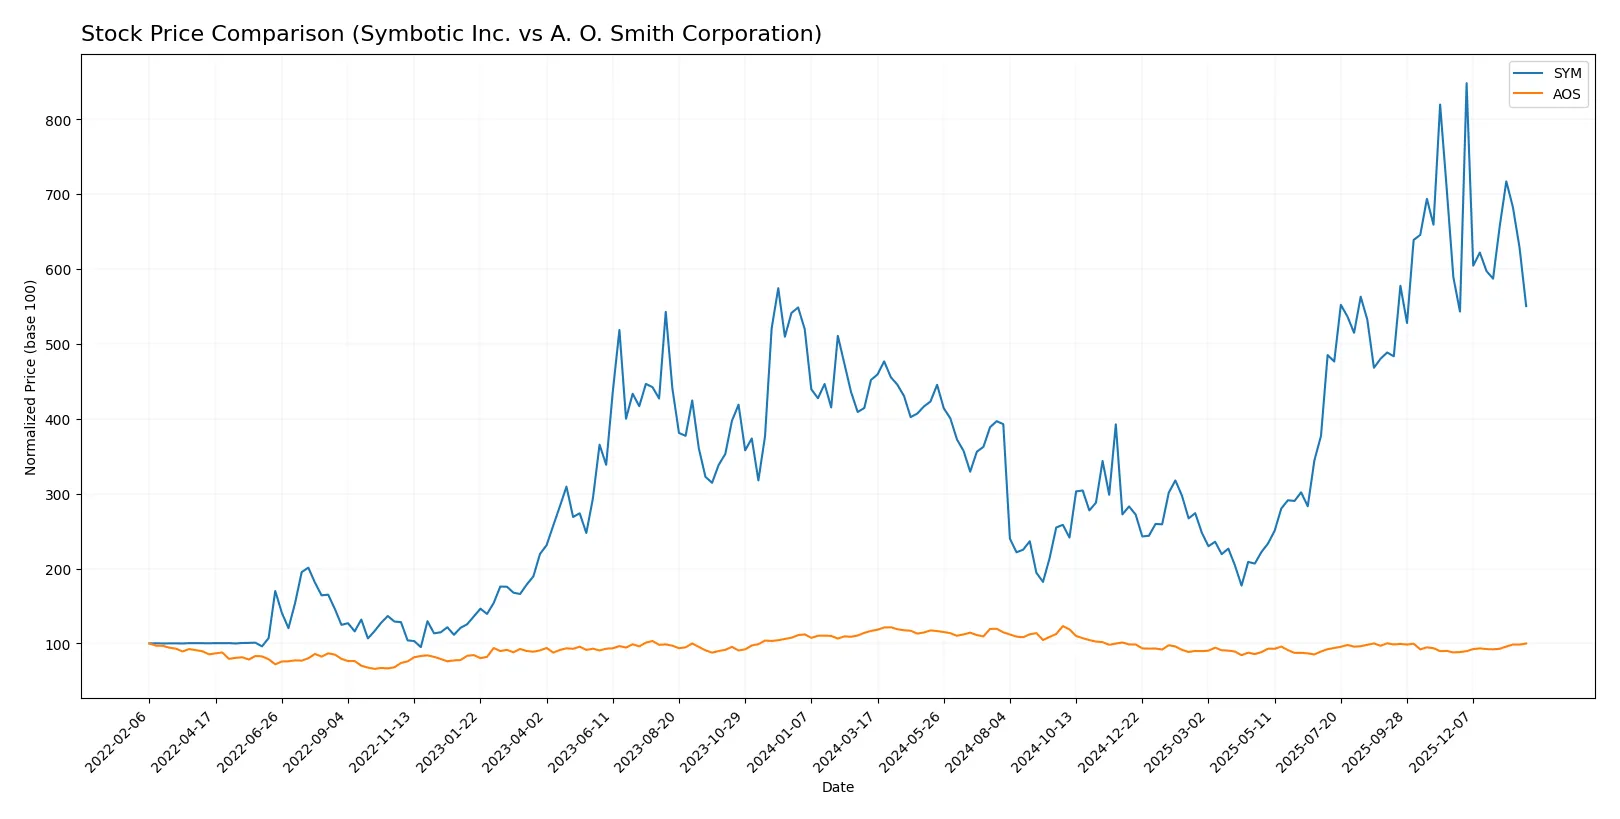
The past year shows contrasting dynamics: Symbotic Inc. posts a strong overall gain despite recent weakness, while A. O. Smith Corporation endures a longer-term decline but recovers sharply in recent months.
Trend Comparison
Symbotic Inc. exhibits a bullish trend with a 21.85% price increase over 12 months, though the pace decelerates. Price ranged from a low of 17.5 to a high of 83.77, with elevated volatility (15.66 std dev).
A. O. Smith Corporation shows a bearish 14.37% decline over the same period but accelerates recently with a 13.52% gain since November 2025. Volatility is moderate (7.87 std dev), with prices between 61.99 and 90.59.
Symbotic leads in annual market performance with a solid overall rise. A. O. Smith’s recent rebound narrows the gap but does not offset its yearly losses.
Target Prices
Analysts present a confident target price range for both Symbotic Inc. and A. O. Smith Corporation.
| Company | Target Low | Target High | Consensus |
|---|---|---|---|
| Symbotic Inc. | 42 | 83 | 65.56 |
| A. O. Smith Corp. | 75 | 85 | 79 |
Symbotic’s consensus target of 65.56 suggests upside from the current 54.37 price, while A. O. Smith’s 79 target exceeds its 73.49 price, signaling moderate growth expectations.

Don’t Let Luck Decide Your Entry Point
Optimize your entry points with our advanced ProRealTime indicators. You’ll get efficient buy signals with precise price targets for maximum performance. Start outperforming now!
How do institutions grade them?
This section compares the recent grades assigned to Symbotic Inc. and A. O. Smith Corporation by leading financial institutions:
Symbotic Inc. Grades
The table below summarizes recent grade actions from key financial firms for Symbotic Inc.:
| Grading Company | Action | New Grade | Date |
|---|---|---|---|
| Barclays | Maintain | Underweight | 2026-01-12 |
| Goldman Sachs | Downgrade | Sell | 2025-12-02 |
| Barclays | Maintain | Underweight | 2025-11-26 |
| Baird | Maintain | Neutral | 2025-11-26 |
| DA Davidson | Maintain | Neutral | 2025-11-25 |
| Citigroup | Maintain | Buy | 2025-11-25 |
| Needham | Maintain | Buy | 2025-11-25 |
| Craig-Hallum | Upgrade | Buy | 2025-11-25 |
| Northland Capital Markets | Maintain | Outperform | 2025-11-25 |
| Cantor Fitzgerald | Maintain | Overweight | 2025-11-25 |
A. O. Smith Corporation Grades
Below is the summary of recent grades from notable analysts for A. O. Smith Corporation:
| Grading Company | Action | New Grade | Date |
|---|---|---|---|
| Stifel | Maintain | Buy | 2026-01-30 |
| Citigroup | Maintain | Neutral | 2026-01-30 |
| DA Davidson | Maintain | Neutral | 2025-11-13 |
| Stifel | Maintain | Buy | 2025-10-29 |
| Citigroup | Maintain | Neutral | 2025-10-29 |
| Oppenheimer | Maintain | Outperform | 2025-07-28 |
| UBS | Maintain | Neutral | 2025-07-28 |
| Baird | Maintain | Neutral | 2025-07-25 |
| Stifel | Maintain | Buy | 2025-07-25 |
| Stifel | Maintain | Buy | 2025-07-21 |
Which company has the best grades?
A. O. Smith Corporation consistently receives buy and neutral ratings with no downgrades. Symbotic Inc. shows mixed grades, including sell and underweight ratings. Investors might perceive A. O. Smith as more favorably viewed by analysts, potentially affecting market sentiment.
Risks specific to each company
The following categories identify the critical pressure points and systemic threats facing both firms in the 2026 market environment:
1. Market & Competition
Symbotic Inc.
- Faces intense competition in automation technology with high innovation demands.
A. O. Smith Corporation
- Competes globally in water heating and treatment, with strong brand presence but exposure to commodity cost fluctuations.
2. Capital Structure & Debt
Symbotic Inc.
- Maintains low debt-to-equity (0.14) and debt-to-assets (1.32%) ratios, indicating conservative leverage.
A. O. Smith Corporation
- Also conservative with low debt-to-equity (0.09) and manageable debt-to-assets (6.11%), supporting financial stability.
3. Stock Volatility
Symbotic Inc.
- Exhibits high beta (2.14), implying elevated stock price volatility and higher risk.
A. O. Smith Corporation
- Lower beta (1.35) reflects more stable stock performance relative to the market.
4. Regulatory & Legal
Symbotic Inc.
- Subject to evolving robotics and automation regulations, potentially increasing compliance costs.
A. O. Smith Corporation
- Faces regulatory scrutiny in manufacturing and environmental standards across multiple jurisdictions.
5. Supply Chain & Operations
Symbotic Inc.
- Dependent on advanced components supply; disruption risks could impact delivery and costs.
A. O. Smith Corporation
- Global supply chain exposure includes raw material price volatility and logistics challenges.
6. ESG & Climate Transition
Symbotic Inc.
- Emerging focus on sustainable automation solutions; ESG integration still developing.
A. O. Smith Corporation
- Strong emphasis on energy-efficient products and sustainability, aligning with climate transition trends.
7. Geopolitical Exposure
Symbotic Inc.
- Primarily US-focused, limiting geopolitical risks but also growth opportunities abroad.
A. O. Smith Corporation
- Operates in North America, China, Europe, India; faces geopolitical tensions impacting global operations.
Which company shows a better risk-adjusted profile?
A. O. Smith Corporation shows a markedly better risk-adjusted profile. Symbotic’s highest risk is its negative profitability and volatile stock price, while A. O. Smith’s main concern lies in global geopolitical exposure. Notably, Symbotic’s negative ROIC (-16.6%) versus A. O. Smith’s strong 23.9% illustrates fundamental operational risk.
Final Verdict: Which stock to choose?
Symbotic Inc. wields a unique edge in rapid revenue growth driven by innovation and operational scale. Its core challenge lies in persistent negative returns and value destruction, signaling a need for careful monitoring. This profile suits investors chasing aggressive growth in emerging tech sectors.
A. O. Smith Corporation boasts a durable competitive moat with strong, consistent returns on invested capital and a robust income statement. It offers greater financial stability and a safer risk profile compared to Symbotic. This stock fits well for Growth at a Reasonable Price (GARP) investors seeking steady income and profitability.
If you prioritize rapid expansion and can tolerate volatility, Symbotic’s growth story might appeal despite its weaker profitability metrics. However, if you seek a resilient business with proven value creation and financial strength, A. O. Smith outshines as a more stable, value-oriented choice commanding a reasonable premium.
Disclaimer: Investment carries a risk of loss of initial capital. The past performance is not a reliable indicator of future results. Be sure to understand risks before making an investment decision.
Go Further
I encourage you to read the complete analyses of Symbotic Inc. and A. O. Smith Corporation to enhance your investment decisions: