Home > Comparison > Industrials > ROP vs AOS
The strategic rivalry between Roper Technologies and A. O. Smith shapes the Industrials sector’s machinery landscape. Roper operates as a diversified software and engineered products powerhouse, while A. O. Smith specializes in manufacturing water heating and treatment solutions. This analysis pits Roper’s tech-driven growth against A. O. Smith’s manufacturing focus to identify which company offers a superior risk-adjusted return for a diversified portfolio in 2026.
Table of contents
Companies Overview
Roper Technologies and A. O. Smith Corporation anchor key niches in the industrial machinery sector with distinct market roles.
Roper Technologies, Inc.: Diverse Industrial Software and Equipment Leader
Roper Technologies commands a broad industrial footprint by designing software and engineered products. Its core revenue stems from cloud-based analytics, healthcare software, and precision instruments. In 2026, Roper emphasizes expanding its software-as-a-service offerings and integrating data-driven solutions across industries, aiming to leverage its diversified portfolio for sustainable growth.
A. O. Smith Corporation: Premier Water Heating and Treatment Manufacturer
A. O. Smith specializes in residential and commercial water heating and treatment systems. Its revenues rely on sales of water heaters, boilers, and filtration products across North America, China, and Europe. The company’s 2026 strategy focuses on enhancing energy-efficient technologies and expanding e-commerce channels to capture evolving consumer preferences in water solutions.
Strategic Collision: Similarities & Divergences
Both firms operate in industrial machinery but diverge philosophically; Roper pursues a technology-driven, software-centric model, while A. O. Smith leans on hardware manufacturing and traditional distribution. They compete indirectly in industrial markets yet face distinct battlegrounds—software innovation versus energy-efficient physical products. Their investment profiles contrast sharply: Roper offers growth through digital transformation, A. O. Smith provides steady cash flow from established product lines.
Income Statement Comparison
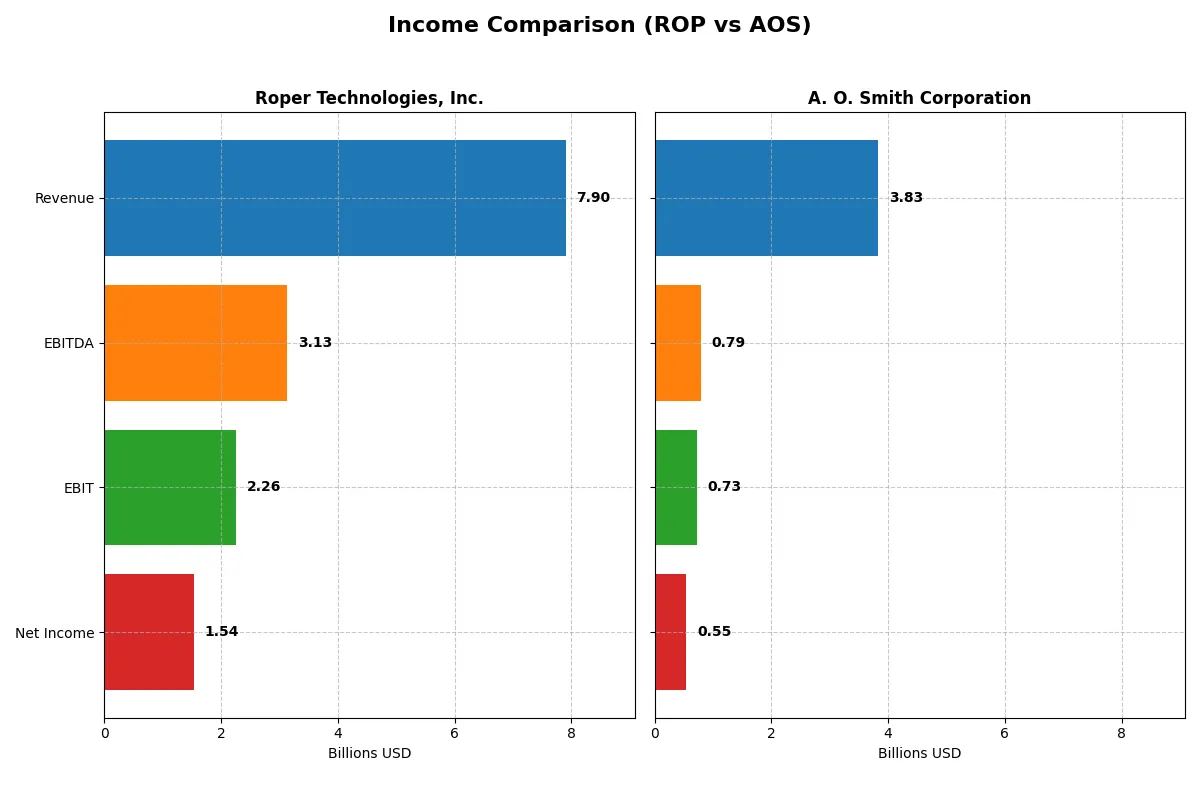
The following data dissects the core profitability and scalability of both corporate engines to reveal who dominates the bottom line:
| Metric | Roper Technologies, Inc. (ROP) | A. O. Smith Corporation (AOS) |
|---|---|---|
| Revenue | 7.9B | 3.83B |
| Cost of Revenue | 2.43B | 2.34B |
| Operating Expenses | 3.24B | 759M |
| Gross Profit | 5.47B | 1.49B |
| EBITDA | 3.13B | 792M |
| EBIT | 2.26B | 729M |
| Interest Expense | 325M | 13.5M |
| Net Income | 1.54B | 546M |
| EPS | 14.31 | 3.86 |
| Fiscal Year | 2025 | 2025 |
Income Statement Analysis: The Bottom-Line Duel
This income statement comparison reveals which company drives superior operational efficiency and profit growth through its core business engine.
Roper Technologies, Inc. Analysis
Roper Technologies’ revenue climbed 12% in 2025, reaching $7.9B, supported by a strong gross margin of 69.2%. Despite a slight net margin dip to 19.4%, the company maintained robust operating income near $2.2B, showing solid momentum. However, operating expenses grew in line with revenue, slightly pressuring net income growth.
A. O. Smith Corporation Analysis
A. O. Smith’s revenue held steady at $3.8B in 2025 with a modest 0.3% increase over 2024. Gross margin remained healthy at 38.8%, while net margin improved marginally to 14.3%. The firm showed moderate earnings growth and managed costs well, sustaining positive momentum despite flat top-line performance.
Margin Power vs. Revenue Scale
Roper Technologies leads with superior scale and higher margins, delivering nearly triple A. O. Smith’s revenue and significantly stronger net income margins. A. O. Smith exhibits steadier, incremental growth with better expense control. For investors, Roper’s profile suits those seeking growth and margin dominance; A. O. Smith appeals to those favoring stable earnings and cost discipline.
Financial Ratios Comparison
These vital ratios act as a diagnostic tool to expose the underlying fiscal health, valuation premiums, and capital efficiency of the companies compared below:
| Ratios | Roper Technologies, Inc. (ROP) | A. O. Smith Corporation (AOS) |
|---|---|---|
| ROE | 8.21% (2024) | 25.64% (2025) |
| ROIC | 5.50% (2024) | 23.94% (2025) |
| P/E | 35.94 (2024) | 17.13 (2025) |
| P/B | 2.95 (2024) | 4.39 (2025) |
| Current Ratio | 0.40 (2024) | 1.50 (2025) |
| Quick Ratio | 0.37 (2024) | 0.94 (2025) |
| D/E | 0.41 (2024) | 0.09 (2025) |
| Debt-to-Assets | 24.48% (2024) | 6.11% (2025) |
| Interest Coverage | 7.70 (2024) | 53.93 (2025) |
| Asset Turnover | 0.22 (2024) | 1.22 (2025) |
| Fixed Asset Turnover | 47.02 (2024) | 5.62 (2025) |
| Payout Ratio | 20.78% (2024) | 35.83% (2025) |
| Dividend Yield | 0.58% (2024) | 2.09% (2025) |
| Fiscal Year | 2024 | 2025 |
Efficiency & Valuation Duel: The Vital Signs
Financial ratios act as a company’s DNA, unveiling hidden risks and operational strengths essential for investment decisions.
Roper Technologies, Inc.
Roper shows a respectable net margin of 19.44%, but zero reported ROE and ROIC raise red flags on profitability sustainability. Its P/E ratio of 31.06 signals an expensive valuation. Dividend yield stands low at 0.74%, suggesting limited shareholder returns, likely focusing on reinvestment for growth and innovation.
A. O. Smith Corporation
A. O. Smith delivers strong profitability with a 25.64% ROE and 23.94% ROIC, reflecting efficient capital use. The P/E ratio of 17.13 indicates a fairly valued stock. It supports shareholders with a solid 2.09% dividend yield, balancing income distribution with steady operational performance.
Balanced Profitability vs. Valuation Discipline
A. O. Smith offers a superior mix of profitability and reasonable valuation, contrasted with Roper’s stretched price and weak returns. Investors seeking operational efficiency and income may prefer A. O. Smith’s profile, while Roper remains a riskier growth play with less immediate shareholder rewards.
Which one offers the Superior Shareholder Reward?
I observe that Roper Technologies (ROP) pays a modest dividend yield of 0.74% with a sustainable payout ratio near 23%, supported by strong free cash flow coverage (~98%). Its buyback program, integral to total returns, complements dividends prudently. A. O. Smith (AOS) offers a higher dividend yield at 2.09%, but with a riskier payout ratio around 36%, and weaker free cash flow coverage (~88%). AOS’s buybacks are less emphasized. Historically, ROP’s conservative distribution and robust cash flow suggest a more sustainable model. I conclude ROP delivers superior total shareholder reward in 2026 due to balanced income and capital return with prudent risk management.
Comparative Score Analysis: The Strategic Profile
The radar chart reveals the fundamental DNA and trade-offs of Roper Technologies and A. O. Smith Corporation, highlighting their core financial strengths and weaknesses:
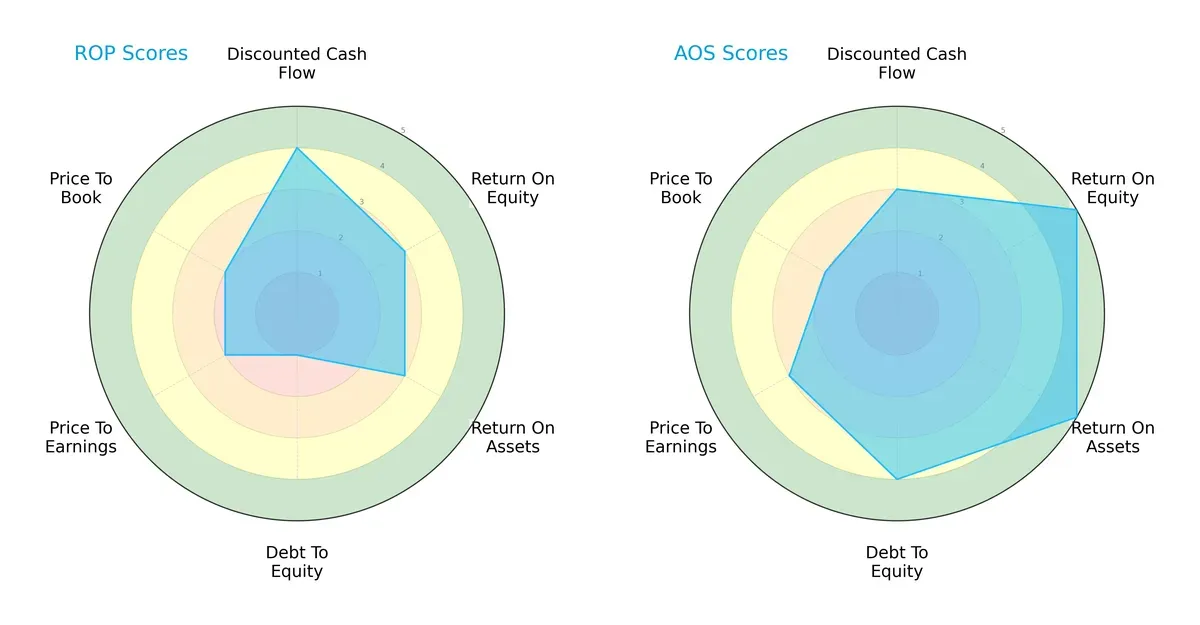
Roper shows strength in discounted cash flow with a score of 4 but suffers from a weak debt-to-equity score of 1, signaling high financial leverage risk. A. O. Smith delivers a more balanced profile with top scores in return on equity (5) and assets (5), and a healthier debt-to-equity score of 4. Roper relies on cash flow valuation, while A. O. Smith excels in operational efficiency and financial stability.
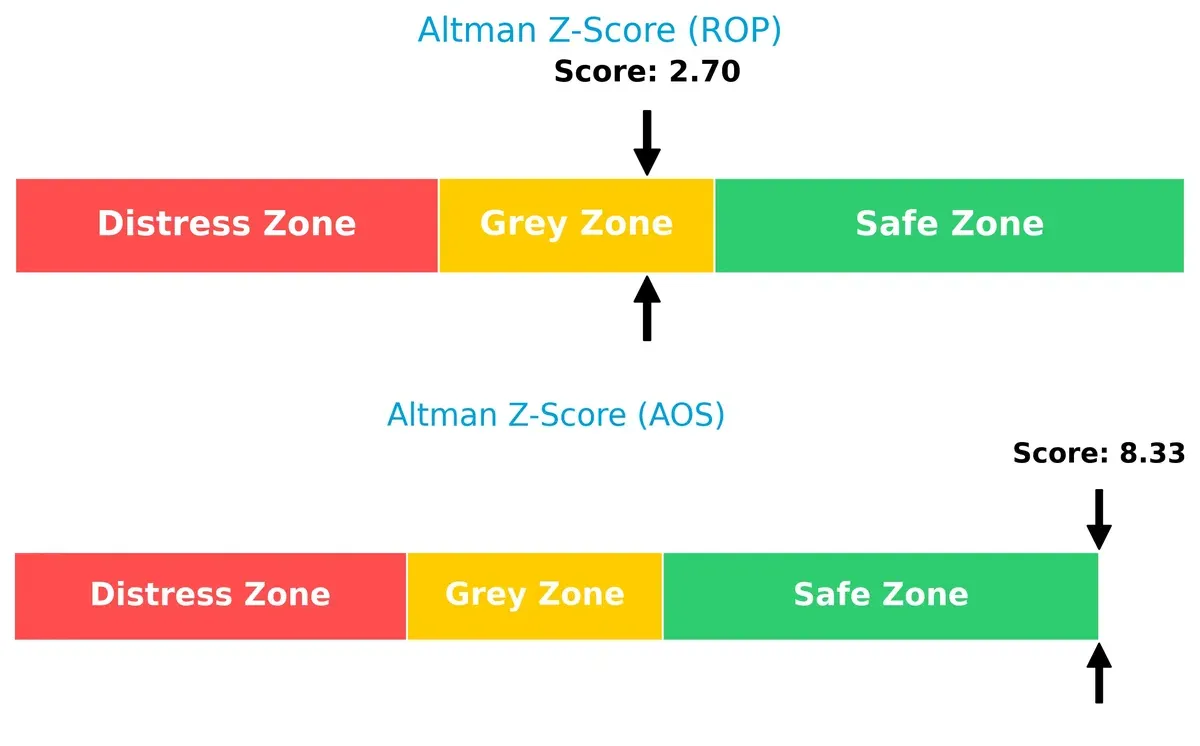
Bankruptcy Risk: Solvency Showdown
The Altman Z-Score difference signals distinct solvency risks: Roper sits in the grey zone at 2.7, implying moderate bankruptcy risk, whereas A. O. Smith’s 8.3 score places it safely in the low-risk zone:
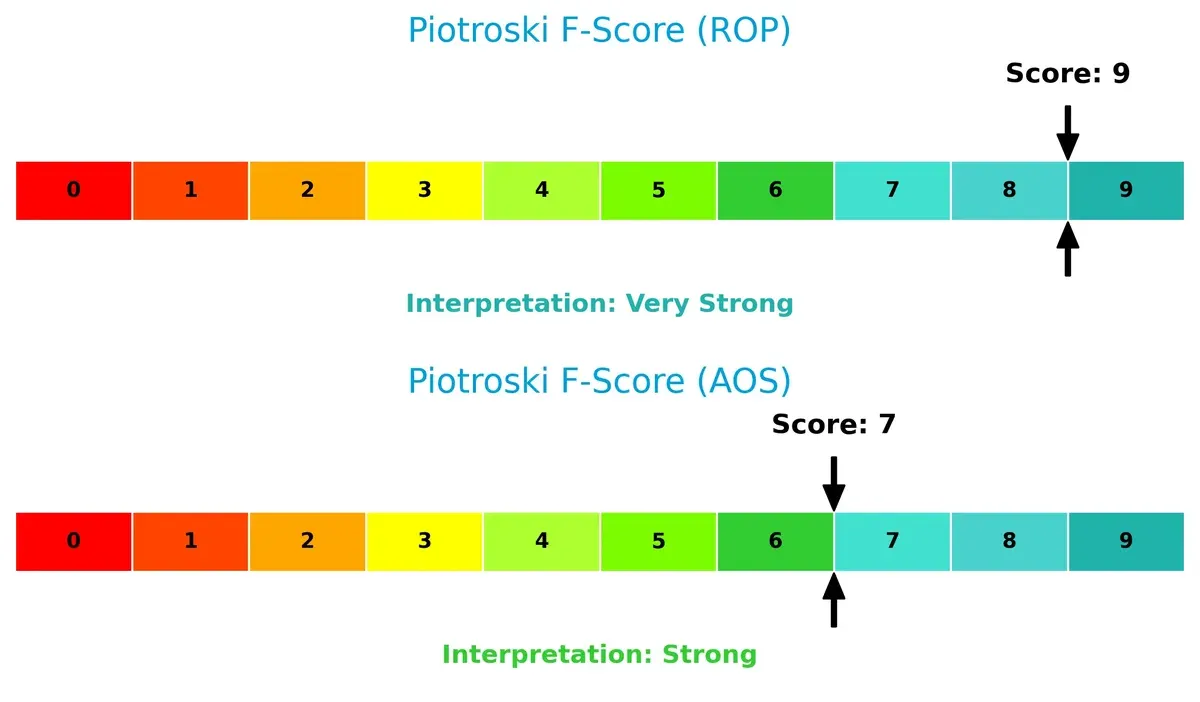
Financial Health: Quality of Operations
Roper’s Piotroski F-Score of 9 indicates robust financial health, outperforming A. O. Smith’s strong but lower score of 7, suggesting Roper has fewer internal red flags:
How are the two companies positioned?
This section dissects ROP and AOS’s operational DNA by comparing their revenue by segment and internal strengths and weaknesses. The goal is to confront their economic moats and identify which model offers the most resilient, sustainable competitive advantage today.
Revenue Segmentation: The Strategic Mix
This visual comparison dissects how Roper Technologies and A. O. Smith diversify their income streams and where their primary sector bets lie:
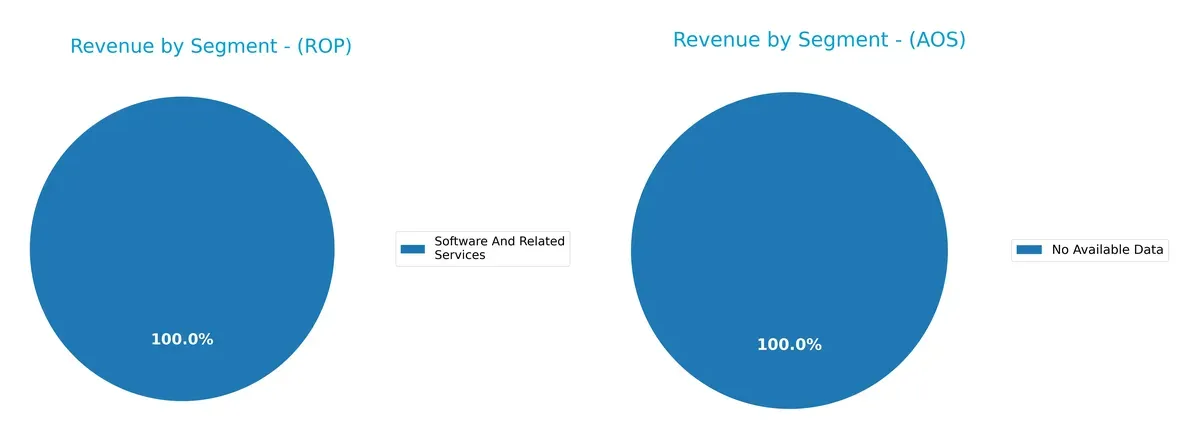
Roper Technologies shows a diversified mix, with strong revenue from Application Software ($3.19B), Network Software ($1.44B), and Technology Enabled Products ($1.55B) in 2023. This contrasts with A. O. Smith, which lacks available segment data. Roper pivots on software and tech-enabled solutions, reducing concentration risk and leveraging ecosystem lock-in. This broad base supports resilience versus reliance on a single segment.
Strengths and Weaknesses Comparison
This table compares the strengths and weaknesses of Roper Technologies, Inc. and A. O. Smith Corporation:
ROP Strengths
- Strong net margin at 19.44%
- Favorable debt-to-assets and interest coverage
- Diversified software and technology segments
- Significant US revenue base ($6.06B in 2024)
AOS Strengths
- High ROE (25.64%) and ROIC (23.94%)
- Favorable asset turnover and interest coverage
- Solid global presence with $3.8B revenue outside North America
- Strong dividend yield (2.09%)
ROP Weaknesses
- Zero ROE and ROIC indicate weak capital efficiency
- Unfavorable liquidity ratios (current and quick ratio)
- High P/E ratio (31.06) suggests valuation risk
- Limited geographic diversification outside US
AOS Weaknesses
- WACC above 10% signals higher capital costs
- Elevated PB ratio (4.39) may imply overvaluation
- Neutral liquidity ratios could constrain short-term flexibility
ROP shows strong profitability but struggles with capital efficiency and liquidity. AOS displays superior return metrics and global reach but faces valuation and cost of capital challenges. Both companies must balance growth with prudent financial management to sustain competitive advantage.
The Moat Duel: Analyzing Competitive Defensibility
A structural moat is the only true shield preserving long-term profits from relentless competitive erosion. Let’s dissect these firms’ moats:
Roper Technologies, Inc.: Diversified Software & Engineering Intangibles
Roper’s moat stems from its vast portfolio of specialized software and engineered solutions, reflected in its strong gross margin of 69%. However, declining ROIC signals potential pressure on its capital efficiency in 2026.
A. O. Smith Corporation: Durable Manufacturing & Innovation Cost Advantage
A. O. Smith leverages manufacturing scale and product innovation to sustain a 19% EBIT margin and growing ROIC, outperforming Roper in capital returns. Its steady margin expansion supports future market penetration, especially internationally.
Capital Efficiency vs. Product Innovation: The Moat Face-Off
A. O. Smith holds the deeper moat with a robust and rising ROIC exceeding WACC by nearly 14%, confirming superior capital allocation. Roper’s diverse intangibles offer breadth, but faltering ROIC weakens its fortress. A. O. Smith is better positioned to defend and expand its market share.
Which stock offers better returns?
Over the past year, both Roper Technologies, Inc. and A. O. Smith Corporation experienced bearish trends with contrasting recent momentum and trading volume dynamics.
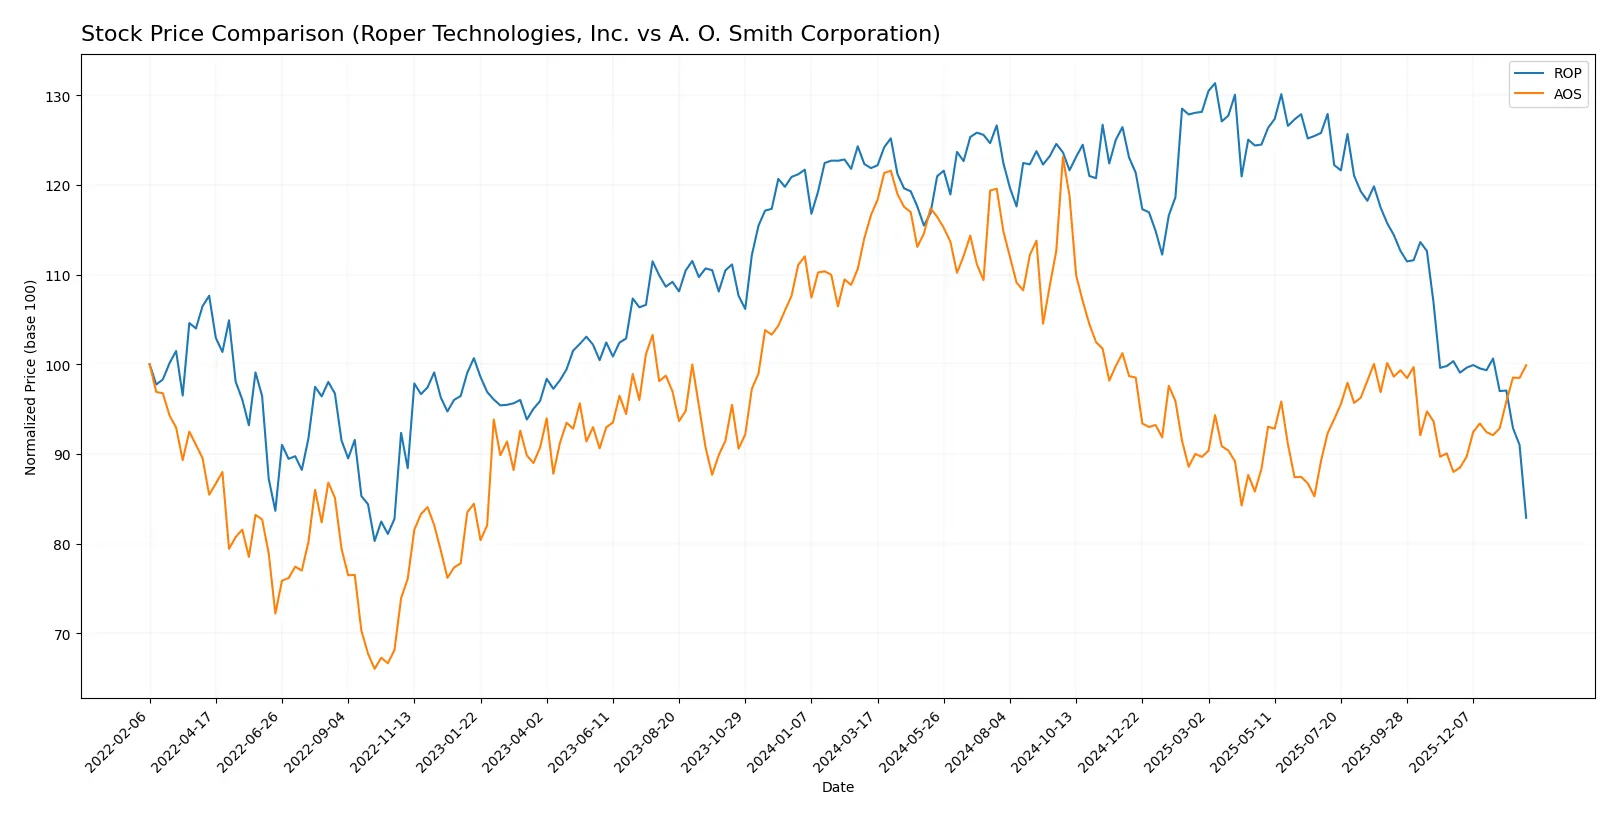
Trend Comparison
Roper Technologies, Inc. shows a 32.0% price decline over 12 months, reflecting a bearish trend with decelerating downward momentum and high volatility (std dev 44.8). The price ranged from 588.38 to 371.23.
A. O. Smith Corporation declined 14.37% overall but exhibits accelerating recovery recently with a 13.52% price increase since November 2025 and lower volatility (std dev 7.87). The stock traded between 90.59 and 61.99.
Comparing trends, A. O. Smith delivered the higher market performance recently, showing a turnaround while Roper continues a strong bearish slide.
Target Prices
Analysts present a solid target consensus for both Roper Technologies, Inc. and A. O. Smith Corporation.
| Company | Target Low | Target High | Consensus |
|---|---|---|---|
| Roper Technologies, Inc. | 365 | 575 | 475.5 |
| A. O. Smith Corporation | 75 | 85 | 79 |
The consensus target for Roper Technologies stands well above its current price of 371, signaling strong upside potential. A. O. Smith’s target consensus also exceeds the current price of 73.5, indicating modest expected growth.

Don’t Let Luck Decide Your Entry Point
Optimize your entry points with our advanced ProRealTime indicators. You’ll get efficient buy signals with precise price targets for maximum performance. Start outperforming now!
How do institutions grade them?
Here are the latest institutional grades for both companies:
Roper Technologies, Inc. Grades
The table below shows recent grade updates from recognized grading firms.
| Grading Company | Action | New Grade | Date |
|---|---|---|---|
| Goldman Sachs | Maintain | Neutral | 2026-01-29 |
| Argus Research | Downgrade | Hold | 2026-01-28 |
| Oppenheimer | Downgrade | Perform | 2026-01-28 |
| Mizuho | Maintain | Underperform | 2026-01-28 |
| Truist Securities | Maintain | Buy | 2026-01-28 |
| RBC Capital | Maintain | Sector Perform | 2026-01-28 |
| Barclays | Maintain | Underweight | 2026-01-28 |
| Stifel | Downgrade | Hold | 2026-01-28 |
| Citigroup | Maintain | Buy | 2026-01-28 |
| JP Morgan | Maintain | Underweight | 2026-01-28 |
A. O. Smith Corporation Grades
Below are recent grades assigned by reputable grading companies.
| Grading Company | Action | New Grade | Date |
|---|---|---|---|
| Stifel | Maintain | Buy | 2026-01-30 |
| Citigroup | Maintain | Neutral | 2026-01-30 |
| DA Davidson | Maintain | Neutral | 2025-11-13 |
| Stifel | Maintain | Buy | 2025-10-29 |
| Citigroup | Maintain | Neutral | 2025-10-29 |
| Oppenheimer | Maintain | Outperform | 2025-07-28 |
| UBS | Maintain | Neutral | 2025-07-28 |
| Baird | Maintain | Neutral | 2025-07-25 |
| Stifel | Maintain | Buy | 2025-07-25 |
| Stifel | Maintain | Buy | 2025-07-21 |
Which company has the best grades?
A. O. Smith Corporation holds consistently higher grades, including multiple Buy and Outperform ratings. Roper Technologies shows a mix of Hold and Underperform, indicating more cautious sentiment. This contrast suggests greater institutional confidence in AOS’s near-term outlook.
Risks specific to each company
The following categories identify the critical pressure points and systemic threats facing both firms in the 2026 market environment:
1. Market & Competition
Roper Technologies, Inc. (ROP)
- Operates diverse software and engineered products in industrial machinery, facing tech disruption and competitive innovation risks.
A. O. Smith Corporation (AOS)
- Focuses on water heaters and treatment; global footprint exposes it to intense regional competition and evolving customer preferences.
2. Capital Structure & Debt
Roper Technologies, Inc. (ROP)
- Low debt levels and strong interest coverage (6.96x) indicate conservative leverage but unfavorable liquidity ratios.
A. O. Smith Corporation (AOS)
- Low leverage (debt/equity 0.09) and very strong interest coverage (54x) signal robust capital structure and financial resilience.
3. Stock Volatility
Roper Technologies, Inc. (ROP)
- Beta of 0.94 suggests below-market volatility, offering relative stability in turbulent markets.
A. O. Smith Corporation (AOS)
- Beta of 1.35 reflects higher sensitivity to market swings, increasing risk but potential for greater returns.
4. Regulatory & Legal
Roper Technologies, Inc. (ROP)
- Exposure to data privacy and software compliance regulations could increase costs and operational complexity.
A. O. Smith Corporation (AOS)
- Subject to environmental and safety standards in manufacturing; regulatory shifts in global markets may pose challenges.
5. Supply Chain & Operations
Roper Technologies, Inc. (ROP)
- Complex supply chain for specialized instruments and software solutions risks disruption amid global logistics pressures.
A. O. Smith Corporation (AOS)
- Manufacturing and distribution across multiple continents expose it to geopolitical and supply chain bottlenecks.
6. ESG & Climate Transition
Roper Technologies, Inc. (ROP)
- ESG risks include technology lifecycle impacts and adapting to climate-related regulatory demands.
A. O. Smith Corporation (AOS)
- Faces pressure to improve energy efficiency in products and reduce carbon footprint amid stricter environmental mandates.
7. Geopolitical Exposure
Roper Technologies, Inc. (ROP)
- Primarily US-based with limited global risk, but sensitive to trade policies affecting tech components.
A. O. Smith Corporation (AOS)
- Significant operations in China, Europe, and India increase vulnerability to geopolitical tensions and trade disputes.
Which company shows a better risk-adjusted profile?
A. O. Smith demonstrates a superior risk-adjusted profile driven by stronger financial health, higher profitability, and robust capital structure. Roper Technologies faces greater liquidity concerns and operational complexity despite stable stock volatility. Roper’s Altman Z-score in the grey zone contrasts with AOS’s safe zone, reinforcing caution. The most impactful risk for Roper is its unfavorable liquidity ratios amidst complex supply chains. For AOS, geopolitical exposure in key international markets remains the prime concern. Recent data highlight AOS’s strong interest coverage and efficiency metrics, justifying its lower financial risk compared to Roper.
Final Verdict: Which stock to choose?
Roper Technologies stands out for its robust revenue growth and strong gross margins, making it a cash-generating powerhouse. However, its declining ROIC and strained liquidity ratios are points of vigilance. It fits portfolios seeking aggressive growth with a tolerance for financial leverage risks.
A. O. Smith offers a durable competitive moat, evidenced by its expanding ROIC and rock-solid balance sheet. Its steady cash flow and conservative debt profile provide a safety cushion relative to Roper. This makes it more suitable for investors pursuing growth at a reasonable price with a focus on stability.
If you prioritize high-growth momentum and can manage short-term financial risks, Roper Technologies presents a compelling scenario due to its strong top-line expansion. However, if you seek a durable economic moat with better financial health and consistent returns, A. O. Smith outshines as the more stable choice, commanding a premium for its safety.
Disclaimer: Investment carries a risk of loss of initial capital. The past performance is not a reliable indicator of future results. Be sure to understand risks before making an investment decision.
Go Further
I encourage you to read the complete analyses of Roper Technologies, Inc. and A. O. Smith Corporation to enhance your investment decisions: