Home > Comparison > Industrials > ROK vs AOS
The strategic rivalry between Rockwell Automation, Inc. and A. O. Smith Corporation shapes the Industrials sector’s competitive landscape. Rockwell Automation excels as a technologically advanced industrial automation leader, while A. O. Smith focuses on manufacturing water heating and treatment solutions with a steady, product-driven model. This analysis contrasts their operational philosophies to identify which offers superior risk-adjusted returns amid evolving industrial demands. Investors will gain clarity on the optimal corporate trajectory for portfolio diversification.

Table of contents
Companies Overview
Rockwell Automation and A. O. Smith stand as key industrial players shaping their respective markets through innovation and scale.
Rockwell Automation, Inc.: Industrial Automation Leader
Rockwell Automation dominates the industrial automation space with a diversified revenue mix across Intelligent Devices, Software & Control, and Lifecycle Services. Its core business centers on digital transformation solutions that integrate hardware, software, and services. In 2026, the company prioritizes expanding its software and control offerings to drive smarter manufacturing and operational efficiency.
A. O. Smith Corporation: Water Heating and Treatment Specialist
A. O. Smith commands a strong position in the residential and commercial water heating and treatment markets. Its revenue engine hinges on manufacturing gas, electric, and heat pump water heaters alongside water treatment products, sold globally through wholesale and retail channels. The company’s 2026 strategy emphasizes geographic expansion and innovation in energy-efficient heating solutions.
Strategic Collision: Similarities & Divergences
Both firms operate in the industrial machinery sector but pursue distinct philosophies. Rockwell Automation invests heavily in digital ecosystems and software integration, while A. O. Smith focuses on product innovation within traditional hardware markets. Their primary battleground lies in industrial efficiency—Rockwell through automation software, A. O. Smith via sustainable water heating. These differences create unique investment profiles balancing tech-driven growth against steady product demand.
Income Statement Comparison
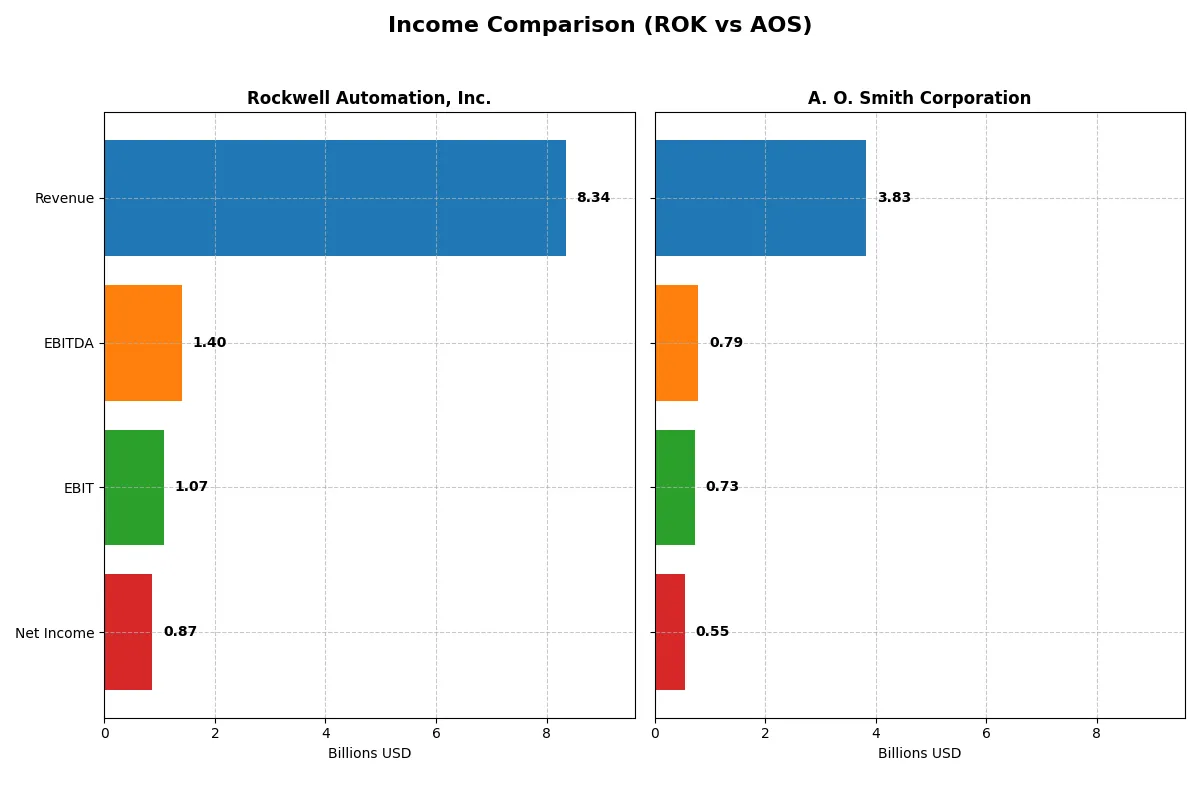
This data dissects the core profitability and scalability of both corporate engines to reveal who dominates the bottom line:
| Metric | Rockwell Automation, Inc. (ROK) | A. O. Smith Corporation (AOS) |
|---|---|---|
| Revenue | 8.34B | 3.83B |
| Cost of Revenue | 4.33B | 2.34B |
| Operating Expenses | 2.59B | 759M |
| Gross Profit | 4.02B | 1.49B |
| EBITDA | 1.40B | 792M |
| EBIT | 1.07B | 729M |
| Interest Expense | 156M | 13.5M |
| Net Income | 869M | 546M |
| EPS | 7.69 | 3.86 |
| Fiscal Year | 2025 | 2025 |
Income Statement Analysis: The Bottom-Line Duel
This income statement comparison reveals which company runs its corporate engine with superior efficiency and sustainable profitability.
Rockwell Automation, Inc. Analysis
Rockwell Automation’s revenue grew 19% from 2021 to 2025, peaking at $8.3B in 2025. However, net income declined 36% over the same period, falling to $867M in 2025. Gross margin remains strong at 48%, but net margin dropped sharply to 10.4%. The latest year shows weakening earnings momentum with a 7.4% EPS decline, signaling margin pressure despite stable revenue.
A. O. Smith Corporation Analysis
A. O. Smith’s revenue rose 8.2% from 2021 to 2025, reaching $3.8B, while net income increased 12% to $546M. Gross margin is modest at 38.8%, but net margin is healthier at 14.3%. The company improved EPS by 6.3% in 2025, reflecting steady operational efficiency and margin expansion. EBIT margin at 19% highlights disciplined cost control.
Margin Resilience vs. Revenue Scale
Rockwell Automation delivers scale with higher revenue but suffers declining profitability and margins. A. O. Smith posts lower revenue but sustains stronger margin trends and consistent earnings growth. Investors seeking margin stability and EPS momentum may find A. O. Smith’s profile more attractive, while Rockwell’s recent earnings softness raises caution despite its larger top line.
Financial Ratios Comparison
These vital ratios act as a diagnostic tool to expose the underlying fiscal health, valuation premiums, and capital efficiency of the companies analyzed:
| Ratios | Rockwell Automation (ROK) | A. O. Smith Corporation (AOS) |
|---|---|---|
| ROE | 23.78% | 25.64% |
| ROIC | 13.71% | 23.94% |
| P/E | 45.33 | 17.13 |
| P/B | 10.78 | 4.39 |
| Current Ratio | 1.14 | 1.50 |
| Quick Ratio | 0.77 | 0.94 |
| D/E | 1.00 | 0.09 |
| Debt-to-Assets | 32.51% | 6.11% |
| Interest Coverage | 9.12 | 53.93 |
| Asset Turnover | 0.74 | 1.22 |
| Fixed Asset Turnover | 6.95 | 5.62 |
| Payout ratio | 68.01% | 35.83% |
| Dividend yield | 1.50% | 2.09% |
| Fiscal Year | 2025 | 2025 |
Efficiency & Valuation Duel: The Vital Signs
Financial ratios act as a company’s DNA, unveiling hidden risks and operational strengths through profitability, valuation, and capital structure metrics.
Rockwell Automation, Inc.
Rockwell Automation exhibits strong profitability with a 23.78% ROE and a 10.42% net margin, signaling operational efficiency. However, its valuation appears stretched with a P/E of 45.33 and a P/B of 10.78. The company offers a modest 1.5% dividend yield, balancing shareholder returns amid reinvestments in R&D.
A. O. Smith Corporation
A. O. Smith delivers robust profitability, boasting a 25.64% ROE and a superior 14.26% net margin. Its valuation is more reasonable, with a P/E of 17.13, implying fair market pricing. The firm supports shareholders with a 2.09% dividend yield and maintains a conservative debt profile, enhancing financial stability.
Premium Valuation vs. Operational Safety
A. O. Smith offers a better balance of risk and reward, combining strong profits with a reasonable valuation and solid dividend. Rockwell Automation’s premium valuation demands caution despite its efficiency. Investors seeking growth potential may prefer Rockwell, while those favoring steadiness might lean toward A. O. Smith.
Which one offers the Superior Shareholder Reward?
I see Rockwell Automation (ROK) and A. O. Smith (AOS) both pay dividends and execute buybacks but differ in intensity. ROK yields about 1.5–2.1% with payout ratios near 60–70%, signaling a high dividend commitment. Meanwhile, AOS yields slightly higher at 1.9–2.1% with a more conservative 33–36% payout ratio, preserving ample free cash flow. ROK also maintains larger buybacks, amplifying shareholder returns but at higher leverage (debt/equity ~1.0) versus AOS’s conservative debt (debt/equity ~0.1). AOS’s stronger cash flow coverage and lower leverage underpin more sustainable distributions. In 2026, I favor AOS for a balanced, durable total return driven by dividends plus consistent buybacks backed by robust fundamentals.
Comparative Score Analysis: The Strategic Profile
The radar chart reveals the fundamental DNA and trade-offs of Rockwell Automation, Inc. and A. O. Smith Corporation, highlighting their financial strengths and valuation nuances:
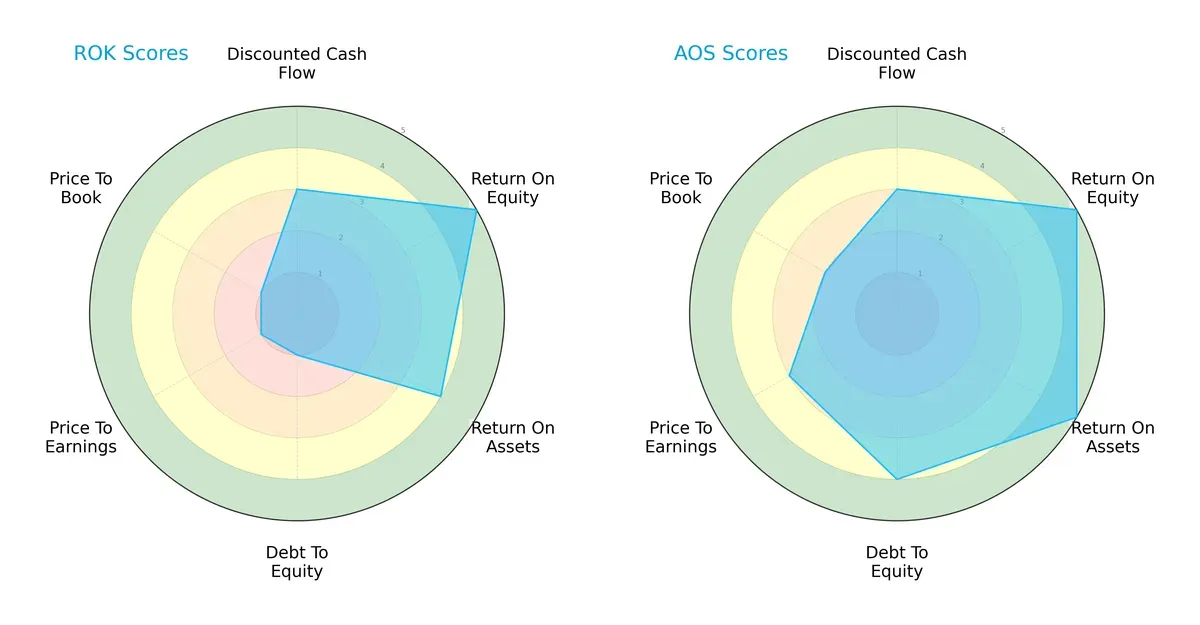
A. O. Smith offers a more balanced profile with strong scores in ROE (5), ROA (5), and debt-to-equity (4), reflecting efficient asset use and solid financial stability. Rockwell Automation matches on ROE (5) but lags with a weak debt-to-equity (1) and valuation scores (PE and PB at 1), suggesting financial risk and possible overvaluation. Rockwell relies heavily on profitability metrics, whereas A. O. Smith blends profitability with prudent leverage and valuation.
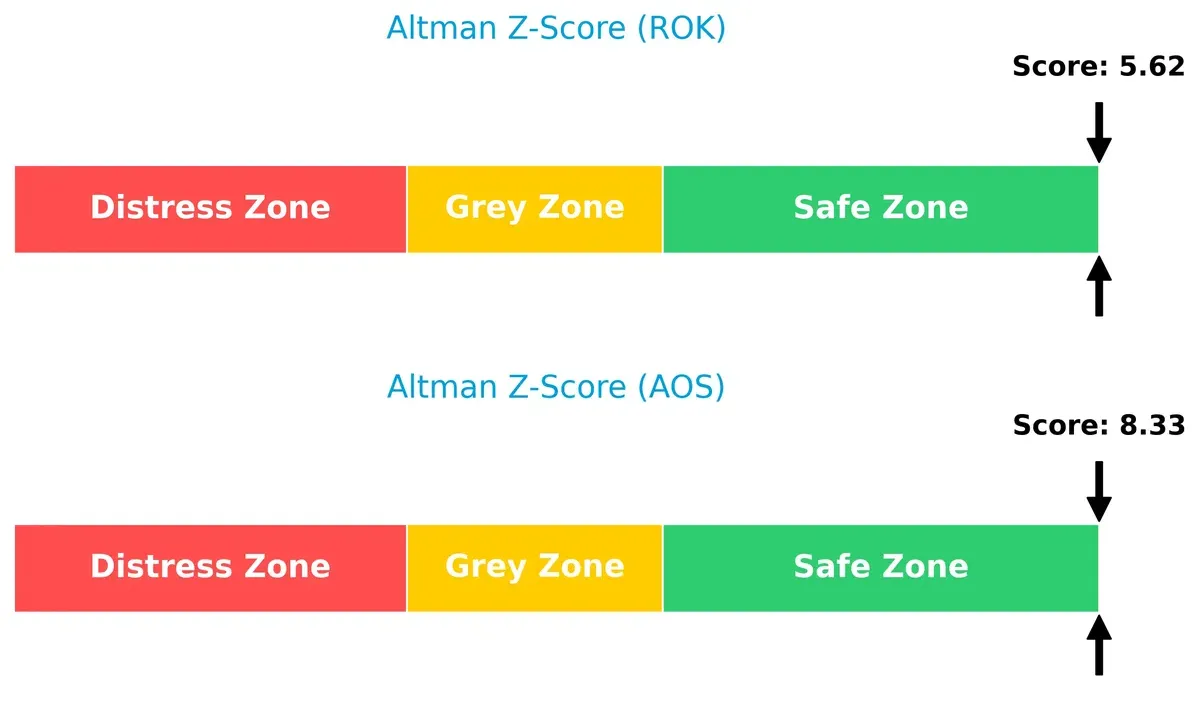
Bankruptcy Risk: Solvency Showdown
The Altman Z-Score gap favors A. O. Smith (8.33) over Rockwell Automation (5.62), indicating stronger solvency and lower bankruptcy risk for A. O. Smith in this cycle:
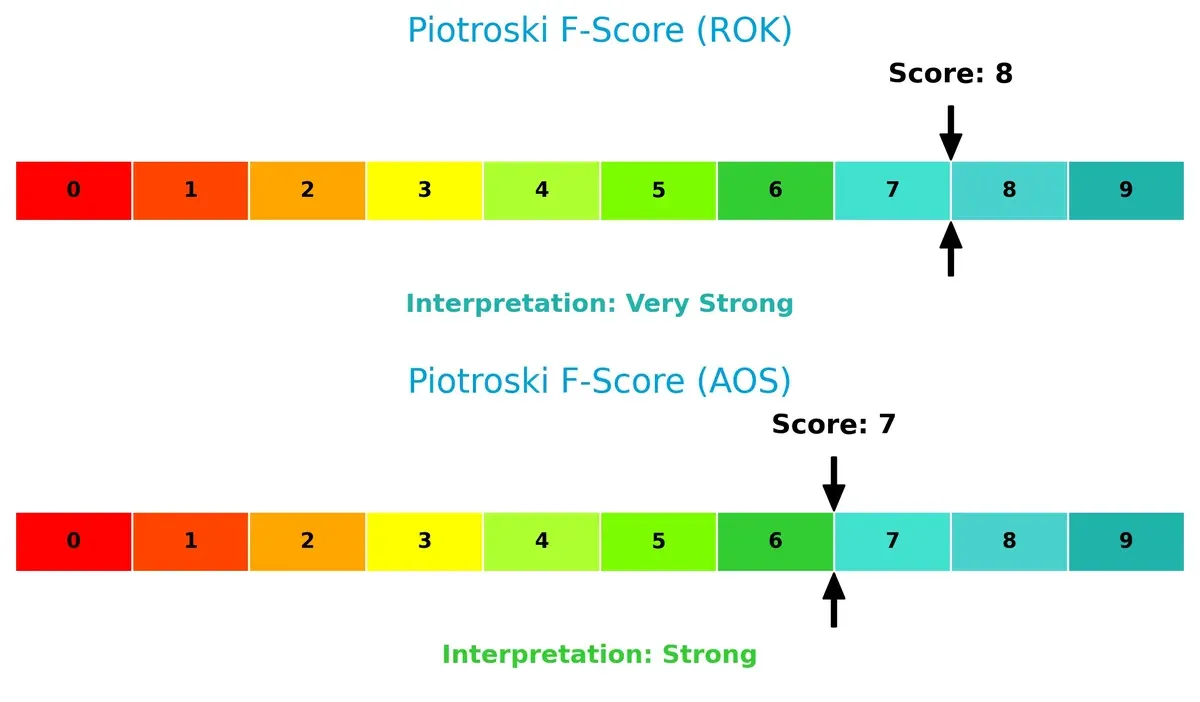
Financial Health: Quality of Operations
Rockwell Automation scores an 8 on the Piotroski F-Score, slightly outperforming A. O. Smith’s 7. Both are financially strong, but Rockwell shows peak operational health, while A. O. Smith remains solid without red flags:
How are the two companies positioned?
This section dissects the operational DNA of Rockwell Automation and A. O. Smith by comparing their revenue distribution and internal strengths and weaknesses. The goal is to confront their economic moats, identifying which model offers the most resilient competitive advantage today.
Revenue Segmentation: The Strategic Mix
This comparison dissects how Rockwell Automation and A. O. Smith diversify their income streams and where their primary sector bets lie:
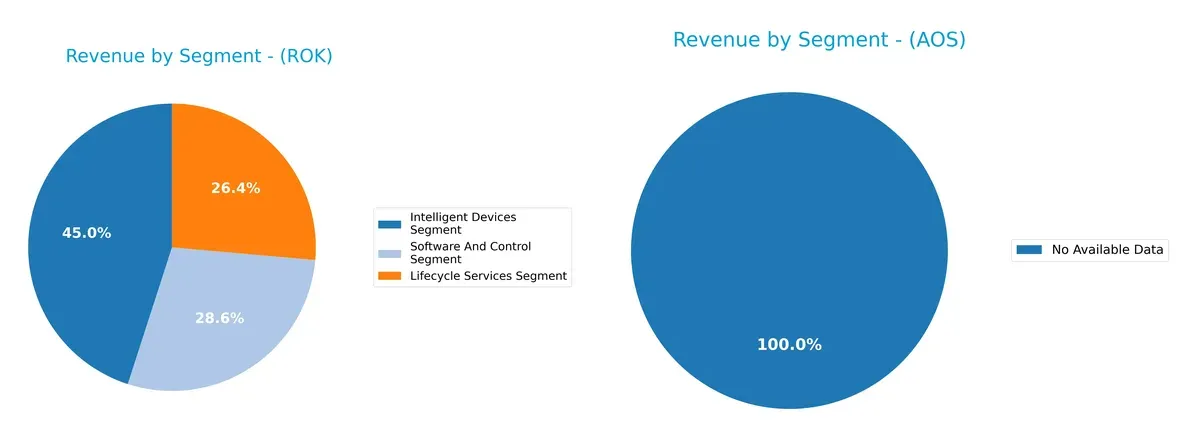
Rockwell Automation anchors its revenue in three balanced segments: Intelligent Devices at $3.76B, Lifecycle Services at $2.20B, and Software and Control at $2.38B in 2025. This mix reflects a strategic pivot towards integrated automation solutions, reducing concentration risk. A. O. Smith lacks available segment data, preventing a direct comparison. Rockwell’s diversified approach signals robust ecosystem lock-in and infrastructure dominance in industrial automation.
Strengths and Weaknesses Comparison
This table compares the Strengths and Weaknesses of Rockwell Automation and A. O. Smith Corporation:
Rockwell Automation Strengths
- Diversified revenue streams across Intelligent Devices, Lifecycle Services, and Software segments
- Solid profitability with favorable net margin and ROIC
- Strong global presence with significant North America and EMEA sales
- Favorable interest coverage and fixed asset turnover ratios
A. O. Smith Strengths
- Higher net margin, ROE, and ROIC than Rockwell
- Lower debt levels with favorable debt-to-assets and debt-to-equity ratios
- Strong asset turnover and interest coverage ratios
- Favorable dividend yield and balanced geographic exposure between North America and Rest of World
Rockwell Automation Weaknesses
- Elevated P/E and P/B ratios indicate potential overvaluation
- Quick ratio below 1 signals weaker short-term liquidity
- WACC higher than ROIC, suggesting capital cost challenges
- Moderate debt levels and neutral current ratio
A. O. Smith Weaknesses
- WACC also slightly unfavorable compared to ROIC
- P/B ratio remains unfavorable, reflecting valuation concerns
- Less diversified product segmentation data available
- Exposure concentrated in two geographic segments
Both companies exhibit strengths in profitability and operational efficiency but face valuation and liquidity concerns. Rockwell’s broader product and geographic diversification contrasts with A. O. Smith’s stronger capital structure and margins, shaping distinct strategic priorities.
The Moat Duel: Analyzing Competitive Defensibility
A structural moat is the only barrier protecting long-term profits from relentless competition erosion. Let’s dissect the moat quality of two industrial machinery leaders:
Rockwell Automation, Inc.: Digital Integration Moat
Rockwell’s moat stems from its integrated automation and digital transformation solutions. This delivers high ROIC and margin stability. However, slower recent revenue growth challenges moat expansion in 2026.
A. O. Smith Corporation: Brand and Cost Efficiency Moat
A. O. Smith relies on strong brand recognition and cost-efficient manufacturing in water heating. Its higher ROIC versus Rockwell signals a wider moat, with steady profit growth supporting expansion into new global markets.
Verdict: Digital Transformation vs. Brand-Cost Leadership
While both firms maintain durable moats, A. O. Smith’s stronger ROIC and consistent profit growth reflect a wider moat. It is better positioned to defend market share amid evolving industrial demands.
Which stock offers better returns?
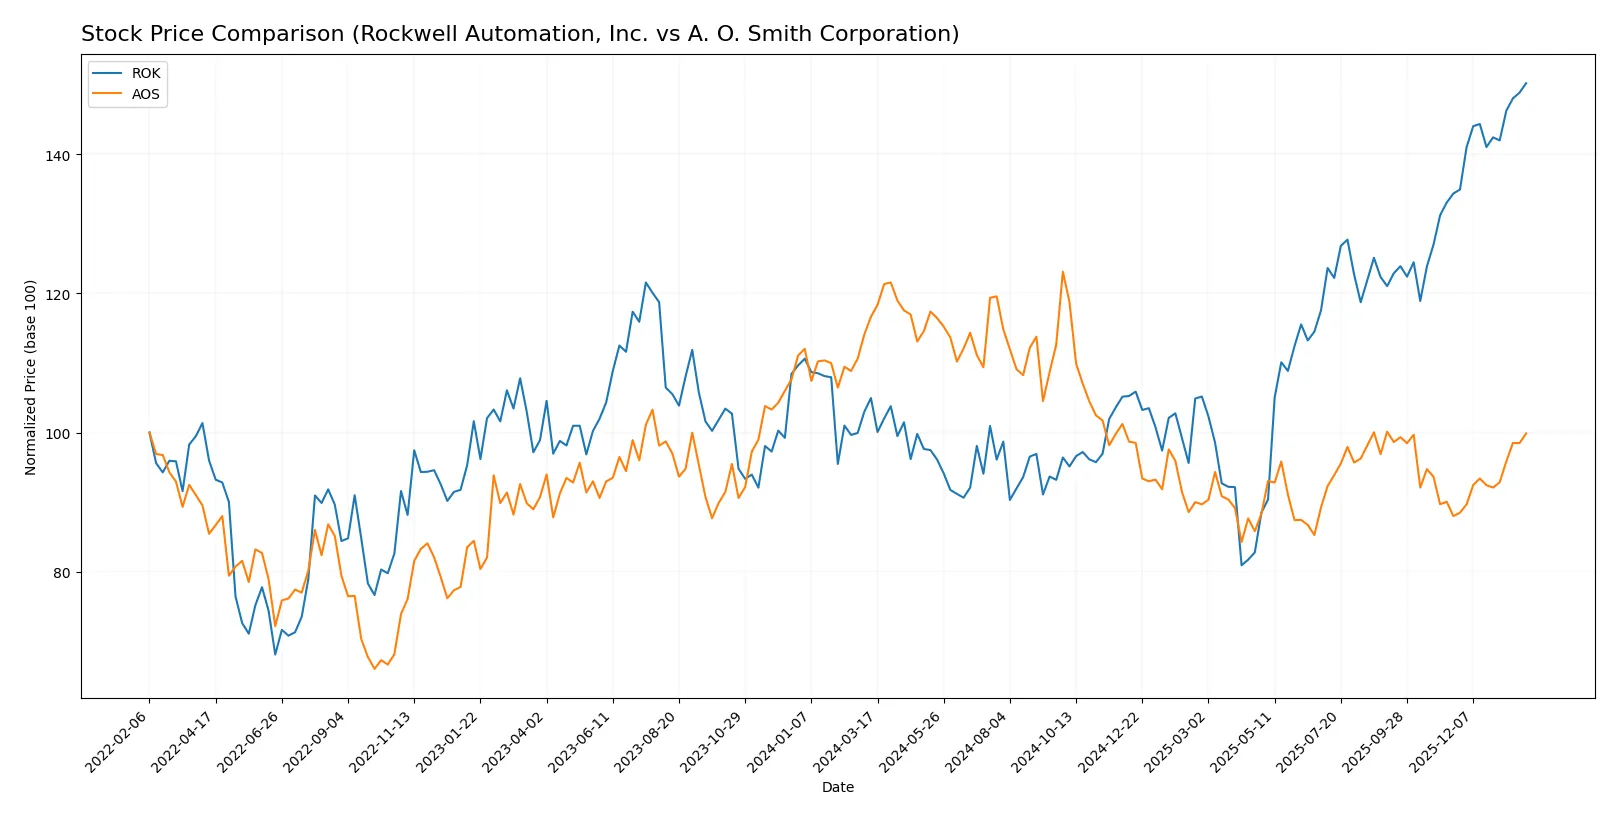
The past year showed divergent price movements: Rockwell Automation surged strongly, while A. O. Smith declined notably before a recent rebound phase.
Trend Comparison
Rockwell Automation’s stock gained 43.13% over 12 months, exhibiting a bullish trend with accelerating momentum and a high volatility level (std dev 48.69). The price hit a low of 227.11 and peaked at 421.65.
A. O. Smith’s stock fell 14.37% over the same period, marking a bearish trend despite acceleration. Volatility remained moderate (std dev 7.87), with prices ranging from 61.99 to 90.59.
Rockwell Automation outperformed A. O. Smith, delivering the highest market return and stronger price appreciation throughout the year.
Target Prices
Analysts present a clear consensus on target prices for Rockwell Automation and A. O. Smith Corporation.
| Company | Target Low | Target High | Consensus |
|---|---|---|---|
| Rockwell Automation, Inc. | 380 | 470 | 421.57 |
| A. O. Smith Corporation | 75 | 85 | 79 |
Rockwell Automation’s target consensus aligns closely with its current price of 421.65, indicating limited upside. A. O. Smith’s targets suggest moderate upside from its current 73.49 price level.

Don’t Let Luck Decide Your Entry Point
Optimize your entry points with our advanced ProRealTime indicators. You’ll get efficient buy signals with precise price targets for maximum performance. Start outperforming now!
How do institutions grade them?
The following tables summarize recent institutional grades for Rockwell Automation, Inc. and A. O. Smith Corporation:
Rockwell Automation, Inc. Grades
The table below shows recent grade updates and actions for Rockwell Automation, Inc.:
| Grading Company | Action | New Grade | Date |
|---|---|---|---|
| Oppenheimer | Downgrade | Perform | 2026-01-20 |
| JP Morgan | Maintain | Neutral | 2026-01-16 |
| Morgan Stanley | Maintain | Overweight | 2026-01-13 |
| Barclays | Maintain | Overweight | 2026-01-07 |
| Wells Fargo | Maintain | Equal Weight | 2026-01-07 |
| Goldman Sachs | Upgrade | Neutral | 2025-12-16 |
| Jefferies | Maintain | Buy | 2025-12-10 |
| Citigroup | Maintain | Buy | 2025-12-08 |
| Barclays | Maintain | Overweight | 2025-12-04 |
| Baird | Maintain | Outperform | 2025-11-21 |
A. O. Smith Corporation Grades
The table below shows recent grade updates and actions for A. O. Smith Corporation:
| Grading Company | Action | New Grade | Date |
|---|---|---|---|
| Stifel | Maintain | Buy | 2026-01-30 |
| Citigroup | Maintain | Neutral | 2026-01-30 |
| DA Davidson | Maintain | Neutral | 2025-11-13 |
| Stifel | Maintain | Buy | 2025-10-29 |
| Citigroup | Maintain | Neutral | 2025-10-29 |
| Oppenheimer | Maintain | Outperform | 2025-07-28 |
| UBS | Maintain | Neutral | 2025-07-28 |
| Baird | Maintain | Neutral | 2025-07-25 |
| Stifel | Maintain | Buy | 2025-07-25 |
| Stifel | Maintain | Buy | 2025-07-21 |
Which company has the best grades?
Rockwell Automation shows a mix of Buy, Overweight, and Outperform ratings, but recent downgrades signal caution. A. O. Smith maintains more consistent Buy and Neutral grades, suggesting steadier institutional confidence. Investors may interpret these nuances when assessing risk and opportunity.
Risks specific to each company
The following categories identify the critical pressure points and systemic threats facing both firms in the 2026 market environment:
1. Market & Competition
Rockwell Automation, Inc. (ROK)
- Faces intense competition in industrial automation with rapid tech evolution.
A. O. Smith Corporation (AOS)
- Competes in water heating and treatment markets with growing global demand but price pressures.
2. Capital Structure & Debt
Rockwell Automation, Inc. (ROK)
- Debt-to-equity ratio at 1.0 signals moderate leverage; interest coverage of 6.88 is adequate but warrants monitoring.
A. O. Smith Corporation (AOS)
- Low debt-to-equity at 0.09 with strong interest coverage (54.03) indicates a robust and conservative capital structure.
3. Stock Volatility
Rockwell Automation, Inc. (ROK)
- Beta of 1.516 suggests higher-than-market volatility, increasing risk during downturns.
A. O. Smith Corporation (AOS)
- Beta of 1.349 shows moderate volatility, somewhat less sensitive to market swings.
4. Regulatory & Legal
Rockwell Automation, Inc. (ROK)
- Operates globally with exposure to diverse regulatory environments in tech and industrial sectors.
A. O. Smith Corporation (AOS)
- Faces regulatory scrutiny in product safety and environmental standards across multiple international markets.
5. Supply Chain & Operations
Rockwell Automation, Inc. (ROK)
- Complex supply chain dependent on high-tech components susceptible to global disruptions.
A. O. Smith Corporation (AOS)
- Relies on manufacturing and distribution networks in key markets; operational risks mitigated by geographic diversification.
6. ESG & Climate Transition
Rockwell Automation, Inc. (ROK)
- Increasing pressure to innovate sustainable automation solutions; faces rising ESG compliance costs.
A. O. Smith Corporation (AOS)
- Benefits from growing demand for energy-efficient water heaters; ESG initiatives align with climate transition trends.
7. Geopolitical Exposure
Rockwell Automation, Inc. (ROK)
- Exposure to trade tensions and tariffs affecting key industrial markets, including Asia and Europe.
A. O. Smith Corporation (AOS)
- Geopolitical risks exist but lower debt and diversified markets reduce vulnerability.
Which company shows a better risk-adjusted profile?
A. O. Smith Corporation exhibits a stronger risk-adjusted profile than Rockwell Automation. Its low leverage, superior interest coverage, and lower stock volatility provide a more stable financial foundation. Rockwell Automation’s higher beta and moderate leverage introduce greater risk, despite favorable profitability metrics. The critical risk for Rockwell is its elevated financial leverage and valuation multiples, which could stress the balance sheet in a downturn. For A. O. Smith, geopolitical risks remain the main concern but are offset by prudent capital structure and operational diversification. Recent data shows Rockwell’s quick ratio at 0.77 flags liquidity pressure, reinforcing my caution.
Final Verdict: Which stock to choose?
Rockwell Automation’s superpower lies in its durable competitive advantage, evidenced by a very favorable moat and rising profitability. However, its premium valuation and weaker liquidity ratios remain points of vigilance. It fits well in aggressive growth portfolios that can tolerate valuation risk for potential long-term rewards.
A. O. Smith commands a strategic moat through efficient capital use and a robust safety profile, including low debt and strong cash flow yields. Its valuation is more reasonable than Rockwell’s, offering better stability. It suits GARP investors seeking steady growth with a margin of safety.
If you prioritize aggressive expansion and can navigate higher valuation risks, Rockwell Automation outshines with its durable moat and growth trajectory. However, if you seek a more stable investment with solid fundamentals and better risk-adjusted value, A. O. Smith offers superior financial health and a safer profile.
Disclaimer: Investment carries a risk of loss of initial capital. The past performance is not a reliable indicator of future results. Be sure to understand risks before making an investment decision.
Go Further
I encourage you to read the complete analyses of Rockwell Automation, Inc. and A. O. Smith Corporation to enhance your investment decisions: