Home > Comparison > Industrials > AOS vs PSN
The strategic rivalry between A. O. Smith Corporation and Parsons Corporation shapes the Industrials sector’s future. A. O. Smith leads as a capital-intensive machinery manufacturer in water heating and treatment, while Parsons excels in high-tech defense and infrastructure solutions. This head-to-head reflects a contrast between traditional industrial manufacturing and advanced integrated services. This analysis aims to identify which company’s trajectory offers superior risk-adjusted returns for a diversified portfolio.
Table of contents
Companies Overview
A. O. Smith Corporation and Parsons Corporation are vital players in the industrial machinery sector with distinct market roles.
A. O. Smith Corporation: Global Water Heating Leader
A. O. Smith dominates the water heating and treatment market across North America, China, Europe, and India. It generates revenue by selling residential and commercial water heaters, boilers, and filtration products. In 2026, the company focuses on expanding its e-commerce presence and strengthening brand penetration through wholesale and retail plumbing channels.
Parsons Corporation: Integrated Defense and Infrastructure Innovator
Parsons Corporation specializes in defense, intelligence, and critical infrastructure solutions. Its core revenue stems from cybersecurity, missile defense, geospatial intelligence, and infrastructure engineering services mainly for government contracts. The firm’s 2026 strategy emphasizes advancing technology services and intelligent transportation system management to broaden its public and private sector reach.
Strategic Collision: Similarities & Divergences
Both companies operate in industrial machinery but serve vastly different markets: A. O. Smith pursues a product-driven approach in water solutions, while Parsons delivers service-based, technology-intensive defense and infrastructure projects. Their battleground lies in government and commercial infrastructure sectors, where innovation and contract acquisition matter most. Investors will find A. O. Smith’s stable consumer product moat contrasts sharply with Parsons’ complex, high-tech government dependency.
Income Statement Comparison
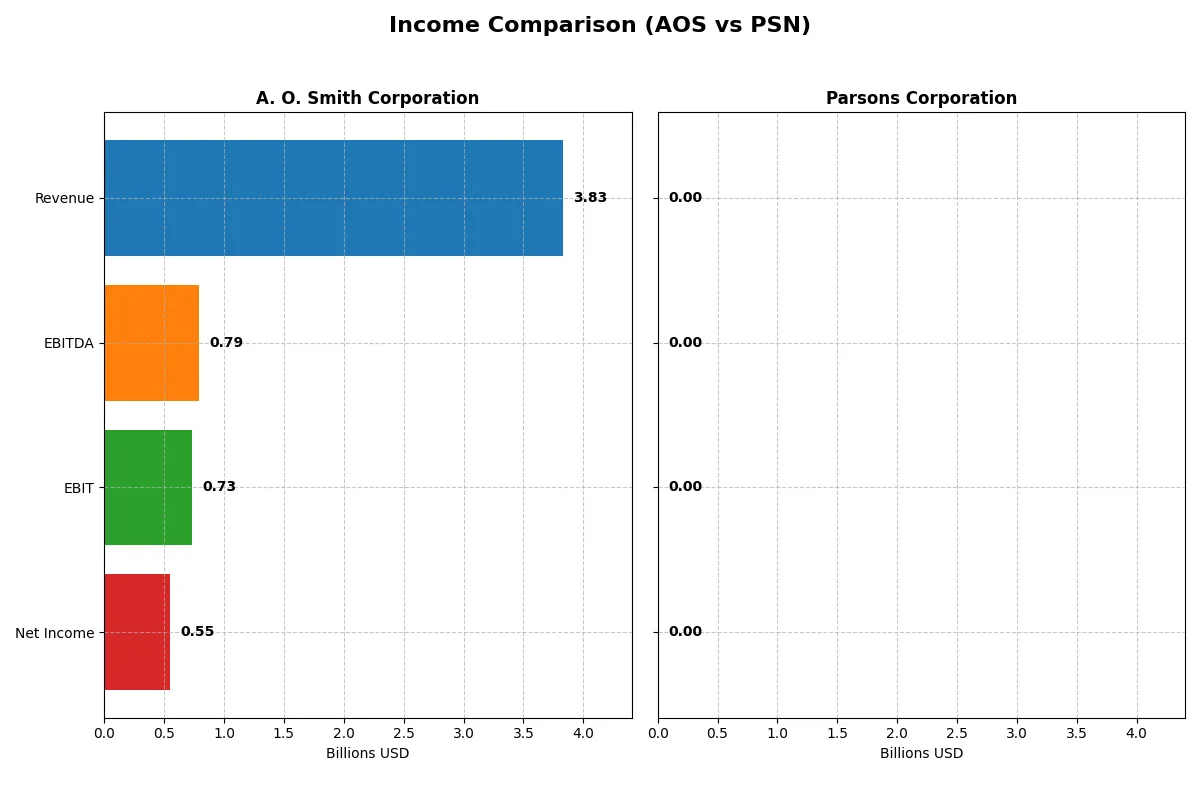
This data dissects the core profitability and scalability of both corporate engines to reveal who dominates the bottom line:
| Metric | A. O. Smith Corporation (AOS) | Parsons Corporation (PSN) |
|---|---|---|
| Revenue | 3.83B | 100K |
| Cost of Revenue | 2.34B | 0 |
| Operating Expenses | 759M | 16K |
| Gross Profit | 1.49B | 0 |
| EBITDA | 792M | 6.6K |
| EBIT | 729M | 0 |
| Interest Expense | 13.5M | -800 |
| Net Income | 546M | 3.8K |
| EPS | 3.86 | 0 |
| Fiscal Year | 2025 | 2025 |
Income Statement Analysis: The Bottom-Line Duel
This income statement comparison reveals which company operates its business more efficiently and drives stronger profitability.
A. O. Smith Corporation Analysis
AOS steadily grows revenue, reaching $3.83B in 2025 with net income at $546M. Its gross margin remains healthy near 39%, and net margin holds firm at 14.3%. Efficiency gains emerge as EBIT margin improves to 19%, supported by disciplined interest expense control at 0.35% of revenue. Momentum in EPS growth of 6.3% over one year underscores operational strength.
Parsons Corporation Analysis
PSN’s 2025 revenue plunges to $100K from over $6.75B in 2024, signaling a sharp disruption. Gross and EBIT margins collapse to zero, while net margin dips to a modest 3.8%. This volatility erodes top-line scale and profitability, despite a favorable interest expense ratio of -0.8%. Net income falls drastically to $3.8K, indicating severe operational challenges and loss of momentum.
Margin Resilience vs. Revenue Collapse
AOS clearly outperforms PSN with consistent revenue growth, robust margins, and solid net income expansion. PSN’s dramatic revenue and profit contraction in 2025 leaves it fundamentally weaker. For investors, AOS offers a stable, efficient earnings profile, while PSN’s profile reflects heightened risk and operational instability.
Financial Ratios Comparison
These vital ratios act as a diagnostic tool to expose the underlying fiscal health, valuation premiums, and capital efficiency of these two companies:
| Ratios | A. O. Smith Corporation (AOS) | Parsons Corporation (PSN) |
|---|---|---|
| ROE | 29.40% | 0.0001% |
| ROIC | 23.94% | 0.00015% |
| P/E | 17.13 | 0 |
| P/B | 5.04 | 0 |
| Current Ratio | 1.50 | 1.75 |
| Quick Ratio | 0.94 | 1.75 |
| D/E | 0.10 | 0.52 |
| Debt-to-Assets | 6.11% | 23.87% |
| Interest Coverage | 53.93 | -8.25 |
| Asset Turnover | 1.22 | 0.00002 |
| Fixed Asset Turnover | 5.62 | 0.00036 |
| Payout ratio | 35.83% | 0% |
| Dividend yield | 2.09% | 0% |
| Fiscal Year | 2025 | 2025 |
Efficiency & Valuation Duel: The Vital Signs
Financial ratios act as a company’s DNA, exposing hidden risks and operational strengths critical for investment insight.
A. O. Smith Corporation
AOS displays robust profitability with a 29.4% ROE and a strong 14.26% net margin, signaling operational efficiency. Its P/E ratio at 17.13 suggests a fairly valued stock, though a 5.04 PB ratio flags premium asset pricing. The company rewards shareholders with a 2.09% dividend yield, underscoring steady cash returns.
Parsons Corporation
PSN struggles with profitability, showing virtually zero ROE and ROIC, reflecting weak returns. Despite a low P/E and PB ratio, these stem from negligible earnings and asset values, not undervaluation. The firm pays no dividends, and its operational metrics reveal considerable inefficiencies and risks, marked by a negative interest coverage ratio.
Premium Valuation vs. Operational Safety
AOS balances attractive profitability and reasonable valuation, supporting shareholder returns through dividends. PSN’s metrics expose operational struggles and lack of shareholder rewards, despite low valuation multiples. Investors seeking stability may prefer AOS, while PSN’s profile suits those tolerating higher risk for potential turnaround.
Which one offers the Superior Shareholder Reward?
I see A. O. Smith Corporation (AOS) pays a steady dividend with a 2.1% yield and a 36% payout ratio, supported by strong free cash flow coverage (88.5%). Its buyback program is moderate but consistent. Parsons Corporation (PSN) pays no dividend, reinvesting aggressively in growth. PSN’s free cash flow fully covers operating cash flow, but its operating cash flow ratio is weak (31%). AOS’s balanced dividend and buybacks provide a more sustainable and attractive total return in 2026, especially given PSN’s higher leverage and lack of direct shareholder distributions. I favor AOS for superior shareholder reward.
Comparative Score Analysis: The Strategic Profile
The radar chart reveals the fundamental DNA and trade-offs of A. O. Smith Corporation and Parsons Corporation, highlighting their core financial strengths and weaknesses:
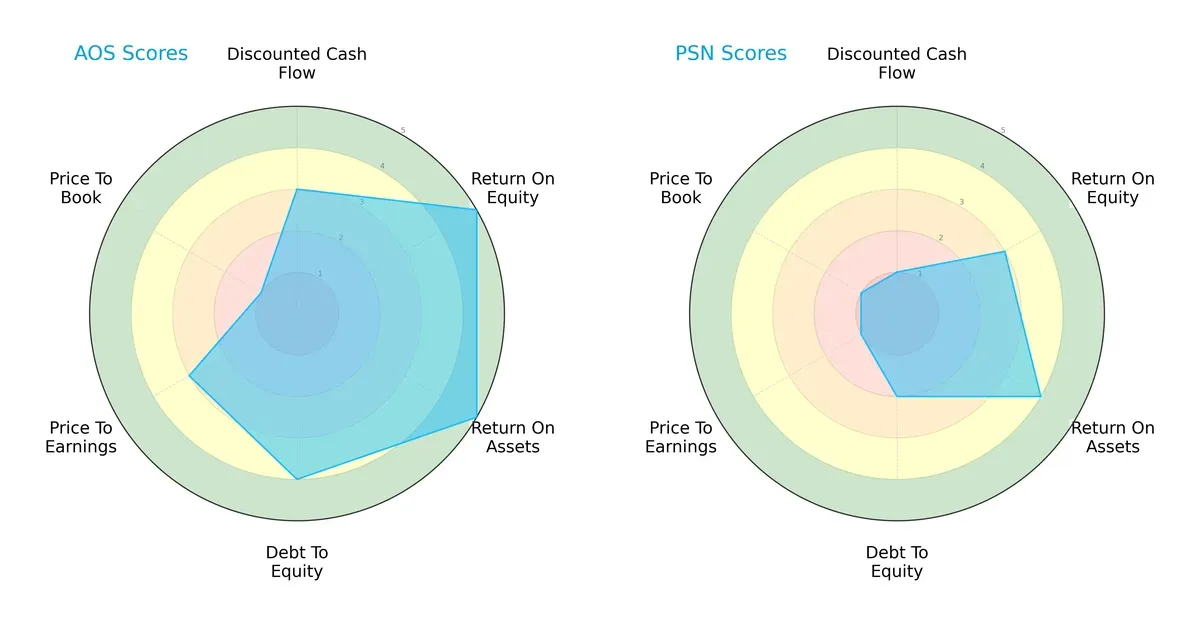
A. O. Smith displays a more balanced profile with strong ROE (5) and ROA (5) scores, supported by moderate DCF (3) and debt-to-equity (4) metrics. Parsons leans on asset efficiency (ROA 4) but suffers from weak DCF (1) and debt-to-equity (2) scores. AOS’s advantage in profitability and leverage management stands out, while PSN relies more on operational efficiency but faces valuation and leverage challenges.
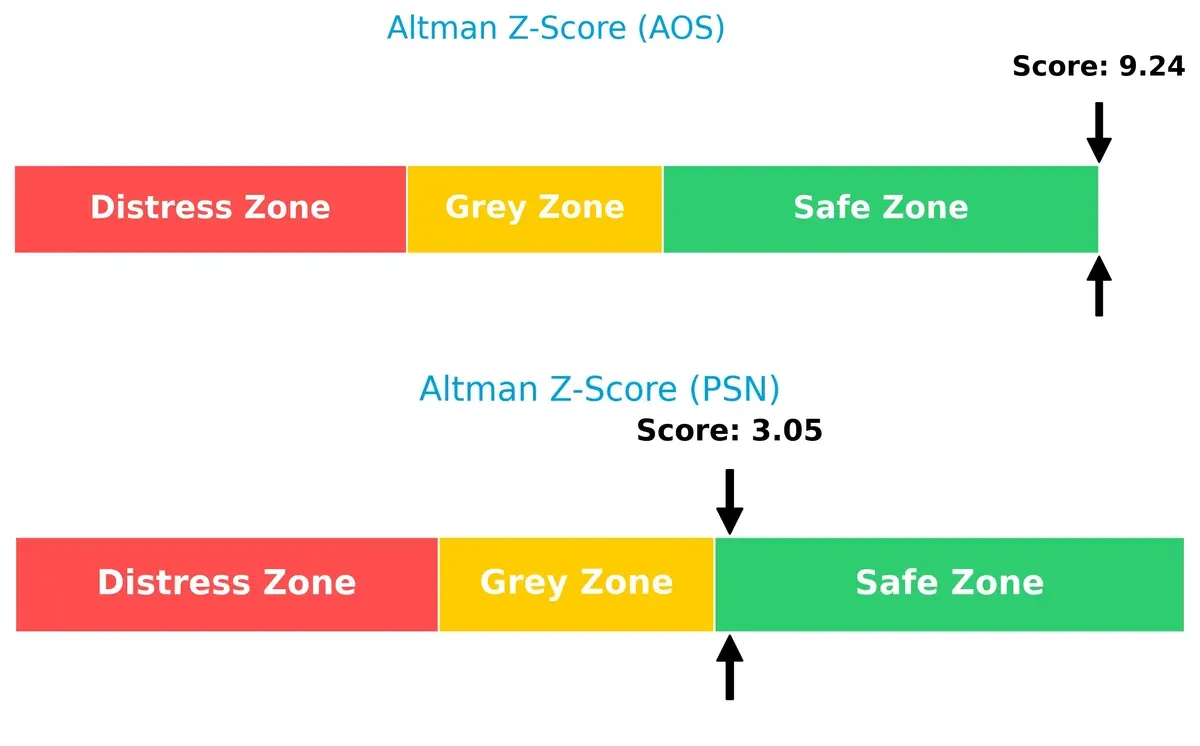
Bankruptcy Risk: Solvency Showdown
A. O. Smith’s Altman Z-Score of 9.24 significantly exceeds Parsons’ 3.05, indicating far stronger long-term solvency and lower bankruptcy risk in this cycle:
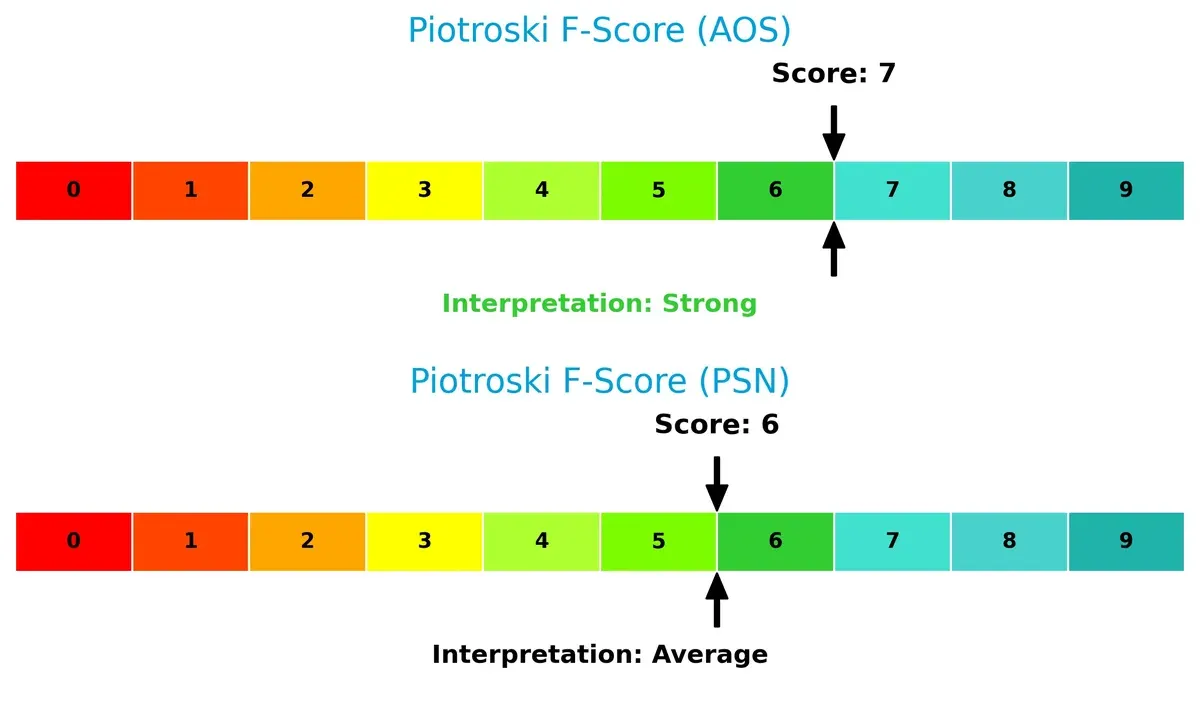
Financial Health: Quality of Operations
A. O. Smith’s Piotroski F-Score of 7 signals robust financial health, outperforming Parsons’ moderate score of 6. This suggests AOS maintains stronger internal metrics and fewer red flags:
How are the two companies positioned?
This section dissects AOS and PSN’s operational DNA by comparing revenue distribution and internal dynamics. The goal is to confront their economic moats and identify the more resilient competitive advantage today.
Revenue Segmentation: The Strategic Mix
This comparison dissects how A. O. Smith Corporation and Parsons Corporation diversify their income streams and highlights their primary sector bets for strategic insight:
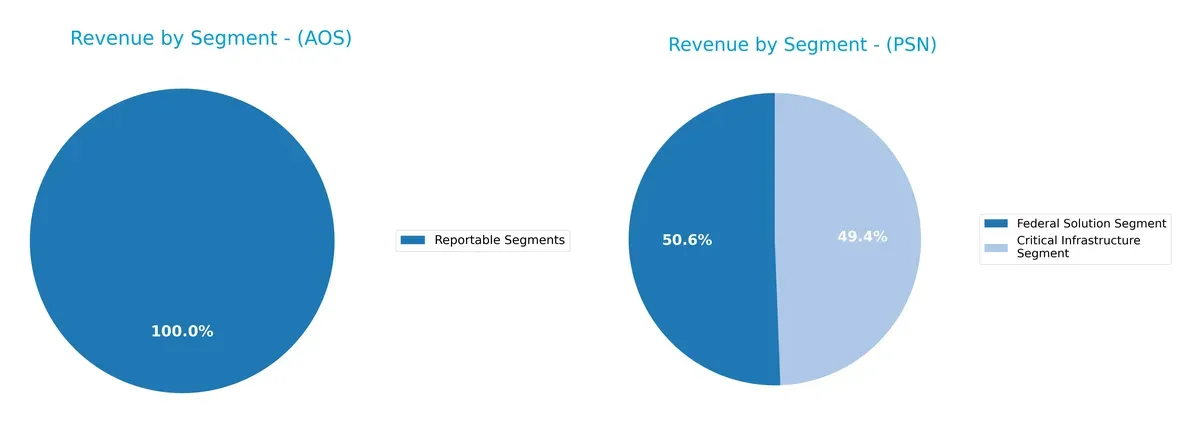
A. O. Smith generates $3.83B solely from one consolidated segment, showing high revenue concentration. Parsons splits $3.22B in Federal Solutions and $3.14B in Critical Infrastructure, revealing a balanced diversification. Parsons’ dual-segment approach reduces concentration risk and supports resilience in infrastructure and government markets. A. O. Smith’s reliance on a single segment signals potential vulnerability but also focus and specialization in its core market.
Strengths and Weaknesses Comparison
This table compares the Strengths and Weaknesses of A. O. Smith Corporation and Parsons Corporation:
AOS Strengths
- Strong profitability with 14.26% net margin and 29.4% ROE
- Low debt levels with 0.1 debt-to-equity and 6.11% debt-to-assets
- High asset turnover at 1.22 and fixed asset turnover at 5.62
- Solid dividend yield of 2.09%
- Diverse geographic revenue with $2.62B North America and $1.21B Rest of World
PSN Strengths
- Favorable liquidity ratios with current and quick ratios at 1.75
- Low debt-to-assets at 23.87%
- Significant North America revenue of $5.18B and Middle East exposure at $1.16B
- Favorable WACC at 2.19% indicating low capital costs
AOS Weaknesses
- High price-to-book ratio at 5.04 signals possible overvaluation
- Neutral current and quick ratios (1.5 and 0.94) suggest moderate liquidity
- Neutral WACC at 9.88% implies average capital costs
PSN Weaknesses
- Weak profitability with 3.8% net margin and 0% ROE and ROIC
- Negative interest coverage signals financial distress risk
- Zero dividend yield and unfavorable asset turnovers
- High proportion of unfavorable financial ratios (50%)
AOS exhibits strong profitability and disciplined capital structure but faces valuation concerns. PSN shows solid liquidity and geographical reach but struggles with profitability and financial health. These contrasts highlight different strategic challenges and operational focuses.
The Moat Duel: Analyzing Competitive Defensibility
A structural moat is the only thing protecting long-term profits from relentless competitive erosion. Here’s how A. O. Smith and Parsons stack up:
A. O. Smith Corporation: Durable Cost Advantage
A. O. Smith’s moat stems from efficient manufacturing and scale in water heating technologies. Its 14%+ ROIC exceeds WACC by a wide margin, reflecting a strong cost advantage. In 2026, expanding global water treatment and energy-efficient products could deepen this moat.
Parsons Corporation: Specialized Federal Contract Expertise
Parsons leverages deep federal defense and infrastructure relationships, a moat built on intangible assets and specialized knowledge. Unlike A. O. Smith, Parsons shows declining ROIC and value destruction, signaling weakening competitive strength. New cybersecurity contracts may offer growth but remain uncertain.
Cost Leadership vs. Contractual Intangibles: The Moat Verdict
A. O. Smith’s widening cost-based moat outperforms Parsons’ shrinking intangible asset moat. Only A. O. Smith demonstrates sustainable value creation and robust profit defense. It remains better equipped to guard market share as competitive pressures intensify in 2026.
Which stock offers better returns?
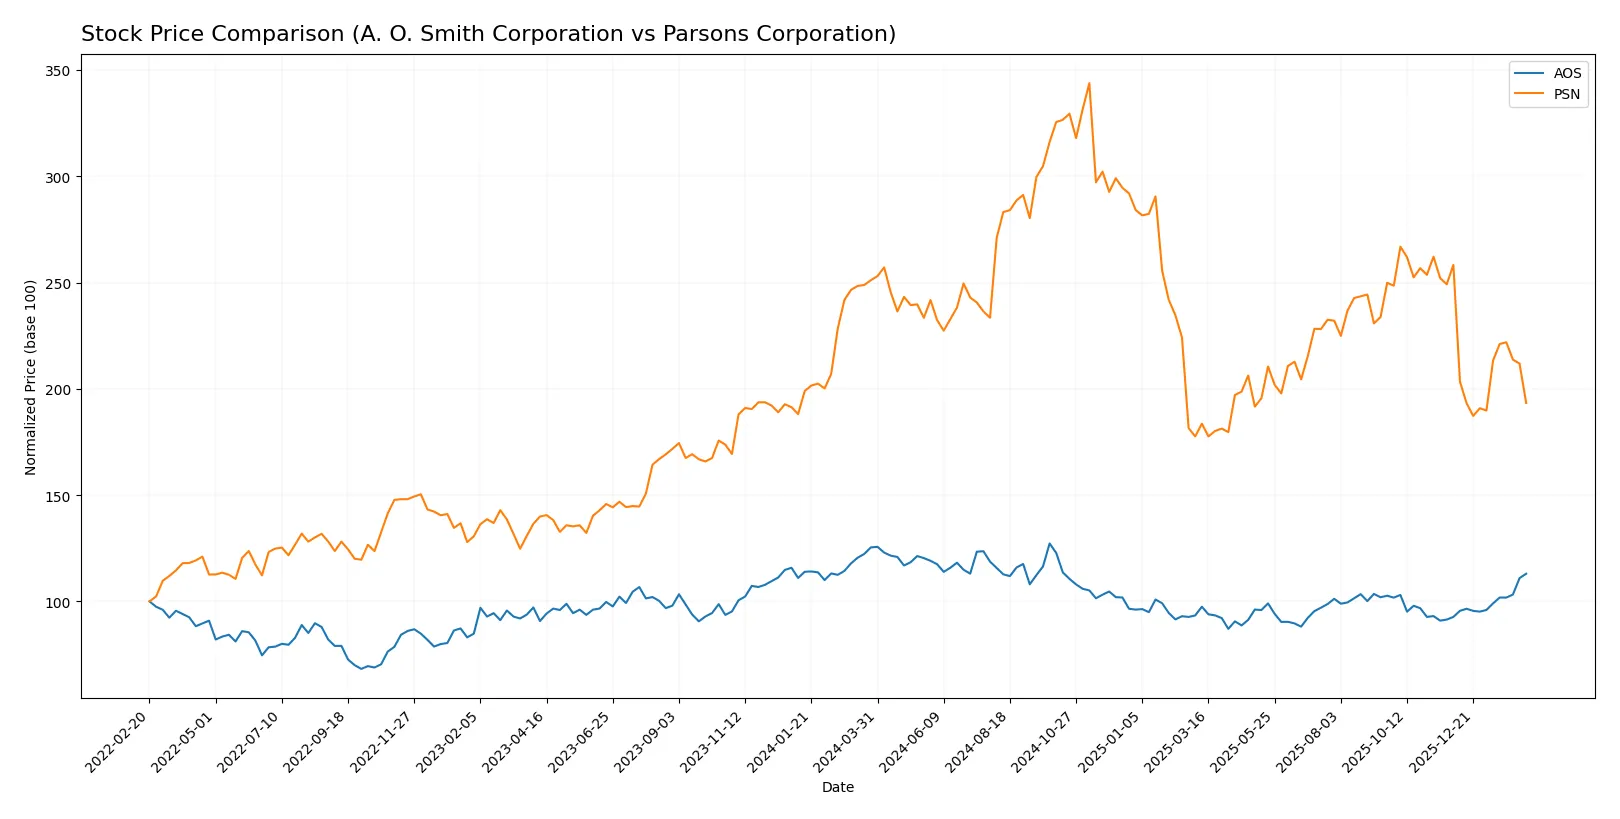
Over the past 12 months, A. O. Smith Corporation and Parsons Corporation have shown divergent price trajectories with contrasting recent trading dynamics.
Trend Comparison
A. O. Smith Corporation’s stock declined by 9.88% over the past year, marking a bearish trend with accelerating price movements and a 7.71 volatility measure. It hit a high of 90.59 and a low of 61.99.
Parsons Corporation’s stock fell 23% in the same period, also bearish but with decelerating declines. Its volatility was higher at 13.2, with a peak price of 112.69 and a trough at 58.22.
Comparing both, A. O. Smith posted a less severe loss and showed a recent strong rebound, outperforming Parsons in overall market performance.
Target Prices
Analysts present a bullish consensus for both A. O. Smith Corporation and Parsons Corporation, with targets above current market prices.
| Company | Target Low | Target High | Consensus |
|---|---|---|---|
| A. O. Smith Corporation | 69 | 85 | 76.2 |
| Parsons Corporation | 78 | 104 | 86.8 |
The consensus target for AOS at 76.2 suggests a slight downside from its current 80.46 price, while PSN’s 86.8 target implies significant upside from 63.38. Analysts expect stronger growth potential in Parsons.

Don’t Let Luck Decide Your Entry Point
Optimize your entry points with our advanced ProRealTime indicators. You’ll get efficient buy signals with precise price targets for maximum performance. Start outperforming now!
How do institutions grade them?
A. O. Smith Corporation Grades
The following table summarizes recent grades from major grading companies for A. O. Smith Corporation:
| Grading Company | Action | New Grade | Date |
|---|---|---|---|
| DA Davidson | Maintain | Neutral | 2026-02-02 |
| Stifel | Maintain | Buy | 2026-01-30 |
| Citigroup | Maintain | Neutral | 2026-01-30 |
| DA Davidson | Maintain | Neutral | 2025-11-13 |
| Citigroup | Maintain | Neutral | 2025-10-29 |
| Stifel | Maintain | Buy | 2025-10-29 |
| UBS | Maintain | Neutral | 2025-07-28 |
| Oppenheimer | Maintain | Outperform | 2025-07-28 |
| Stifel | Maintain | Buy | 2025-07-25 |
| Baird | Maintain | Neutral | 2025-07-25 |
Parsons Corporation Grades
The following table summarizes recent grades from major grading companies for Parsons Corporation:
| Grading Company | Action | New Grade | Date |
|---|---|---|---|
| UBS | Maintain | Buy | 2026-02-12 |
| Truist Securities | Maintain | Buy | 2026-02-12 |
| Keybanc | Maintain | Overweight | 2026-02-12 |
| Barclays | Maintain | Overweight | 2026-01-23 |
| Keybanc | Maintain | Overweight | 2026-01-20 |
| UBS | Maintain | Buy | 2026-01-15 |
| Citigroup | Maintain | Buy | 2026-01-13 |
| B of A Securities | Maintain | Buy | 2025-12-30 |
| Stifel | Maintain | Buy | 2025-12-23 |
| Jefferies | Maintain | Hold | 2025-12-11 |
Which company has the best grades?
Parsons Corporation consistently receives Buy and Overweight ratings from multiple top-tier firms. A. O. Smith shows a mixed profile of Neutral and Buy grades, with fewer strong Buy endorsements. Parsons’ stronger grades may attract investors seeking more confident analyst support.
Risks specific to each company
The following categories highlight the critical pressure points and systemic threats facing A. O. Smith Corporation and Parsons Corporation in the 2026 market environment:
1. Market & Competition
A. O. Smith Corporation
- Strong brand presence in water heaters and treatment with global reach. Faces competition from energy-efficient product innovators.
Parsons Corporation
- Focuses on defense and critical infrastructure with niche capabilities. Faces fierce competition in cybersecurity and government contracts.
2. Capital Structure & Debt
A. O. Smith Corporation
- Low debt-to-equity ratio at 0.1 indicates conservative leverage and strong financial stability.
Parsons Corporation
- Higher debt-to-equity at 0.52 raises financial risk; interest coverage is negative, signaling distress.
3. Stock Volatility
A. O. Smith Corporation
- Beta of 1.34 suggests above-market volatility, reflecting sensitivity to industrial sector cycles.
Parsons Corporation
- Beta of 0.67 indicates lower volatility, possibly due to government contracts providing revenue stability.
4. Regulatory & Legal
A. O. Smith Corporation
- Subject to environmental and product safety regulations globally, especially in water treatment.
Parsons Corporation
- Faces strict defense contracting regulations and cybersecurity compliance risks, increasing legal scrutiny.
5. Supply Chain & Operations
A. O. Smith Corporation
- Diverse supply chain across multiple continents; vulnerable to raw material cost swings and geopolitical disruptions.
Parsons Corporation
- Complex project-based operations with risks in program delays and cost overruns, especially in defense contracts.
6. ESG & Climate Transition
A. O. Smith Corporation
- Exposure to climate trends with demand for energy-efficient water solutions; ESG commitments critical for brand reputation.
Parsons Corporation
- Increasing ESG pressure in defense and infrastructure sectors; must balance sustainability with operational demands.
7. Geopolitical Exposure
A. O. Smith Corporation
- Operations in China and India expose it to geopolitical tensions and trade policy risks.
Parsons Corporation
- Heavy reliance on U.S. government contracts limits geopolitical revenue diversification but reduces market risk abroad.
Which company shows a better risk-adjusted profile?
A. O. Smith’s most impactful risk is its market volatility and exposure to global supply chain disruptions. Parsons faces critical risks from its elevated leverage and negative interest coverage, threatening financial stability. A. O. Smith exhibits a stronger risk-adjusted profile, supported by its safe-zone Altman Z-Score (9.24) and favorable profitability metrics. Parsons’ weaker profitability and moderate Piotroski score reflect operational and financial challenges, justifying investor caution.
Final Verdict: Which stock to choose?
A. O. Smith Corporation’s superpower lies in its efficient capital allocation and growing profitability, consistently delivering strong returns above its cost of capital. Its point of vigilance is a relatively high price-to-book ratio, suggesting market premium. This stock suits an aggressive growth portfolio focused on durable value creation.
Parsons Corporation’s strategic moat is its niche positioning in infrastructure and defense sectors, offering recurring project-based revenue. It provides a safer balance sheet with favorable liquidity ratios but struggles with profitability and value erosion. It fits a GARP (Growth at a Reasonable Price) portfolio that tolerates volatility for potential turnaround gains.
If you prioritize sustainable value creation and robust profitability, A. O. Smith outshines due to its strong economic moat and improving returns. However, if you seek exposure to infrastructure growth with a tolerance for risk, Parsons offers better stability in liquidity but commands caution given its declining profitability and value destruction.
Disclaimer: Investment carries a risk of loss of initial capital. The past performance is not a reliable indicator of future results. Be sure to understand risks before making an investment decision.
Go Further
I encourage you to read the complete analyses of A. O. Smith Corporation and Parsons Corporation to enhance your investment decisions: