Home > Comparison > Industrials > OTIS vs AOS
The strategic rivalry between Otis Worldwide Corporation and A. O. Smith Corporation shapes the Industrials sector’s machinery landscape. Otis excels as a capital-intensive industrial giant, focusing on elevators and escalators with a vast service network. In contrast, A. O. Smith operates as a diversified manufacturer of water heaters and treatment products, blending residential and commercial markets. This analysis aims to identify which model offers superior risk-adjusted returns for a diversified portfolio.
Table of contents
Companies Overview
Otis Worldwide Corporation and A. O. Smith Corporation both hold crucial roles in industrial machinery, each dominating distinct niches with significant market footprints.
Otis Worldwide Corporation: Global Elevator and Escalator Leader
Otis commands the global elevator and escalator market by designing, manufacturing, and servicing vertical transportation systems. Its revenue hinges on new equipment sales and a vast service network with 34,000 mechanics supporting ongoing maintenance and modernization. In 2026, Otis sharpens its focus on expanding service operations internationally to sustain long-term recurring revenue.
A. O. Smith Corporation: Premier Water Heating Innovator
A. O. Smith excels in manufacturing residential and commercial water heaters, boilers, and water treatment systems. The company leverages strong brand portfolios and diversified distribution channels across North America, China, and Europe. Its 2026 strategy prioritizes enhancing product innovation and expanding e-commerce sales to capture evolving consumer and commercial demands.
Strategic Collision: Similarities & Divergences
Both firms target essential infrastructure sectors but diverge in their business models: Otis relies on a service-heavy, recurring revenue approach, while A. O. Smith emphasizes product innovation and direct-to-consumer sales. Their competition centers on infrastructure modernization and energy efficiency solutions. Otis offers steady service cash flow, whereas A. O. Smith presents growth through product diversification and emerging markets exposure.
Income Statement Comparison
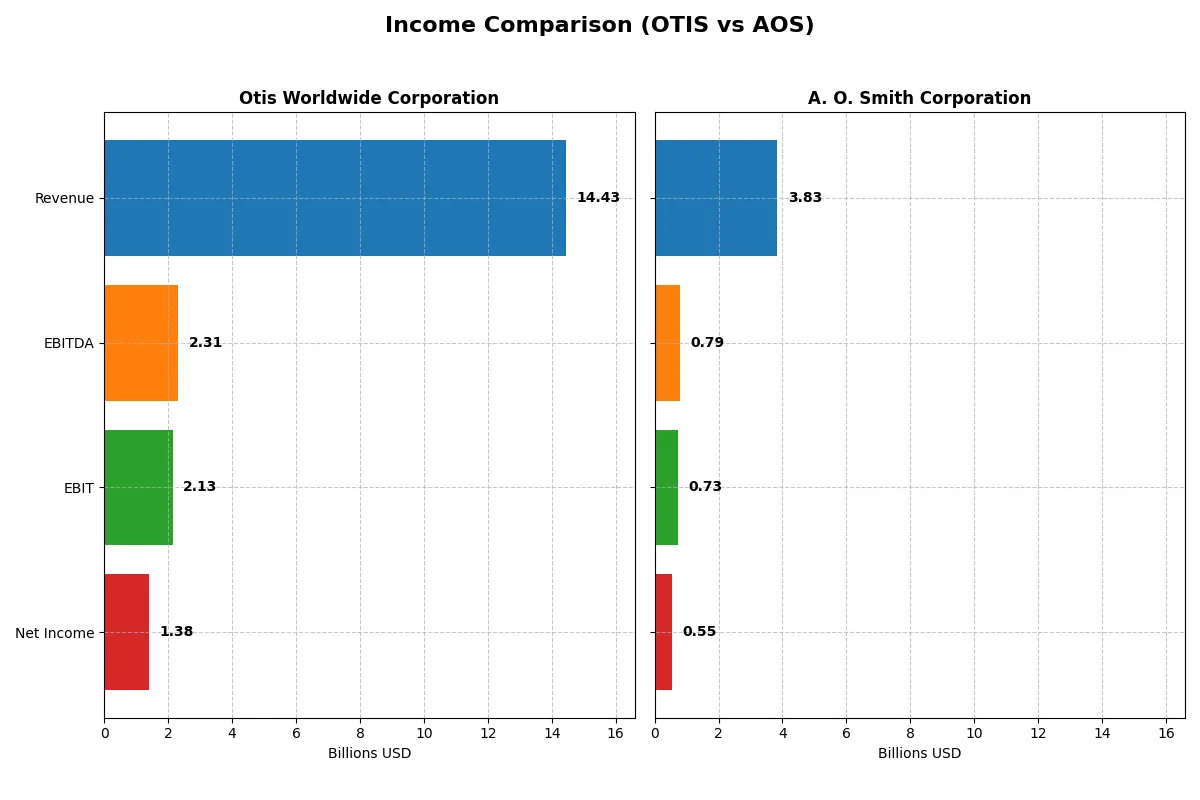
This data dissects the core profitability and scalability of both corporate engines to reveal who dominates the bottom line:
| Metric | Otis Worldwide Corporation (OTIS) | A. O. Smith Corporation (AOS) |
|---|---|---|
| Revenue | 14.43B | 3.83B |
| Cost of Revenue | 10.06B | 2.34B |
| Operating Expenses | 2.24B | 759.4M |
| Gross Profit | 4.37B | 1.49B |
| EBITDA | 2.31B | 792.2M |
| EBIT | 2.13B | 729.4M |
| Interest Expense | 196M | 13.5M |
| Net Income | 1.38B | 546.2M |
| EPS | 3.53 | 3.86 |
| Fiscal Year | 2025 | 2025 |
Income Statement Analysis: The Bottom-Line Duel
The following income statement comparison reveals which company converts revenue into profit more effectively and sustains operational momentum.
Otis Worldwide Corporation Analysis
Otis’s revenue grew modestly from $14.29B in 2021 to $14.43B in 2025, with net income rising from $1.25B to $1.38B over the same period. Its gross margin remains stable around 30%, while net margin hovers near 9.6%, indicating consistent profitability. However, net income dipped 16.9% in 2025, reflecting recent margin pressure despite solid operating efficiency.
A. O. Smith Corporation Analysis
A. O. Smith’s revenue expanded steadily from $3.54B in 2021 to $3.83B in 2025, alongside net income growth from $487M to $546M. The company boasts a stronger gross margin at nearly 39% and a net margin above 14%, highlighting robust cost control. Earnings per share improved by 6.3% in 2025, underscoring accelerating profitability and operational leverage.
Margin Strength vs. Growth Consistency
Otis delivers scale with stable margins but faces recent margin contraction, signaling potential efficiency challenges. A. O. Smith, while smaller, maintains superior margins and steady EPS growth, showing stronger profitability momentum. For investors, A. O. Smith’s profile suggests a more attractive blend of margin health and earnings growth in the current cycle.
Financial Ratios Comparison
These vital ratios act as a diagnostic tool to expose the underlying fiscal health, valuation premiums, and capital efficiency for the companies compared below:
| Ratios | Otis Worldwide Corporation (OTIS) | A. O. Smith Corporation (AOS) |
|---|---|---|
| ROE | -25.7% | 29.4% |
| ROIC | 40.7% | 23.9% |
| P/E | 24.8 | 17.1 |
| P/B | -6.38 | 5.04 |
| Current Ratio | 0.85 | 1.50 |
| Quick Ratio | 0.77 | 0.94 |
| D/E (Debt-to-Equity) | -1.62 | 0.12 |
| Debt-to-Assets | 82.1% | 7.3% |
| Interest Coverage | 11.2 | 53.9 |
| Asset Turnover | 1.35 | 1.22 |
| Fixed Asset Turnover | 11.13 | 5.62 |
| Payout ratio | 46.7% | 35.8% |
| Dividend yield | 1.88% | 2.09% |
| Fiscal Year | 2025 | 2025 |
Efficiency & Valuation Duel: The Vital Signs
Ratios act as a company’s DNA, revealing hidden risks and operational excellence critical to evaluating investment quality.
Otis Worldwide Corporation
Otis shows a mixed profitability profile with a negative ROE at -25.7% but a robust ROIC of 40.7%, signaling efficient capital use. The valuation appears neutral with a P/E of 24.85 and a modest dividend yield of 1.88%. However, a low current ratio of 0.85 raises liquidity concerns amid solid shareholder returns.
A. O. Smith Corporation
A. O. Smith posts strong profitability with a 29.4% ROE and a solid 14.3% net margin. The stock trades at a reasonable P/E of 17.13, reflecting fair value. It offers a higher dividend yield of 2.09% and maintains favorable liquidity with a current ratio of 1.5, supporting operational stability and shareholder rewards.
Balanced Risk vs. Robust Profitability
Otis delivers exceptional capital efficiency but struggles with profitability and liquidity, indicating operational risks. A. O. Smith combines strong profitability, sound liquidity, and a reasonable valuation, presenting a more balanced risk-reward profile. Investors seeking stability and income may favor A. O. Smith’s steady operational and financial metrics.
Which one offers the Superior Shareholder Reward?
I observe that Otis offers a modest 1.88% dividend yield with a 47% payout ratio, backed by strong free cash flow coverage near 90%. Otis also pursues steady buybacks, balancing income and capital return. A. O. Smith yields slightly higher at 2.09%, with a lower payout ratio around 36%, indicating room for reinvestment. A. O. Smith’s robust operating margins and conservative leverage support consistent buybacks enhancing total returns. I find A. O. Smith’s distribution strategy more sustainable and superior for long-term shareholder value in 2026.
Comparative Score Analysis: The Strategic Profile
The radar chart reveals the fundamental DNA and trade-offs of Otis Worldwide Corporation and A. O. Smith Corporation, highlighting their distinct financial strengths and vulnerabilities:
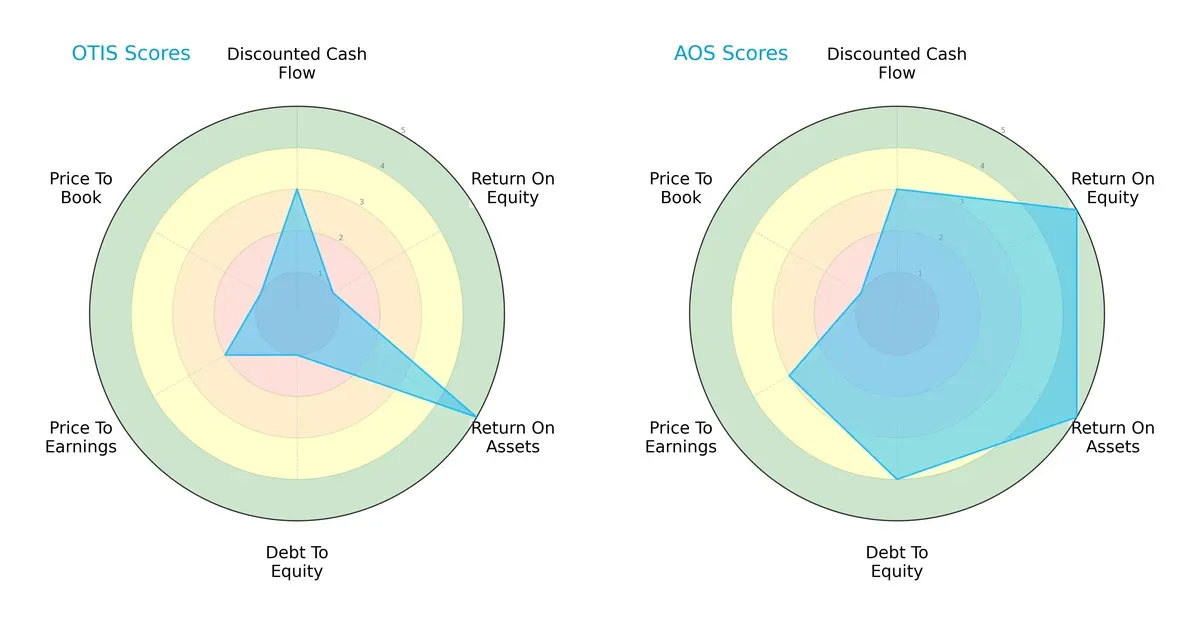
Otis shows strength in asset utilization (ROA 5) but struggles with equity returns (ROE 1) and financial leverage (Debt/Equity 1), signaling balance sheet stress. A. O. Smith delivers a more balanced profile with excellent ROE (5), solid asset efficiency (5), and healthier leverage (4). Otis relies heavily on asset productivity, while A. O. Smith leverages diversified strengths for stability.
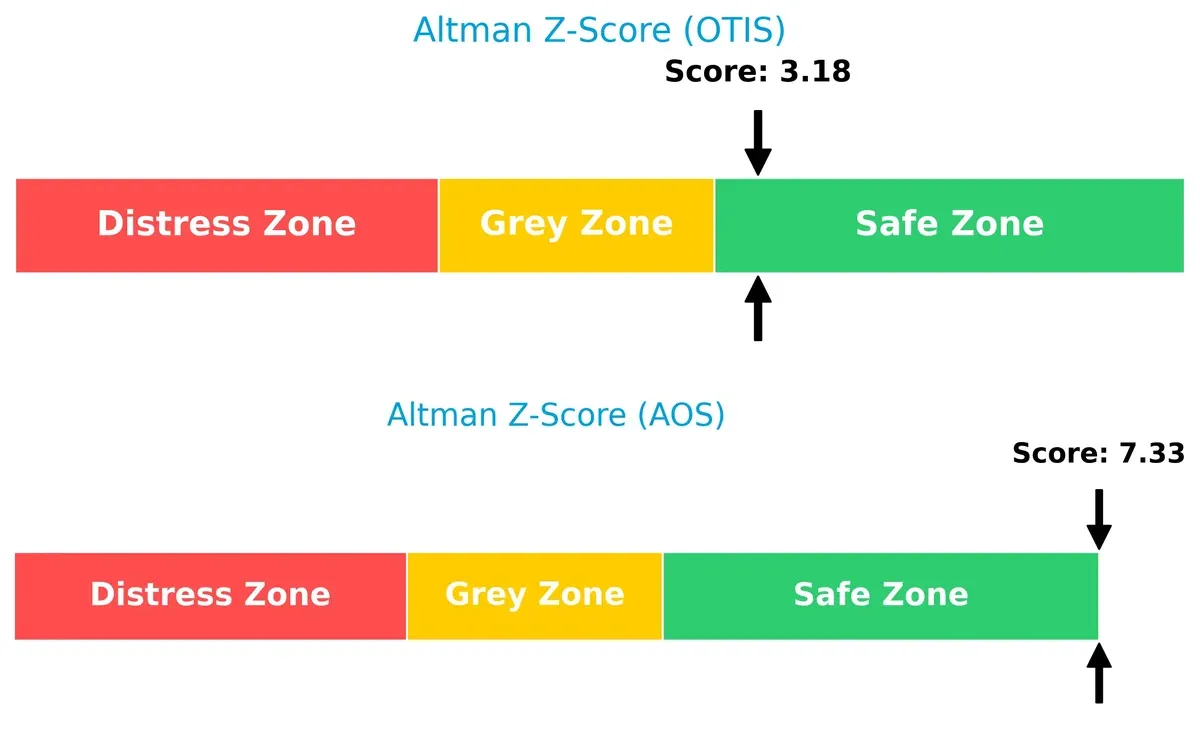
Bankruptcy Risk: Solvency Showdown
The Altman Z-Score gap favors A. O. Smith (7.33) over Otis (3.18), indicating superior financial resilience and lower bankruptcy risk for A. O. Smith in this market cycle:
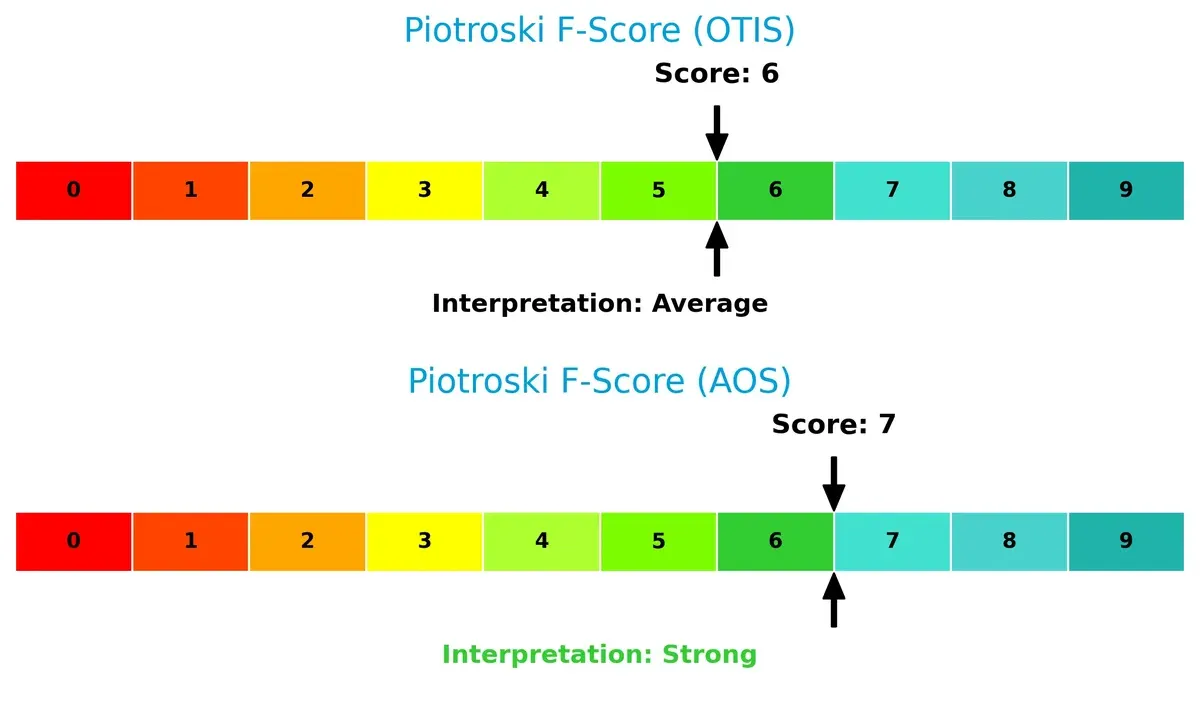
Financial Health: Quality of Operations
A. O. Smith’s Piotroski F-Score of 7 outperforms Otis’s 6, reflecting stronger operational quality and fewer internal red flags for A. O. Smith in profitability, liquidity, and efficiency metrics:
How are the two companies positioned?
This section dissects the operational DNA of Otis and A. O. Smith by comparing revenue distribution by segment and analyzing their strengths and weaknesses. The goal is to confront their economic moats and reveal which model offers the most resilient competitive advantage today.
Revenue Segmentation: The Strategic Mix
This visual comparison dissects how Otis Worldwide Corporation and A. O. Smith Corporation diversify their income streams and where their primary sector bets lie:
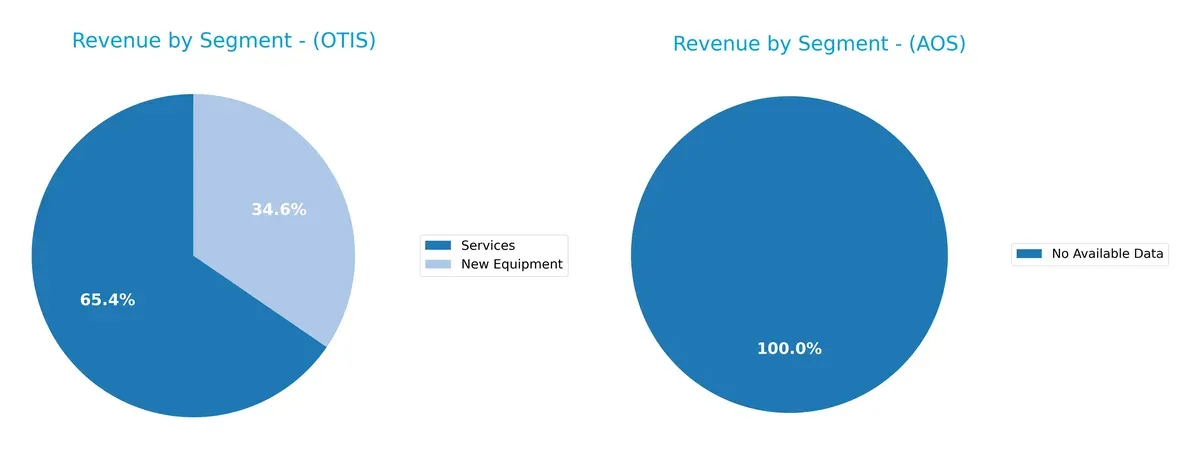
Otis anchors its revenue primarily in two segments: Services at $9.4B and New Equipment at $5.0B in 2025. This mix shows a balanced, recurring income from services, reducing concentration risk. Conversely, A. O. Smith lacks available data, preventing segmentation analysis. Otis’s reliance on services signals ecosystem lock-in, leveraging maintenance contracts for steady cash flow and infrastructure dominance in vertical transportation.
Strengths and Weaknesses Comparison
This table compares the Strengths and Weaknesses of Otis Worldwide Corporation and A. O. Smith Corporation:
Otis Strengths
- Strong services revenue at $9.44B in 2025
- High ROIC of 40.74% exceeding WACC
- Favorable asset and fixed asset turnover ratios
- Global presence with $4.19B US and $1.65B China sales
- Dividend yield stable at 1.88%
A. O. Smith Strengths
- Higher net margin at 14.26%
- Strong ROE at 29.4% and favorable ROIC
- Low debt-to-assets ratio at 7.29%
- Robust interest coverage at 54.03
- Dividend yield slightly higher at 2.09%
Otis Weaknesses
- Negative ROE at -25.67% is unfavorable
- Low liquidity: current ratio 0.85, quick ratio 0.77
- High debt-to-assets at 82.14% indicates leverage risk
- Negative price-to-book ratio at -6.38
- Net margin only neutral at 9.59%
A. O. Smith Weaknesses
- Unfavorable price-to-book ratio at 5.04
- Neutral liquidity ratios: current ratio 1.5, quick ratio 0.94
- WACC relatively high at 9.99%
- Neutral PE ratio at 17.13
Otis displays operational efficiency and strong turnover metrics but faces liquidity and leverage challenges. A. O. Smith shows superior profitability and conservative financial structure, though with moderate valuation concerns. These factors shape their strategic financial positioning.
The Moat Duel: Analyzing Competitive Defensibility
A structural moat is the only reliable barrier protecting long-term profits from relentless competition and market disruption:
Otis Worldwide Corporation: Service Network Lock-in
Otis’s moat stems from its expansive maintenance network and installed base, driving stable margins and a 33% ROIC premium over WACC. Its 34,000 mechanics ensure recurring revenue, but slowing revenue growth in 2025 signals caution for expansion.
A. O. Smith Corporation: Product Innovation & Brand Strength
A. O. Smith’s moat relies on product innovation and strong brand recognition in water heaters and filtration. With a solid 14% ROIC premium and improving EPS growth, it leverages higher margins and global reach to deepen its competitive edge over time.
Network Scale vs. Product Innovation: Who Defends Better?
Otis’s wider moat manifests in a dominant service ecosystem, creating high switching costs. A. O. Smith’s moat is narrower but strengthened by innovation and margin expansion. Otis stands better equipped to defend market share amid industry cyclicality.
Which stock offers better returns?
Both Otis Worldwide Corporation and A. O. Smith Corporation experienced a bearish trend over the past year, with recent trading showing differing momentum and buyer dominance.
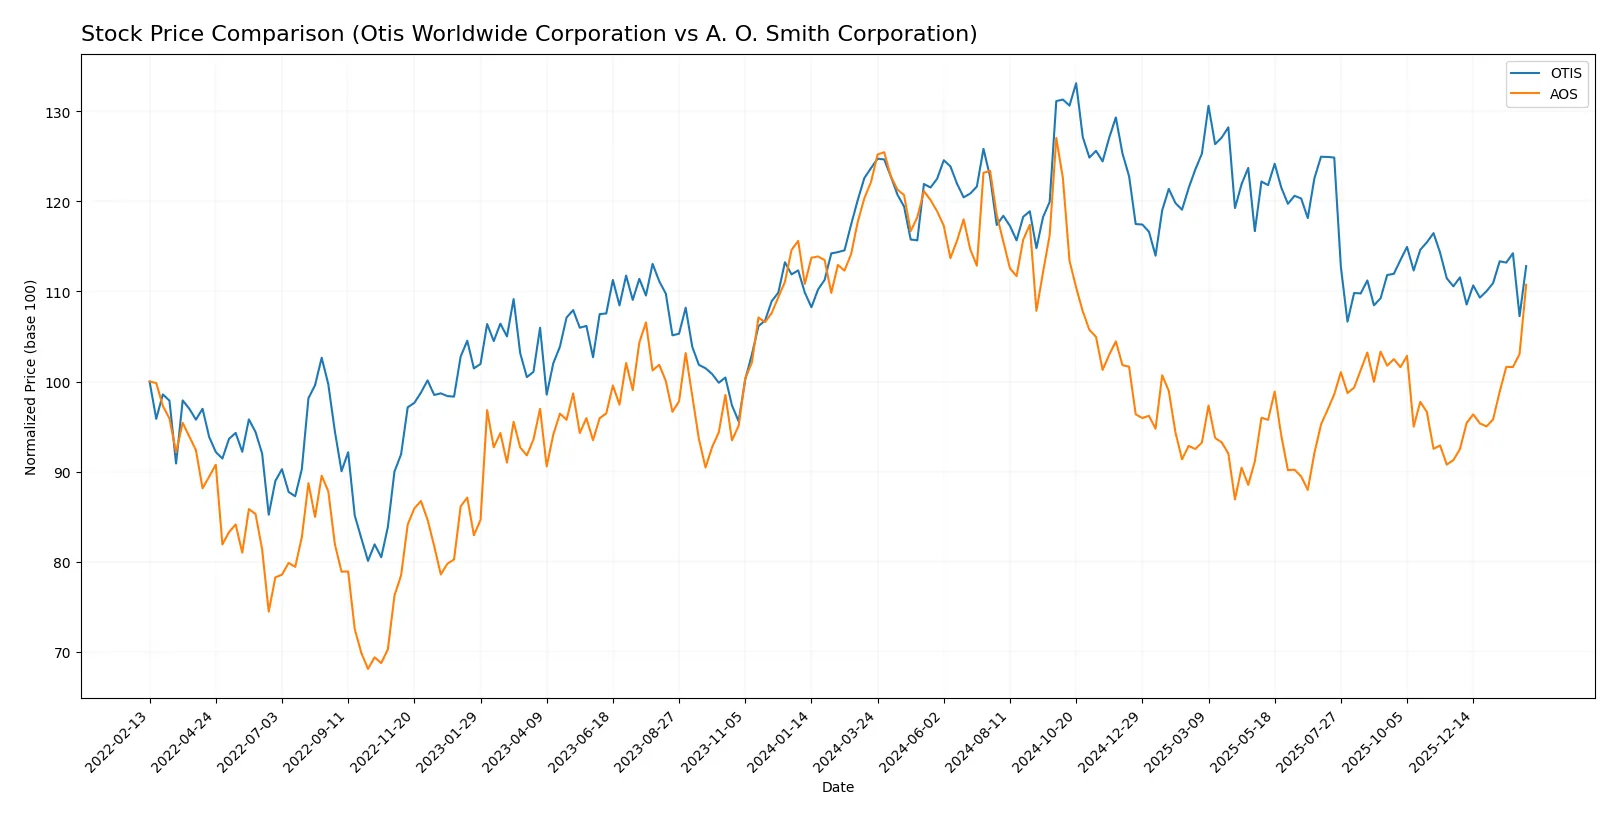
Trend Comparison
Otis Worldwide shows an 8.78% price decline over the past 12 months, indicating a bearish trend with accelerating downward momentum and a high of 106.01 and low of 84.93. A. O. Smith declined 9.31% over the same period, also bearish with accelerating losses, a wider volatility range, and recent strong upward momentum of 21.32%. Comparing trends, A. O. Smith’s recent sharp rebound surpasses Otis’s modest recovery, delivering higher short-term market performance despite both showing annual declines.
Target Prices
Analysts present a moderately bullish consensus for Otis Worldwide Corporation and A. O. Smith Corporation.
| Company | Target Low | Target High | Consensus |
|---|---|---|---|
| Otis Worldwide Corporation | 92 | 109 | 97.75 |
| A. O. Smith Corporation | 75 | 85 | 78 |
The target consensus for Otis suggests a 9% upside from the current 89.85 price, reflecting steady growth expectations. A. O. Smith’s consensus aligns closely with its 78.98 price, indicating limited near-term price appreciation.

Don’t Let Luck Decide Your Entry Point
Optimize your entry points with our advanced ProRealTime indicators. You’ll get efficient buy signals with precise price targets for maximum performance. Start outperforming now!
How do institutions grade them?
The institutional grades for Otis Worldwide Corporation and A. O. Smith Corporation are as follows:
Otis Worldwide Corporation Grades
The latest grades from major financial institutions for Otis Worldwide Corporation are summarized below.
| Grading Company | Action | New Grade | Date |
|---|---|---|---|
| JP Morgan | Maintain | Overweight | 2026-01-16 |
| Wells Fargo | Maintain | Equal Weight | 2025-12-15 |
| Barclays | Maintain | Underweight | 2025-10-30 |
| JP Morgan | Maintain | Overweight | 2025-10-15 |
| Wolfe Research | Upgrade | Outperform | 2025-10-08 |
| Wells Fargo | Maintain | Equal Weight | 2025-10-06 |
| JP Morgan | Maintain | Overweight | 2025-09-18 |
| RBC Capital | Maintain | Outperform | 2025-07-28 |
| Wolfe Research | Upgrade | Peer Perform | 2025-07-25 |
| JP Morgan | Maintain | Overweight | 2025-07-24 |
A. O. Smith Corporation Grades
Institutional grades for A. O. Smith Corporation from recognized firms are detailed below.
| Grading Company | Action | New Grade | Date |
|---|---|---|---|
| DA Davidson | Maintain | Neutral | 2026-02-02 |
| Stifel | Maintain | Buy | 2026-01-30 |
| Citigroup | Maintain | Neutral | 2026-01-30 |
| DA Davidson | Maintain | Neutral | 2025-11-13 |
| Citigroup | Maintain | Neutral | 2025-10-29 |
| Stifel | Maintain | Buy | 2025-10-29 |
| UBS | Maintain | Neutral | 2025-07-28 |
| Oppenheimer | Maintain | Outperform | 2025-07-28 |
| Baird | Maintain | Neutral | 2025-07-25 |
| Stifel | Maintain | Buy | 2025-07-25 |
Which company has the best grades?
Otis Worldwide Corporation generally holds a stronger consensus with multiple Overweight and Outperform ratings. A. O. Smith Corporation mostly receives Neutral and Buy ratings, indicating more cautious optimism. Investors might interpret Otis’s higher grades as institutional confidence in its near-term performance relative to A. O. Smith.
Risks specific to each company
The following categories identify the critical pressure points and systemic threats facing both firms in the 2026 market environment:
1. Market & Competition
Otis Worldwide Corporation
- Faces intense competition in global elevator markets, with innovation pace pressuring margins.
A. O. Smith Corporation
- Competes in diverse heating and water treatment sectors, requiring constant product innovation.
2. Capital Structure & Debt
Otis Worldwide Corporation
- High debt-to-assets ratio at 82.14% signals leverage risk despite favorable interest coverage.
A. O. Smith Corporation
- Low debt-to-assets at 7.29%, indicating financial stability and conservative leverage use.
3. Stock Volatility
Otis Worldwide Corporation
- Beta near 1.01 suggests stock volatility aligns with the overall market.
A. O. Smith Corporation
- Elevated beta at 1.34 implies higher sensitivity to market swings and greater volatility risk.
4. Regulatory & Legal
Otis Worldwide Corporation
- Subject to safety standards and building regulations worldwide, increasing compliance complexity.
A. O. Smith Corporation
- Must navigate environmental regulations on emissions and water quality standards across multiple regions.
5. Supply Chain & Operations
Otis Worldwide Corporation
- Global logistics challenges impact parts availability and service delivery efficiency.
A. O. Smith Corporation
- Dependence on raw materials for manufacturing exposes it to commodity price fluctuations.
6. ESG & Climate Transition
Otis Worldwide Corporation
- Pressure to reduce carbon footprint in manufacturing and maintenance services is rising.
A. O. Smith Corporation
- Strong focus on energy-efficient products aligns with climate transition but requires ongoing innovation.
7. Geopolitical Exposure
Otis Worldwide Corporation
- Significant international exposure, especially in China, creates risk from trade tensions.
A. O. Smith Corporation
- Operations spread across North America, China, Europe, and India increase geopolitical complexity.
Which company shows a better risk-adjusted profile?
Otis’s highest risk lies in its heavy leverage, posing financial vulnerability despite operational strengths. A. O. Smith’s main risk stems from stock volatility and geopolitical complexity. Overall, A. O. Smith exhibits a superior risk-adjusted profile, supported by its strong Altman Z-Score of 7.33 and balanced debt management. Otis’s elevated debt-to-assets ratio above 80% justifies caution, spotlighting solvency concerns in volatile markets.
Final Verdict: Which stock to choose?
Otis Worldwide Corporation’s superpower lies in its ability to generate exceptional returns on invested capital, signaling a robust economic moat. However, its stretched liquidity ratios pose a point of vigilance. This stock fits portfolios targeting aggressive growth with tolerance for operational leverage risks.
A. O. Smith Corporation boasts a strategic moat rooted in consistent profitability and strong balance sheet discipline. Its superior safety profile, with low debt and solid liquidity, makes it suitable for investors seeking growth at a reasonable price, balancing expansion with financial prudence.
If you prioritize maximizing capital efficiency and can weather liquidity constraints, Otis outshines as a high-return growth candidate. However, if you seek steadier growth with better financial stability, A. O. Smith offers a compelling blend of profitability and risk management, albeit at a modest premium.
Disclaimer: Investment carries a risk of loss of initial capital. The past performance is not a reliable indicator of future results. Be sure to understand risks before making an investment decision.
Go Further
I encourage you to read the complete analyses of Otis Worldwide Corporation and A. O. Smith Corporation to enhance your investment decisions: