Home > Comparison > Industrials > NDSN vs AOS
The strategic rivalry between Nordson Corporation and A. O. Smith Corporation shapes the industrial machinery sector. Nordson excels in precision dispensing and advanced fluid control systems, while A. O. Smith leads in residential and commercial water heating solutions. This analysis pits Nordson’s technology-driven niche against A. O. Smith’s broad market footprint, aiming to identify which trajectory offers superior risk-adjusted returns for a diversified portfolio.
Table of contents
Companies Overview
Nordson Corporation and A. O. Smith Corporation both hold significant positions in the industrial machinery sector, shaping markets with distinct product portfolios.
Nordson Corporation: Precision Dispensing Leader
Nordson Corporation leads in industrial dispensing and coating systems, generating revenue by engineering precise application solutions for adhesives, coatings, and biomaterials. In 2026, its strategic focus emphasizes advanced technology integration within its Industrial Precision Solutions and Advanced Technology Solutions segments to enhance automation and precision in manufacturing processes worldwide.
A. O. Smith Corporation: Water Heating and Treatment Innovator
A. O. Smith Corporation dominates the water heating and treatment market, earning revenue through residential and commercial water heaters, boilers, and filtration products. Its 2026 strategy centers on expanding product innovation across global markets, leveraging multiple brands and distribution channels to address diverse customer needs in North America, China, and Europe.
Strategic Collision: Similarities & Divergences
Both companies excel in industrial machinery but diverge sharply in product focus—Nordson champions precision dispensing technologies, while A. O. Smith commands water heating systems. Their competitive battleground lies in market diversification and technology adoption. Nordson’s advanced automation contrasts with A. O. Smith’s broad geographic reach and consumer brand strength, defining unique risk and growth profiles for investors.
Income Statement Comparison
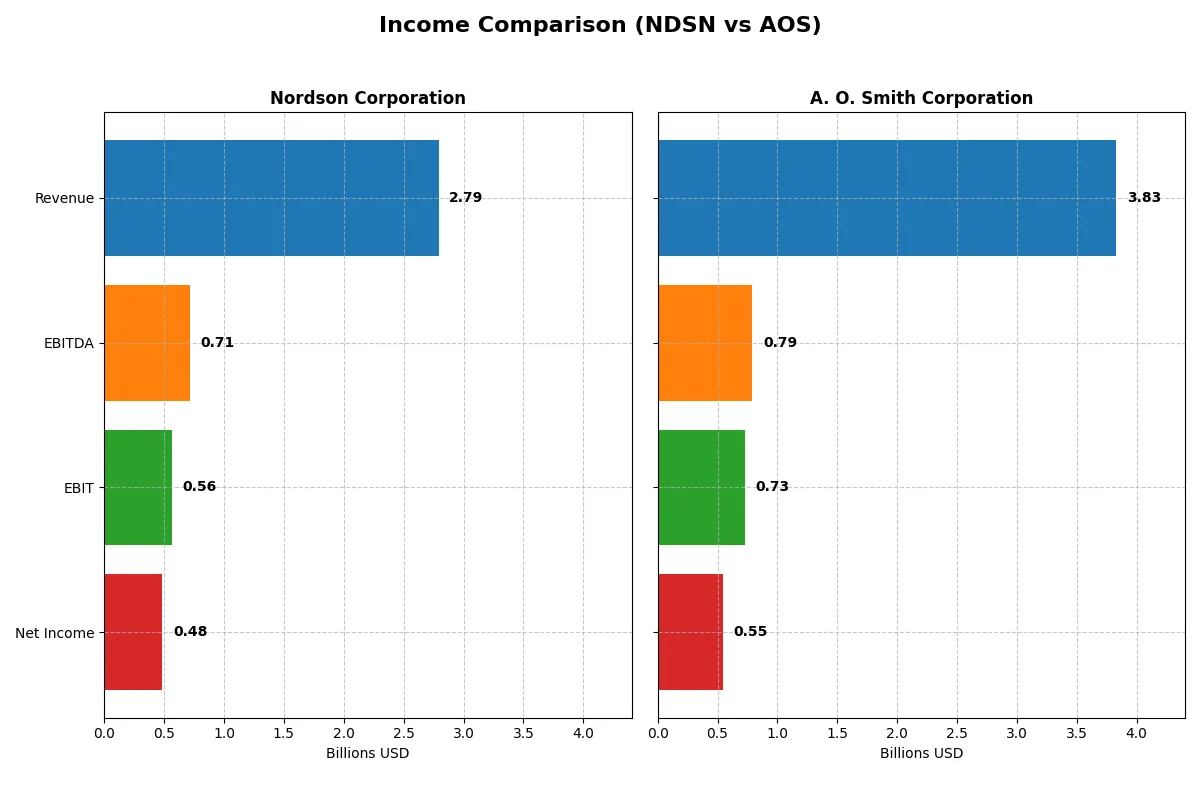
This data dissects the core profitability and scalability of both corporate engines to reveal who dominates the bottom line:
| Metric | Nordson Corporation (NDSN) | A. O. Smith Corporation (AOS) |
|---|---|---|
| Revenue | 2.79B | 3.83B |
| Cost of Revenue | 1.25B | 2.34B |
| Operating Expenses | 828M | 759M |
| Gross Profit | 1.54B | 1.49B |
| EBITDA | 712M | 792M |
| EBIT | 561M | 729M |
| Interest Expense | 101M | 13.5M |
| Net Income | 484M | 546M |
| EPS | 8.56 | 3.86 |
| Fiscal Year | 2025 | 2025 |
Income Statement Analysis: The Bottom-Line Duel
This income statement comparison reveals how efficiently Nordson Corporation and A. O. Smith Corporation convert sales into profits and manage costs.
Nordson Corporation Analysis
Nordson’s revenue grew steadily from $2.36B in 2021 to $2.79B in 2025, with net income rising from $454M to $484M. The firm maintains a strong gross margin of 55.16% and a net margin of 17.35%, reflecting solid cost control. Despite slight EBIT contraction last year, overall momentum remains favorable, boosting earnings per share by nearly 10% over five years.
A. O. Smith Corporation Analysis
A. O. Smith’s revenue advanced modestly from $3.54B in 2021 to $3.83B in 2025, with net income climbing from $487M to $546M. The company posts a lower gross margin of 38.83% but holds a competitive EBIT margin near 19%. Its EPS surged 28% over five years, signaling improved profitability despite flat recent revenue growth and margin pressures.
Margin Strength vs. Earnings Growth
Nordson dominates on margin quality, with superior gross and net margins signaling efficient operations. A. O. Smith delivers stronger EPS growth, driven by steady net income gains despite thinner margins. Nordson’s profile suits investors favoring margin resilience. A. O. Smith appeals to those prioritizing earnings momentum and steady profitability expansion.
Financial Ratios Comparison
These vital ratios act as a diagnostic tool to expose the underlying fiscal health, valuation premiums, and capital efficiency of the companies compared below:
| Ratios | Nordson Corporation (NDSN) | A. O. Smith Corporation (AOS) |
|---|---|---|
| ROE | 15.9% | 25.6% |
| ROIC | 10.5% | 23.9% |
| P/E | 27.1 | 17.1 |
| P/B | 4.31 | 4.39 |
| Current Ratio | 1.64 | 1.50 |
| Quick Ratio | 1.05 | 0.94 |
| D/E | 0.69 | 0.09 |
| Debt-to-Assets | 35.4% | 6.1% |
| Interest Coverage | 7.04 | 53.93 |
| Asset Turnover | 0.47 | 1.22 |
| Fixed Asset Turnover | 4.70 | 5.62 |
| Payout Ratio | 37.0% | 35.8% |
| Dividend yield | 1.36% | 2.09% |
| Fiscal Year | 2025 | 2025 |
Efficiency & Valuation Duel: The Vital Signs
Ratios act as a company’s DNA, revealing hidden risks and operational excellence that shape investor decisions and long-term value creation.
Nordson Corporation
Nordson posts a solid ROE of 15.9% and a strong net margin of 17.4%, signaling healthy profitability. Its valuation is stretched with a P/E of 27.1, above sector averages. Dividend yield at 1.36% provides moderate shareholder returns, balancing reinvestment in R&D for sustained growth.
A. O. Smith Corporation
A. O. Smith delivers superior profitability with a 25.6% ROE and 14.3% net margin, reflecting operational efficiency. The stock trades at a moderate P/E of 17.1, indicating fair valuation. A 2.09% dividend yield and low debt show disciplined capital allocation and shareholder-friendly policy.
Premium Valuation vs. Operational Safety
Nordson’s higher valuation signals growth expectations but carries valuation risk. A. O. Smith combines strong returns with a fair price and robust balance sheet. Investors seeking stable, efficient operations may prefer A. O. Smith, while growth-oriented profiles might weigh Nordson’s premium.
Which one offers the Superior Shareholder Reward?
I observe that Nordson Corporation (NDSN) pays a modest 1.36% dividend yield with a sustainable payout ratio near 37%, supported by strong free cash flow coverage above 90%. Its robust buyback program complements dividend returns, enhancing total shareholder reward. In contrast, A. O. Smith Corporation (AOS) offers a higher yield of 2.09% but with a similar payout ratio around 36%, balancing dividends with moderate buybacks. AOS’s lower debt and efficient capital structure favor steady distributions. However, NDSN’s superior free cash flow generation and aggressive buybacks make its shareholder rewards more sustainable and attractive for long-term value in 2026. I conclude Nordson offers the superior total return profile given its blend of dividends, buybacks, and free cash flow strength.
Comparative Score Analysis: The Strategic Profile
The radar chart reveals the fundamental DNA and trade-offs of Nordson Corporation and A. O. Smith Corporation, highlighting their distinct financial strengths and weaknesses:
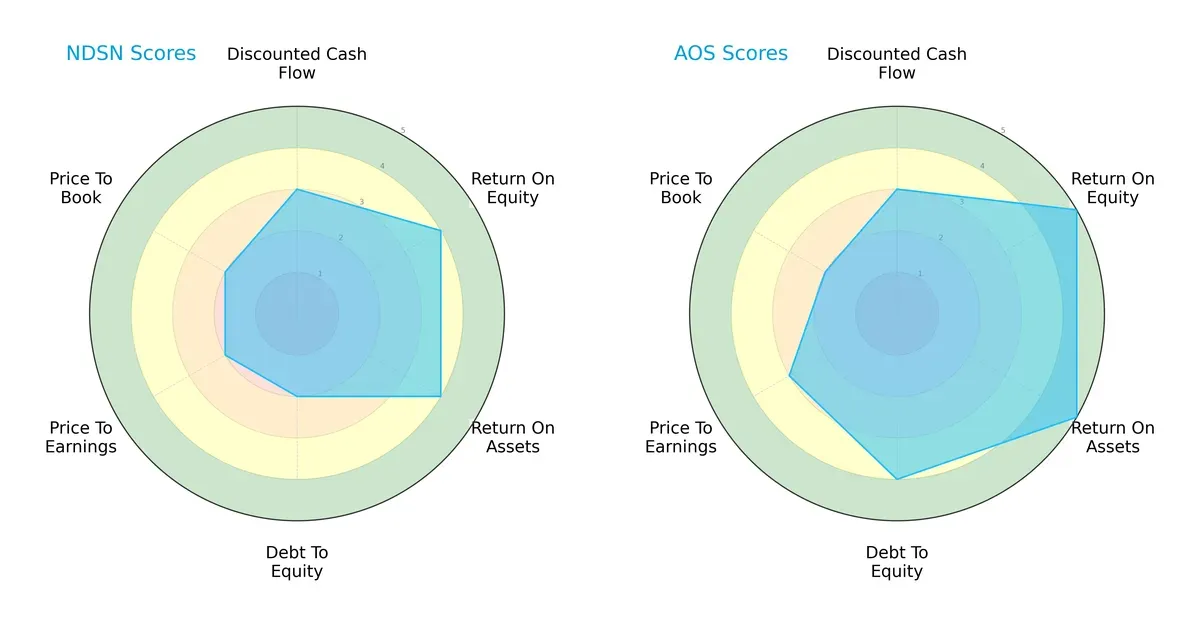
A. O. Smith shows a more balanced profile with superior ROE (5 vs. 4) and ROA (5 vs. 4), reflecting higher efficiency in capital use. Nordson lags on debt management with a weaker Debt/Equity score (2 vs. 4), indicating higher leverage risk. Both share moderate valuation scores, but A. O. Smith’s overall score of 4 outperforms Nordson’s 3, signaling stronger market confidence.
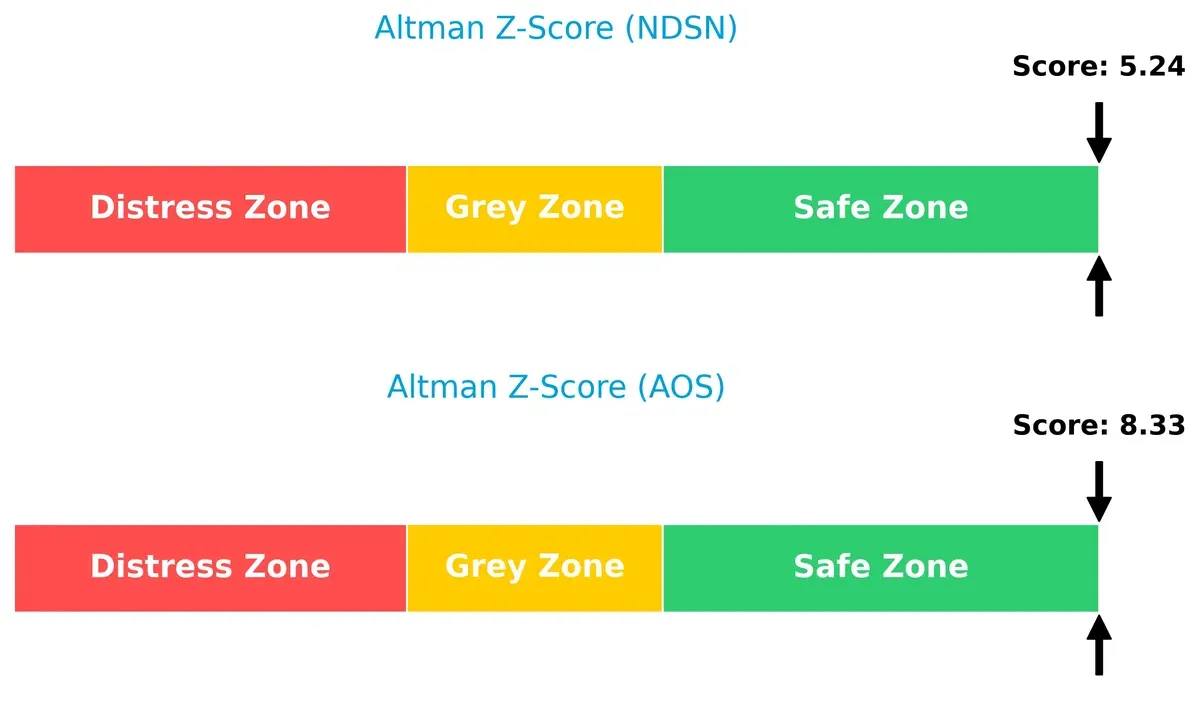
Bankruptcy Risk: Solvency Showdown
A. O. Smith’s Altman Z-Score of 8.33 far exceeds Nordson’s 5.24, both safely above the bankruptcy risk threshold, but A. O. Smith’s superior score underscores a stronger cushion against economic downturns:
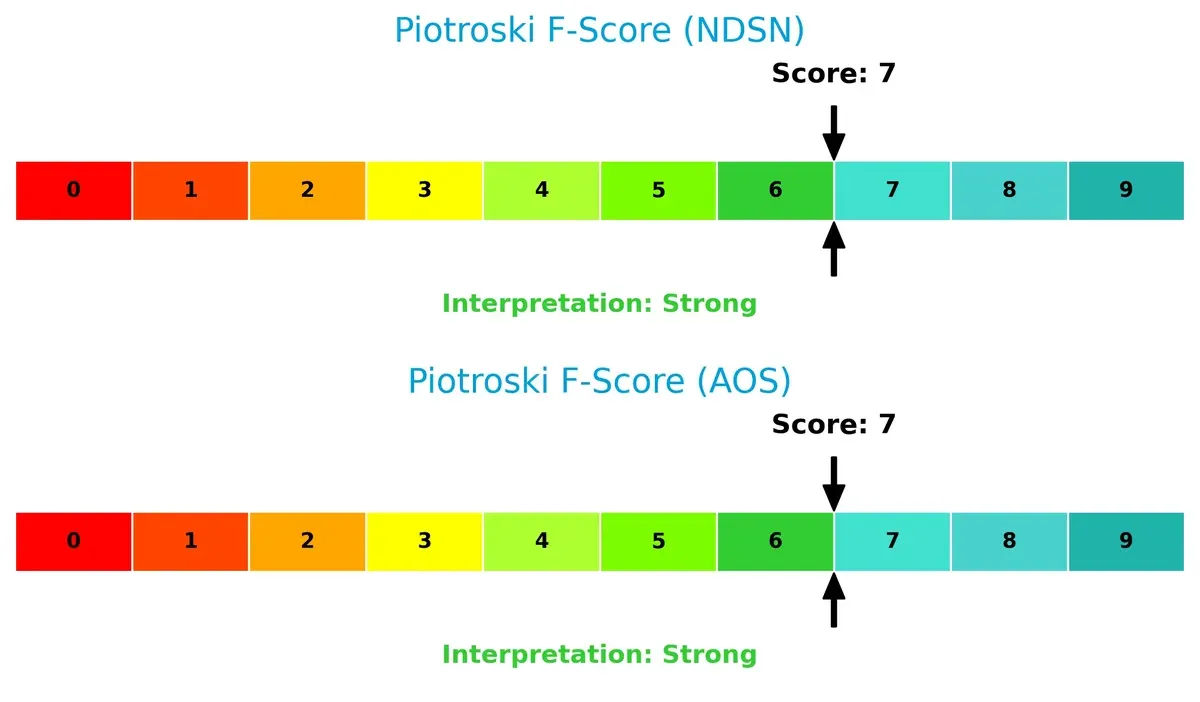
Financial Health: Quality of Operations
Nordson and A. O. Smith both score a robust 7 on the Piotroski F-Score, signaling strong internal financial health and operational quality. Neither firm exhibits red flags, confirming solid fundamentals:
How are the two companies positioned?
This section dissects Nordson and A. O. Smith’s operational DNA by comparing revenue distribution and internal strengths and weaknesses. The goal is to confront their economic moats to reveal which model offers the most resilient competitive advantage today.
Revenue Segmentation: The Strategic Mix
This visual comparison dissects how Nordson Corporation and A. O. Smith Corporation diversify income streams and reveals their primary sector bets:
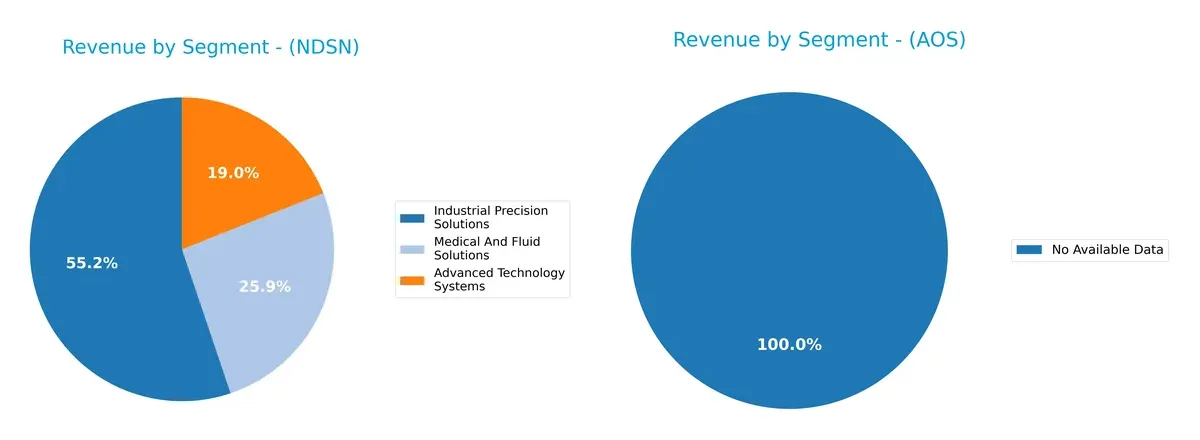
Nordson leans on a diversified mix with Industrial Precision Solutions at $1.48B, Medical And Fluid Solutions at $695M, and Advanced Technology Systems at $510M in 2024. A. O. Smith lacks available data, preventing segmentation analysis. Nordson’s spread reduces concentration risk and suggests strategic bets on industrial infrastructure and advanced tech ecosystems. This mix contrasts sharply with firms reliant on a single dominant segment, highlighting Nordson’s balanced portfolio approach.
Strengths and Weaknesses Comparison
This table compares the Strengths and Weaknesses of Nordson Corporation and A. O. Smith Corporation:
Nordson Corporation Strengths
- Diversified revenue streams across Advanced Technology, Industrial Precision, and Medical Solutions
- Favorable net margin (17.35%) and ROE (15.92%)
- Strong liquidity with current ratio 1.64 and quick ratio 1.05
- Favorable fixed asset turnover (4.7)
- Balanced debt-to-assets at 35%
A. O. Smith Corporation Strengths
- Favorable ROE (25.64%) and ROIC (23.94%) well above WACC
- Low leverage with debt-to-assets 6.11% and strong interest coverage (54x)
- Higher asset turnover (1.22) and fixed asset turnover (5.62)
- Favorable dividend yield (2.09%)
- Large North America and Rest of World sales base
Nordson Corporation Weaknesses
- Unfavorable valuation multiples: high P/E (27.1) and P/B (4.31)
- Unfavorable asset turnover (0.47) despite strong fixed asset turnover
- Neutral debt level (D/E 0.69) and WACC (8.06%)
- Moderate market share concentration in Americas and Asia Pacific
A. O. Smith Corporation Weaknesses
- Elevated WACC (10.08%) above ROE could pressure returns
- Neutral liquidity ratios: current ratio 1.5, quick ratio 0.94
- Unfavorable P/B ratio (4.39)
- Less diversified product segmentation data available
Both companies show solid profitability and global presence but differ in capital structure and operational efficiency. Nordson’s diversified product lines contrast with A. O. Smith’s stronger capital efficiency and low leverage. These factors imply distinct strategic focuses on innovation and financial discipline.
The Moat Duel: Analyzing Competitive Defensibility
A structural moat shields long-term profits from relentless competition and market pressures. Let’s dissect how Nordson and A. O. Smith defend their economic value:
Nordson Corporation: Precision Engineering Moat
Nordson’s primary moat lies in its specialized dispensing and coating systems, creating high switching costs. This translates to a solid 20.1% EBIT margin and a favorable 17.35% net margin. However, a declining ROIC trend signals emerging pressure on profitability in 2026.
A. O. Smith Corporation: Durable Water Technology Moat
A. O. Smith leverages strong brand and cost advantages in water heaters and treatment. Its ROIC surpasses WACC by nearly 14%, with a rising trend, reflecting expanding margin strength. Growth in global markets and product innovation supports a very favorable moat outlook.
Precision Engineering vs. Durable Water Technology: A Moat Comparison
A. O. Smith’s moat is both wider and deeper, demonstrated by a robust, growing ROIC and margin expansion. Nordson’s moat remains valuable but shows signs of margin compression. A. O. Smith is better positioned to sustain and grow market share through 2026.
Which stock offers better returns?
The past year shows Nordson Corporation’s stock gaining steadily with accelerating momentum, while A. O. Smith Corporation exhibits a marked overall decline despite recent recovery signs.
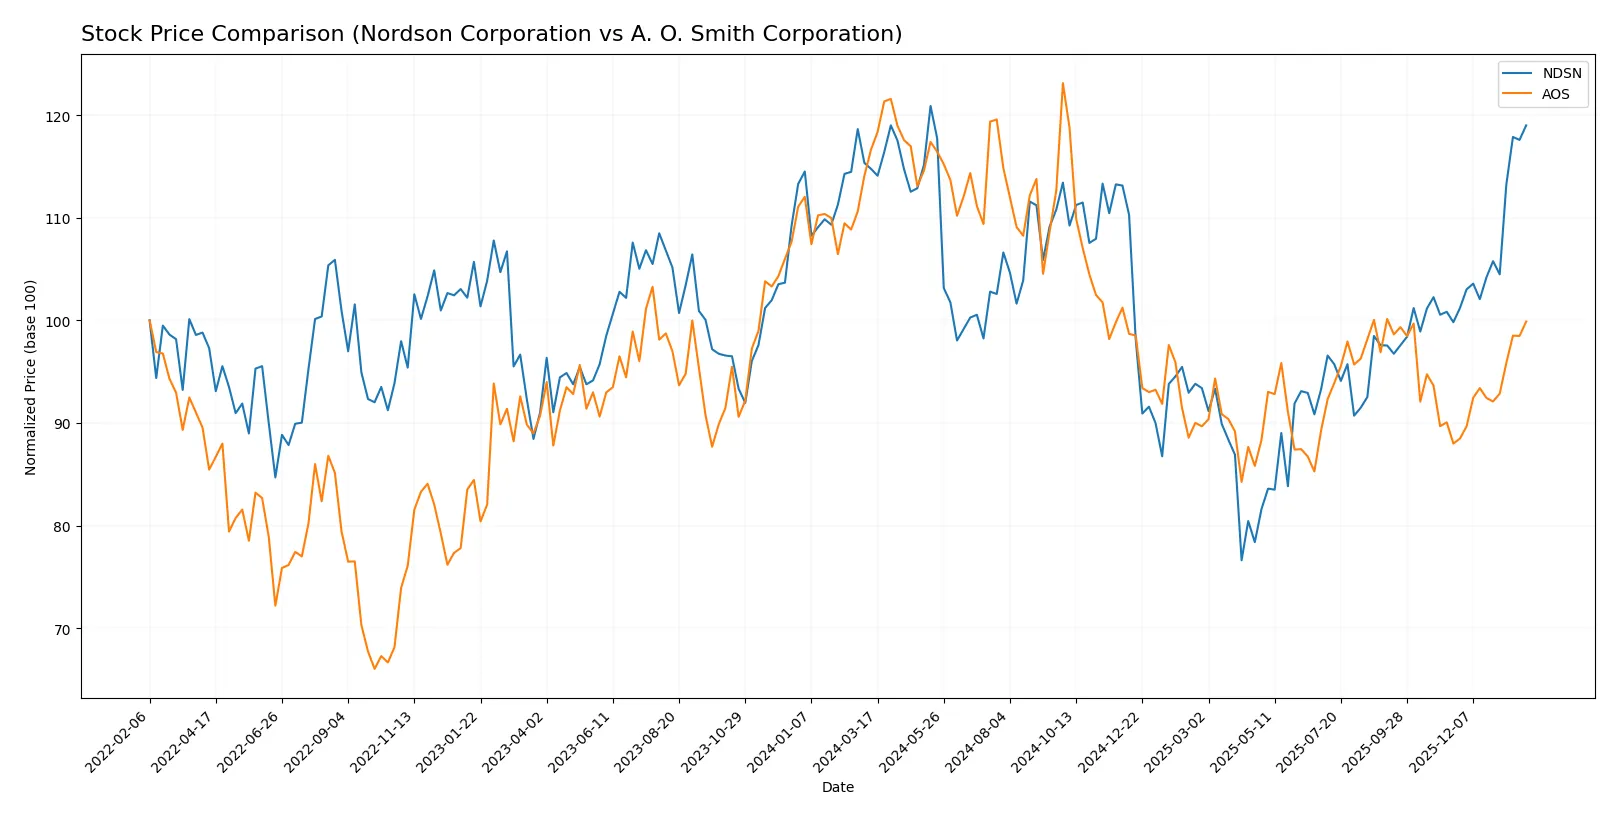
Trend Comparison
Nordson Corporation’s stock rose 3.69% over the past year, reflecting a bullish trend with accelerating gains and a notable high of 278.89. Volatility remains elevated with a standard deviation of 23.66.
A. O. Smith Corporation’s stock declined 14.37% over the same period, marking a bearish trend despite acceleration and a recent 13.52% price recovery. Volatility is lower, with a standard deviation of 7.87.
Comparing both, Nordson delivered the highest market performance with sustained bullish momentum, while A. O. Smith remains in an overall downtrend despite recent upward movement.
Target Prices
Analysts present a moderate upside for Nordson Corporation and A. O. Smith Corporation based on current consensus targets.
| Company | Target Low | Target High | Consensus |
|---|---|---|---|
| Nordson Corporation | 240 | 295 | 274.17 |
| A. O. Smith Corporation | 75 | 85 | 79 |
Nordson’s target consensus aligns closely with its current price of $274.53, suggesting limited near-term upside. A. O. Smith’s consensus target of $79 exceeds its current price of $73.49, indicating modest analyst optimism.

Don’t Let Luck Decide Your Entry Point
Optimize your entry points with our advanced ProRealTime indicators. You’ll get efficient buy signals with precise price targets for maximum performance. Start outperforming now!
How do institutions grade them?
The following tables summarize recent institutional grades for Nordson Corporation and A. O. Smith Corporation:
Nordson Corporation Grades
These are recent grades assigned by reputable financial institutions for Nordson Corporation.
| Grading Company | Action | New Grade | Date |
|---|---|---|---|
| DA Davidson | Maintain | Buy | 2025-12-12 |
| Baird | Maintain | Neutral | 2025-12-12 |
| Keybanc | Maintain | Overweight | 2025-12-11 |
| DA Davidson | Maintain | Buy | 2025-12-11 |
| Oppenheimer | Maintain | Outperform | 2025-08-25 |
A. O. Smith Corporation Grades
These are recent grades assigned by reputable financial institutions for A. O. Smith Corporation.
| Grading Company | Action | New Grade | Date |
|---|---|---|---|
| Stifel | Maintain | Buy | 2026-01-30 |
| Citigroup | Maintain | Neutral | 2026-01-30 |
| DA Davidson | Maintain | Neutral | 2025-11-13 |
| Stifel | Maintain | Buy | 2025-10-29 |
| Citigroup | Maintain | Neutral | 2025-10-29 |
Which company has the best grades?
Nordson has more consistent positive grades such as Buy and Outperform, while A. O. Smith shows a mix of Buy and Neutral ratings. This suggests Nordson might attract more bullish investor sentiment, potentially impacting its relative market positioning.
Risks specific to each company
The following categories identify critical pressure points and systemic threats facing Nordson Corporation and A. O. Smith Corporation in the 2026 market environment:
1. Market & Competition
Nordson Corporation
- Faces pressure from industrial machinery rivals with moderate growth in adhesives and coating markets.
A. O. Smith Corporation
- Operates in water heaters and treatment with intense competition, especially in China and India.
2. Capital Structure & Debt
Nordson Corporation
- Moderate leverage (D/E 0.69), interest coverage healthy at 5.55x; debt-to-assets at 35.4% signals balanced risk.
A. O. Smith Corporation
- Very low leverage (D/E 0.09), exceptional interest coverage 54x; strong balance sheet with 6.1% debt-to-assets.
3. Stock Volatility
Nordson Corporation
- Beta of 1.03 indicates near-market volatility; stock price range wide but near peak.
A. O. Smith Corporation
- Higher beta 1.35 signals above-market volatility; stock price fluctuates but remains near 52-week high.
4. Regulatory & Legal
Nordson Corporation
- Exposure to industrial safety and environmental regulations globally; potential compliance costs.
A. O. Smith Corporation
- Faces stringent water safety and energy efficiency regulations in multiple jurisdictions.
5. Supply Chain & Operations
Nordson Corporation
- Dependent on global suppliers for precision components; risks from supply disruptions in specialty materials.
A. O. Smith Corporation
- Complex supply chain for manufacturing water heaters and filtration systems; vulnerable to raw material price swings.
6. ESG & Climate Transition
Nordson Corporation
- Needs to align coatings and adhesives business with sustainability trends; moderate ESG risks.
A. O. Smith Corporation
- Strong focus on energy-efficient products; ESG efforts could be a competitive advantage amid tightening climate policies.
7. Geopolitical Exposure
Nordson Corporation
- Global sales subject to trade tensions and tariffs, especially in Asia and Europe.
A. O. Smith Corporation
- Significant exposure to China and India markets, with geopolitical risks affecting growth prospects.
Which company shows a better risk-adjusted profile?
A. O. Smith faces its biggest risk in geopolitical exposure due to its large presence in China and India. Nordson’s primary risk lies in supply chain vulnerabilities affecting precision components. A. O. Smith’s superior capital structure, stronger profitability ratios, and higher interest coverage give it a better risk-adjusted profile. Notably, A. O. Smith’s Altman Z-score of 8.33 versus Nordson’s 5.24 signals stronger financial safety, justifying caution for Nordson despite solid fundamentals.
Final Verdict: Which stock to choose?
Nordson Corporation’s superpower lies in its resilient value creation, evidenced by a consistent ROIC above WACC, signaling efficient capital use. However, its declining profitability trend is a point of vigilance. This stock suits an aggressive growth portfolio that can tolerate cyclical earnings pressure for long-term gains.
A. O. Smith Corporation benefits from a durable competitive moat, reflected in its rising ROIC and robust financial stability. Its lower leverage and superior interest coverage offer a safety cushion compared to Nordson. This makes it appealing for investors seeking GARP—growth at a reasonable price—with a focus on steady profitability.
If you prioritize durable competitive advantages and superior stability, A. O. Smith outshines as the compelling choice due to its growing profitability and conservative balance sheet. However, if your strategy leans toward aggressive growth with a tolerance for margin variability, Nordson offers a potentially higher reward but with elevated risk. Both scenarios require careful monitoring of earnings trends and valuation multiples.
Disclaimer: Investment carries a risk of loss of initial capital. The past performance is not a reliable indicator of future results. Be sure to understand risks before making an investment decision.
Go Further
I encourage you to read the complete analyses of Nordson Corporation and A. O. Smith Corporation to enhance your investment decisions: