Home > Comparison > Industrials > AOS vs NNE
The strategic rivalry between A. O. Smith Corporation and Nano Nuclear Energy Inc shapes innovation within the industrial machinery sector. A. O. Smith, a capital-intensive manufacturer of water heaters and treatment systems, contrasts sharply with Nano Nuclear, a nascent microreactor technology pioneer. This analysis explores their divergent operational models and growth strategies to determine which stock offers a superior risk-adjusted return for a diversified industrials portfolio.
Table of contents
Companies Overview
A. O. Smith Corporation and Nano Nuclear Energy Inc represent two distinct forces in industrial machinery with growing market relevance.
A. O. Smith Corporation: Established Leader in Water Heating Solutions
A. O. Smith Corporation dominates the residential and commercial water heating market with a broad product portfolio. Its core revenue stems from water heaters, boilers, and water treatment products distributed globally. In 2026, the company focuses on expanding its energy-efficient heating technologies across North America, China, and Europe to sustain its competitive edge.
Nano Nuclear Energy Inc: Innovator in Microreactor Technology
Nano Nuclear Energy Inc pioneers the microreactor space by developing solid-core and low-pressure coolant reactors. The company’s revenue engine revolves around advanced nuclear technology and fuel fabrication services. In 2026, it concentrates on commercializing its ZEUS and ODIN reactors and scaling its nuclear fuel supply chain to disrupt traditional energy sectors.
Strategic Collision: Similarities & Divergences
Both companies operate in industrial machinery but diverge sharply in business philosophy—A. O. Smith relies on established product lines and broad distribution, while Nano Nuclear pursues breakthrough nuclear innovations. Their primary battleground is energy solutions, with A. O. Smith focusing on conventional heating and Nano Nuclear targeting clean nuclear power. Their investment profiles reflect mature stability versus high-volatility growth potential.
Income Statement Comparison
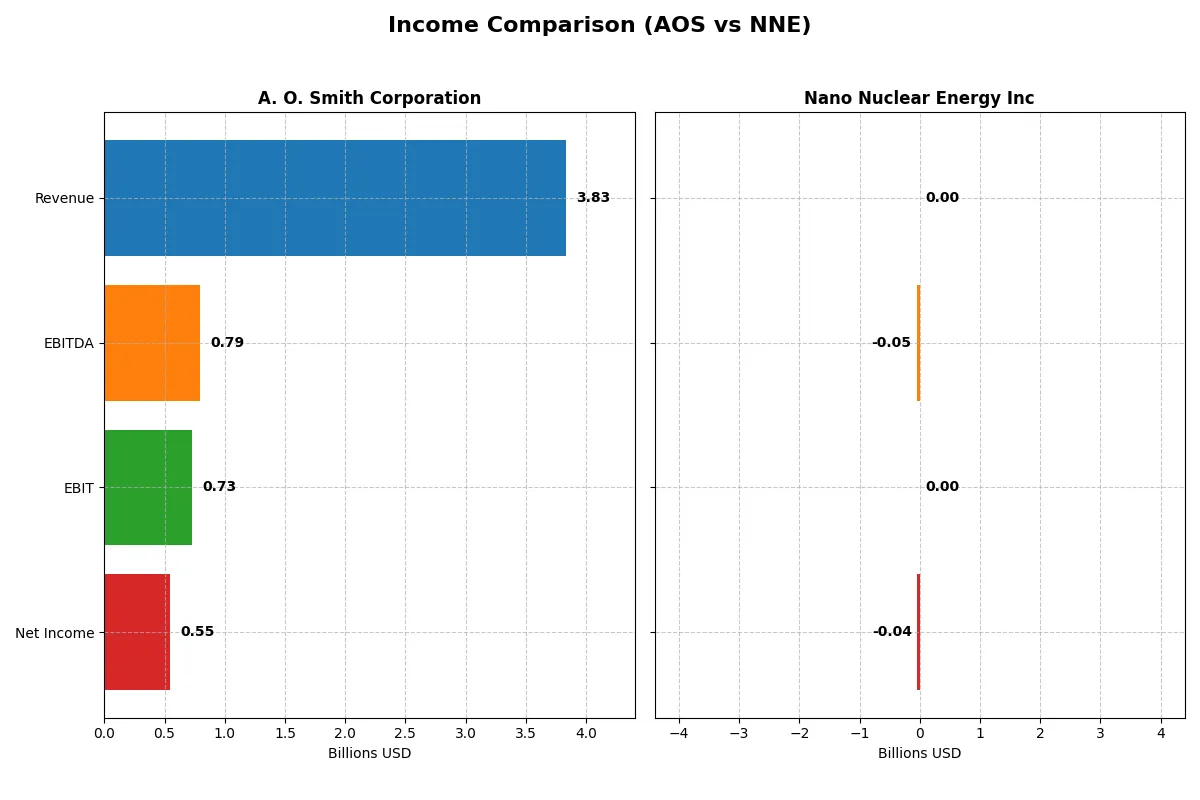
This data dissects the core profitability and scalability of both corporate engines to reveal who dominates the bottom line:
| Metric | A. O. Smith Corporation (AOS) | Nano Nuclear Energy Inc (NNE) |
|---|---|---|
| Revenue | 3.83B | 0 |
| Cost of Revenue | 2.34B | 0 |
| Operating Expenses | 759M | 45M |
| Gross Profit | 1.49B | 0 |
| EBITDA | 792M | -46M |
| EBIT | 729M | 0 |
| Interest Expense | 14M | 0 |
| Net Income | 546M | -40M |
| EPS | 3.86 | -1.06 |
| Fiscal Year | 2025 | 2025 |
Income Statement Analysis: The Bottom-Line Duel
This income statement comparison reveals which company runs a more efficient and profitable operational engine.
A. O. Smith Corporation Analysis
A. O. Smith’s revenue grew modestly to 3.83B in 2025, with net income rising to 546M, reflecting steady profitability. Gross and net margins hold strong at 38.8% and 14.3%, respectively, signaling solid cost control. The company shows consistent momentum, with a favorable 27.8% EPS growth over five years.
Nano Nuclear Energy Inc Analysis
Nano Nuclear Energy reported zero revenue for 2025, resulting in a net loss of 40M. Margins remain unfavorable due to the absence of sales and ongoing operating expenses near 45M. Despite a large EPS improvement from prior years, the company struggles to generate positive earnings or scale revenue.
Margin Strength vs. Revenue Absence
A. O. Smith exhibits clear fundamental strength with positive revenue, solid margins, and consistent profit growth. Nano Nuclear Energy’s lack of revenue and persistent losses mark it as a high-risk profile. For investors, A. O. Smith’s stable earnings and efficiency present a more attractive investment foundation.
Financial Ratios Comparison
These vital ratios act as a diagnostic tool to expose the underlying fiscal health, valuation premiums, and capital efficiency of the companies compared:
| Ratios | A. O. Smith Corporation (AOS) | Nano Nuclear Energy Inc (NNE) |
|---|---|---|
| ROE | 25.6% | -0.02% |
| ROIC | 23.9% | -0.02% |
| P/E | 17.1 | -36.5 |
| P/B | 4.39 | 0.007 |
| Current Ratio | 1.50 | 53.5 |
| Quick Ratio | 0.94 | 53.5 |
| D/E (Debt-to-Equity) | 0.09 | 0.01 |
| Debt-to-Assets | 6.1% | 1.2% |
| Interest Coverage | 53.9 | 0 |
| Asset Turnover | 1.22 | 0 |
| Fixed Asset Turnover | 5.62 | 0 |
| Payout ratio | 35.8% | 0 |
| Dividend yield | 2.09% | 0 |
| Fiscal Year | 2025 | 2025 |
Efficiency & Valuation Duel: The Vital Signs
Financial ratios act as a company’s DNA, exposing hidden risks and operational strengths essential for investor insight.
A. O. Smith Corporation
AOS demonstrates solid profitability with a 25.64% ROE and a 14.26% net margin, signaling strong operational efficiency. Its P/E ratio of 17.13 suggests a fairly valued stock, neither stretched nor cheap. The company rewards shareholders with a 2.09% dividend yield, reflecting steady cash returns alongside prudent capital allocation.
Nano Nuclear Energy Inc
NNE struggles with negative returns: ROE and ROIC hover near zero or below, indicating operational challenges. Despite a low P/B of 0.01 and negative P/E, these valuation metrics reflect distress rather than opportunity. The firm pays no dividends, relying heavily on reinvestment to fuel growth, but weak income quality and coverage ratios raise concerns.
Operational Strength vs. Valuation Distress
AOS balances profitability and valuation well, offering a safer risk-reward profile with tangible shareholder returns. NNE’s metrics reveal financial strain and execution risk despite cheap valuation multiples. Investors seeking stability gravitate toward AOS, while those tolerating uncertainty might consider NNE’s growth ambitions.
Which one offers the Superior Shareholder Reward?
I compare A. O. Smith Corporation (AOS) and Nano Nuclear Energy Inc (NNE) on dividends, buybacks, and sustainability. AOS pays a steady 2% dividend with a 36% payout ratio, supported by strong free cash flow (3.9/share). Its buyback program also contributes to shareholder returns. NNE pays no dividend and burns cash (-740/share FCF), focusing on growth and R&D with high cash reserves but negative operating cash flow. AOS’s distribution is sustainable, balancing dividends and buybacks, while NNE’s model is speculative with high risk. For 2026, AOS offers the more attractive and reliable total return profile.
Comparative Score Analysis: The Strategic Profile
The radar chart reveals the fundamental DNA and trade-offs of A. O. Smith Corporation and Nano Nuclear Energy Inc:
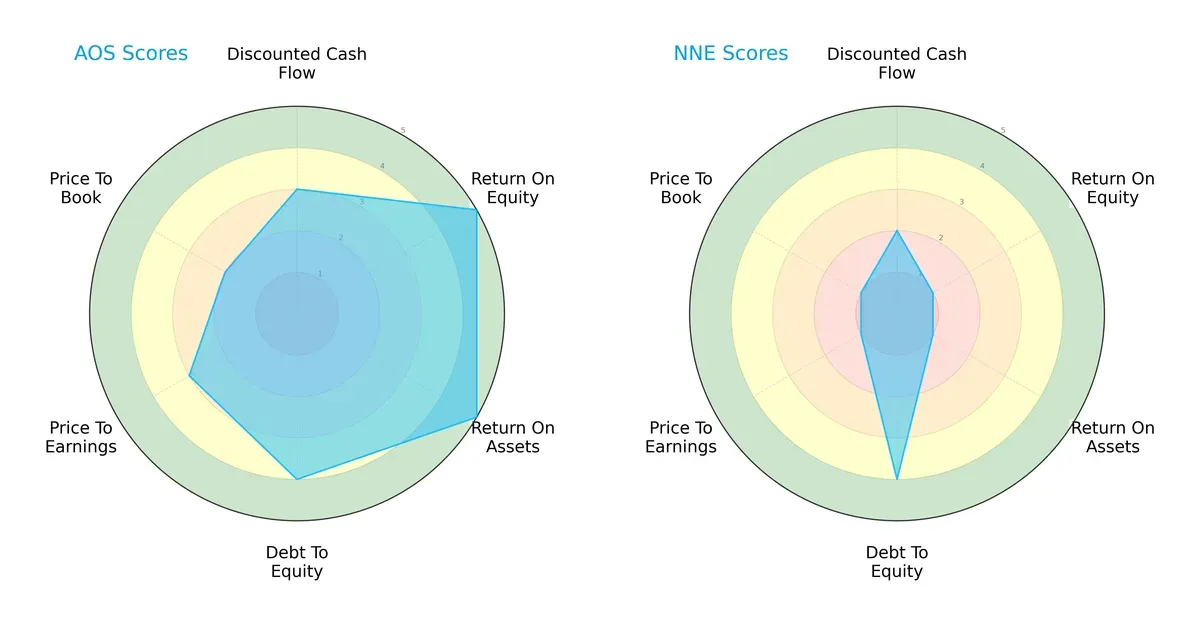
AOS shows a balanced profile with strong ROE and ROA scores (5 each), indicating efficient profit and asset use. It maintains moderate DCF (3) and valuation scores (PE 3, PB 2), with a favorable debt-to-equity score (4), reflecting prudent leverage. NNE relies heavily on a favorable debt position (4) but scores very low on profitability metrics (ROE 1, ROA 1) and valuation (PE 1, PB 1), signaling operational challenges and possible overvaluation risks.
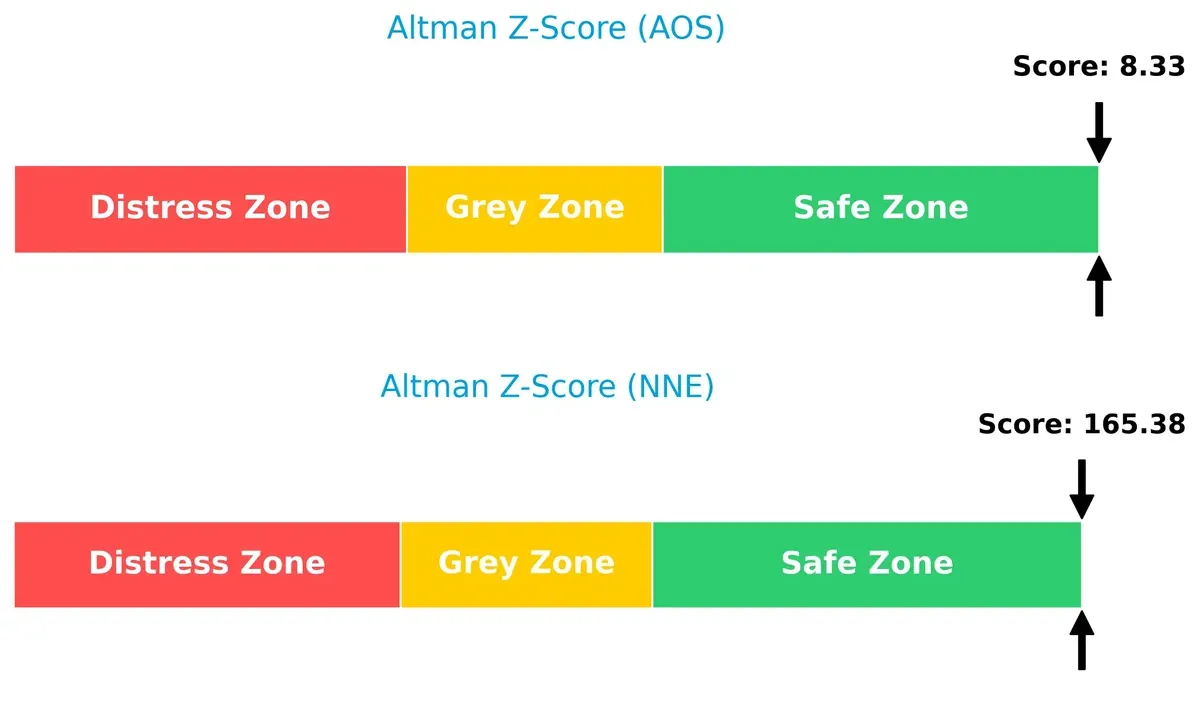
Bankruptcy Risk: Solvency Showdown
AOS and NNE both sit comfortably in the safe zone by Altman Z-Score standards, but NNE’s score (165.38) significantly exceeds AOS’s (8.33), implying a stronger solvency buffer and lower bankruptcy risk for NNE in this cycle:
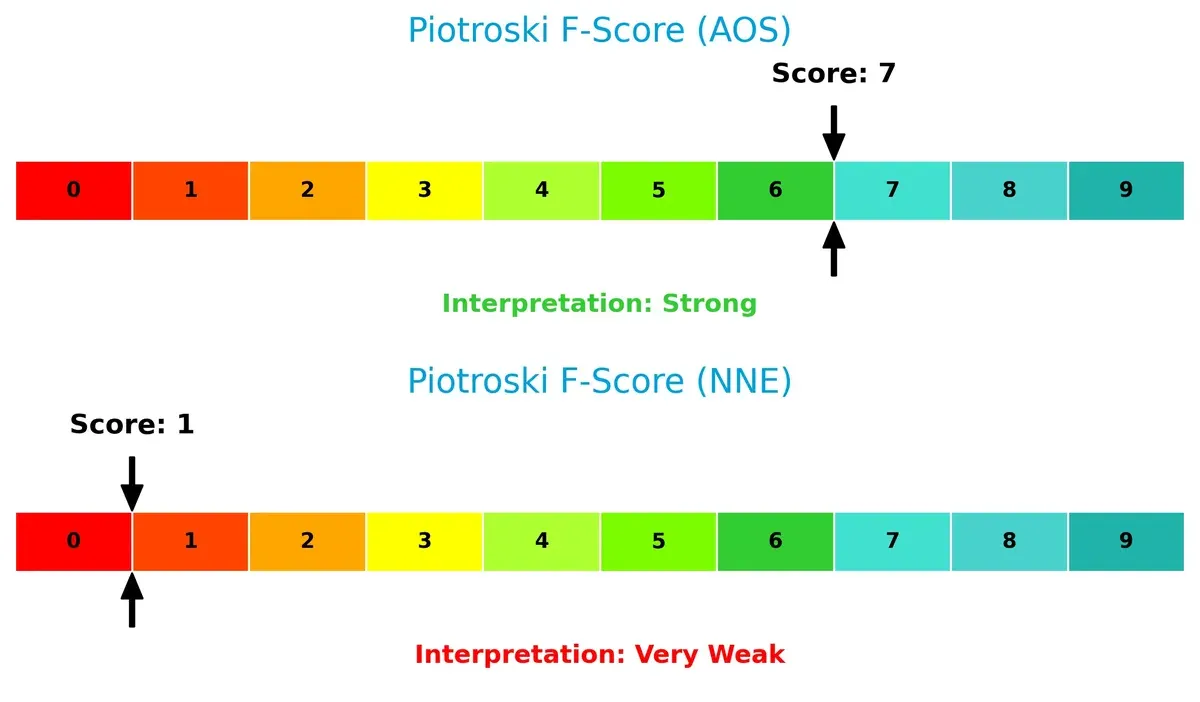
Financial Health: Quality of Operations
AOS posts a strong Piotroski F-Score of 7, signaling robust financial health and operational efficiency. NNE’s weak score of 1 flags red flags in profitability and liquidity, highlighting internal financial distress compared to AOS:
How are the two companies positioned?
This section dissects the operational DNA of AOS and NNE by comparing their revenue distribution and internal dynamics. The goal is to confront their economic moats to identify which model offers the most resilient advantage today.
Strengths and Weaknesses Comparison
This table compares the Strengths and Weaknesses of A. O. Smith Corporation and Nano Nuclear Energy Inc:
A. O. Smith Corporation Strengths
- Strong profitability with 14.26% net margin
- High ROE at 25.64% and ROIC of 23.94%
- Low debt with 6.11% debt-to-assets
- Solid global presence across North America and Rest of World
- Favorable current and interest coverage ratios
- Consistent asset turnover and dividend yield
Nano Nuclear Energy Inc Strengths
- Very low debt levels with 1.22% debt-to-assets
- Favorable price-to-book valuation at 0.01
- Favorable quick ratio of 53.48
- Some valuation appeal with negative P/E ratio
- Minimal leverage indicated by 0.01 debt-to-equity
A. O. Smith Corporation Weaknesses
- WACC higher than ideal at 10.08%
- Unfavorable price-to-book ratio at 4.39
- Neutral liquidity ratios may limit flexibility
- Moderate current ratio at 1.5
- Some valuation multiples not strongly favorable
Nano Nuclear Energy Inc Weaknesses
- Zero profitability with negative ROE and ROIC
- No net margin and zero asset turnover
- Unfavorable interest coverage at zero
- No dividend yield
- Unfavorable current ratio despite high quick ratio
- Unfavorable WACC at 13.87%
AOS demonstrates robust profitability and a well-diversified global footprint, supporting stable operations and capital efficiency. NNE shows very low leverage and attractive valuation metrics but faces significant operational and profitability challenges, highlighting risk in its financial performance.
The Moat Duel: Analyzing Competitive Defensibility
A structural moat is the only shield protecting long-term profits against relentless competitive pressure and market disruption:
A. O. Smith Corporation: Durable Cost Advantage and Brand Strength
AOS leverages scale and manufacturing efficiency, supporting a robust cost advantage. Its 14% net margin and 19% EBIT margin reflect consistent profitability. Expansion in global water treatment deepens its moat in 2026.
Nano Nuclear Energy Inc: Emerging Innovation Moat in Microreactors
NNE’s moat centers on intellectual property and pioneering microreactor tech. Despite zero current profits, its soaring ROIC trend signals potential. Commercializing ZEUS and ODIN reactors could disrupt energy markets if execution succeeds.
Value Creation vs. Innovation Potential: The Moat Battle
AOS commands a wider, proven moat with steady value creation and global reach. NNE shows promise but currently sheds value despite growth in ROIC. AOS remains better positioned to defend market share in 2026.
Which stock offers better returns?
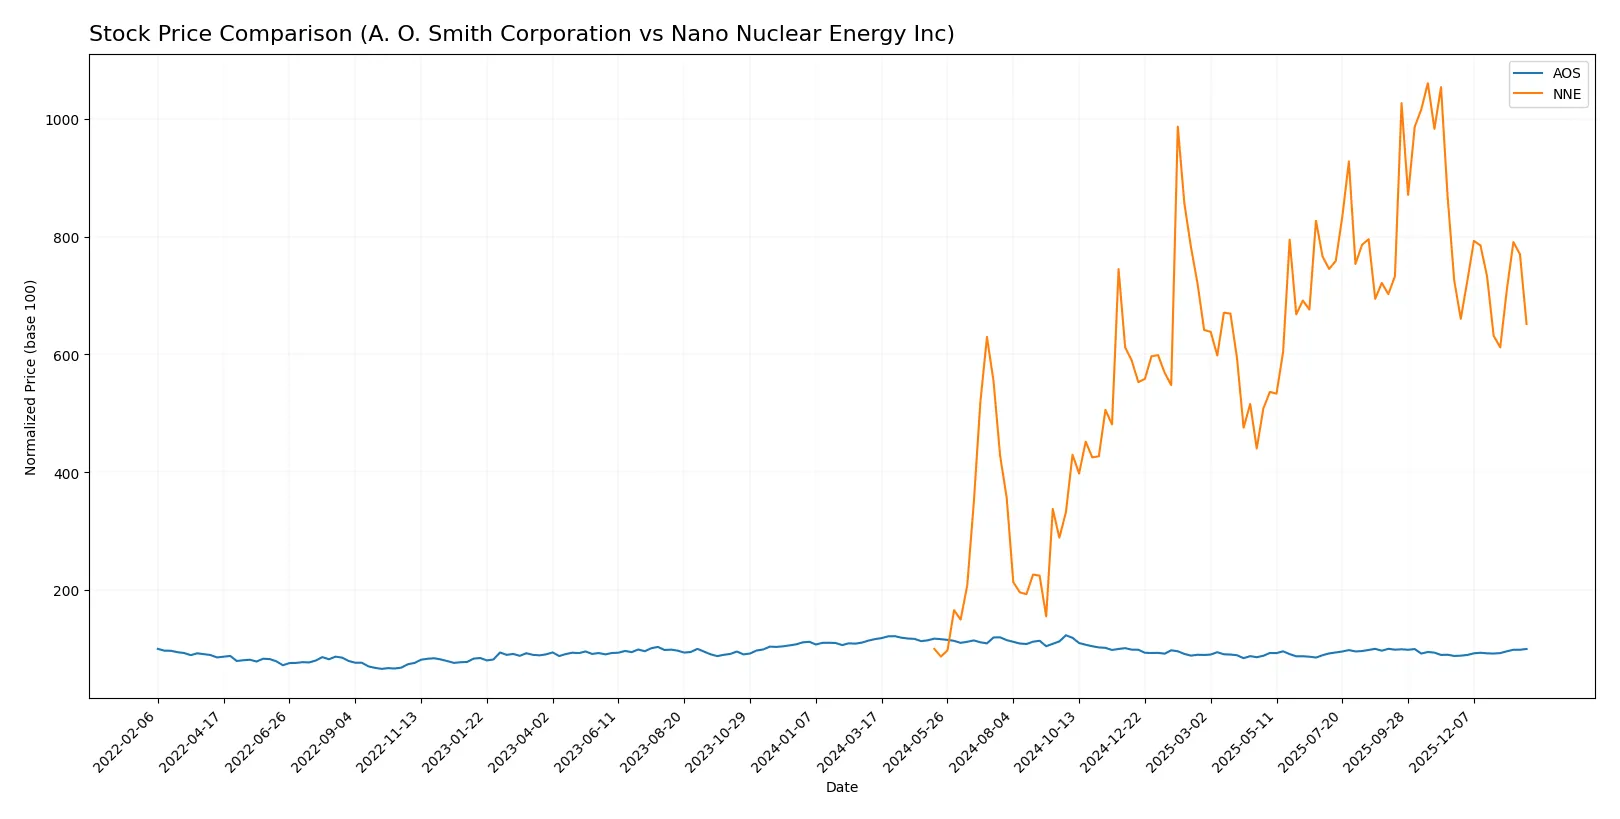
The past year reveals contrasting trajectories: A. O. Smith Corporation exhibits a prolonged bearish trend with recent recovery signs, while Nano Nuclear Energy Inc shows a massive rally followed by a recent pullback.
Trend Comparison
A. O. Smith Corporation’s stock declined 14.37% over the past year, marking a bearish trend with accelerating downward momentum. It reached a low of 61.99 and a high of 90.59, with recent gains of 13.52%.
Nano Nuclear Energy Inc surged 551.88% overall, reflecting a strong bullish trend though showing deceleration. The price oscillated between 3.92 and 47.84, but recently declined 10.26%, signaling short-term weakness.
Nano Nuclear Energy’s performance vastly outpaced A. O. Smith’s negative return. Despite recent setbacks, NNE delivered the highest market gains over the period analyzed.
Target Prices
Analysts present a clear consensus on target prices for A. O. Smith Corporation and Nano Nuclear Energy Inc.
| Company | Target Low | Target High | Consensus |
|---|---|---|---|
| A. O. Smith Corporation | 75 | 85 | 79 |
| Nano Nuclear Energy Inc | 50 | 50 | 50 |
A. O. Smith’s target consensus at 79 suggests upside potential from its current 73.49 price, reflecting steady industrial demand. Nano Nuclear Energy’s 50 target indicates strong bullish sentiment, significantly above its 29.40 market price.
How do institutions grade them?
A. O. Smith Corporation Grades
The following table summarizes recent institutional grades for A. O. Smith Corporation:
| Grading Company | Action | New Grade | Date |
|---|---|---|---|
| Stifel | Maintain | Buy | 2026-01-30 |
| Citigroup | Maintain | Neutral | 2026-01-30 |
| DA Davidson | Maintain | Neutral | 2025-11-13 |
| Stifel | Maintain | Buy | 2025-10-29 |
| Citigroup | Maintain | Neutral | 2025-10-29 |
| Oppenheimer | Maintain | Outperform | 2025-07-28 |
| UBS | Maintain | Neutral | 2025-07-28 |
| Baird | Maintain | Neutral | 2025-07-25 |
| Stifel | Maintain | Buy | 2025-07-25 |
| Stifel | Maintain | Buy | 2025-07-21 |
Nano Nuclear Energy Inc Grades
The following table summarizes recent institutional grades for Nano Nuclear Energy Inc:
| Grading Company | Action | New Grade | Date |
|---|---|---|---|
| HC Wainwright & Co. | Maintain | Buy | 2025-08-19 |
| Ladenburg Thalmann | Downgrade | Sell | 2025-08-18 |
| HC Wainwright & Co. | Maintain | Buy | 2025-08-15 |
| HC Wainwright & Co. | Maintain | Buy | 2025-03-31 |
| HC Wainwright & Co. | Maintain | Buy | 2025-01-29 |
| HC Wainwright & Co. | Maintain | Buy | 2024-11-27 |
| Benchmark | Maintain | Buy | 2024-11-07 |
| Benchmark | Maintain | Buy | 2024-07-15 |
| Benchmark | Maintain | Buy | 2024-06-25 |
Which company has the best grades?
A. O. Smith Corporation consistently receives neutral to buy ratings, including an outperform grade, signaling stable confidence. Nano Nuclear Energy Inc shows mostly buy ratings but includes a notable recent downgrade to sell, indicating mixed sentiment. Investors should weigh the steadiness in A. O. Smith’s grades against the variability in Nano Nuclear Energy’s outlook.

Don’t Let Luck Decide Your Entry Point
Optimize your entry points with our advanced ProRealTime indicators. You’ll get efficient buy signals with precise price targets for maximum performance. Start outperforming now!
Risks specific to each company
The following categories identify the critical pressure points and systemic threats facing both firms in the 2026 market environment:
1. Market & Competition
A. O. Smith Corporation
- Established player with diverse water heating products and global presence in mature markets.
Nano Nuclear Energy Inc
- Early-stage microreactor tech firm facing intense competition in a nascent, highly regulated nuclear sector.
2. Capital Structure & Debt
A. O. Smith Corporation
- Low debt-to-equity (0.09) and strong interest coverage (54x) indicate solid financial stability.
Nano Nuclear Energy Inc
- Minimal debt (0.01 D/E), but zero interest coverage suggests no current earnings to service debt.
3. Stock Volatility
A. O. Smith Corporation
- Beta of 1.35 implies moderate market volatility typical for industrials.
Nano Nuclear Energy Inc
- Beta of 7.49 signals extreme volatility, reflecting speculative investor sentiment.
4. Regulatory & Legal
A. O. Smith Corporation
- Operates in established, regulated markets with manageable compliance costs.
Nano Nuclear Energy Inc
- Faces stringent nuclear industry regulations and licensing hurdles that could delay commercialization.
5. Supply Chain & Operations
A. O. Smith Corporation
- Diverse supplier base supports stable operations; scale enables supply chain resilience.
Nano Nuclear Energy Inc
- Small scale (5 employees) and innovative tech increase operational risk and supply chain vulnerability.
6. ESG & Climate Transition
A. O. Smith Corporation
- Offers energy-efficient water heaters, aligning with climate goals, but legacy product lines may lag.
Nano Nuclear Energy Inc
- Nuclear tech aligns with zero-carbon goals, but faces public perception and waste disposal challenges.
7. Geopolitical Exposure
A. O. Smith Corporation
- Global footprint in stable regions with limited geopolitical risk.
Nano Nuclear Energy Inc
- US-focused operations reduce geopolitical risk but expose firm to domestic policy shifts on nuclear energy.
Which company shows a better risk-adjusted profile?
A. O. Smith’s established market position, consistent profitability, and conservative capital structure offer a superior risk-adjusted profile. Nano Nuclear Energy faces critical execution and regulatory risks amplified by extreme stock volatility. Its largest risk is the absence of earnings and regulatory uncertainty. A. O. Smith’s main risk lies in competitive pressures and evolving energy regulations. Recent data reveal Nano Nuclear’s beta of 7.49 and negative returns on equity sharply contrast with A. O. Smith’s favorable metrics, underscoring the risk disparity.
Final Verdict: Which stock to choose?
A. O. Smith Corporation’s superpower lies in its durable competitive advantage, consistently generating returns well above its cost of capital. Its solid cash flow and efficient capital use make it a reliable value creator. A point of vigilance remains its moderate valuation multiples, which could limit near-term upside. It suits portfolios seeking steady income and long-term growth.
Nano Nuclear Energy Inc commands attention through its potential in an emerging technology space, supported by a strong balance sheet and minimal debt. However, it currently sheds value and struggles with profitability, reflecting high execution risk. Compared to A. O. Smith, it offers less stability but could appeal to those with a high-risk, high-reward appetite.
If you prioritize proven value creation and financial stability, A. O. Smith outshines as the compelling choice due to its consistent profitability and robust moat. However, if you seek speculative growth driven by frontier innovation, Nano Nuclear Energy offers a unique but riskier opportunity. Each fits distinct investor profiles balancing safety against potential breakthrough gains.
Disclaimer: Investment carries a risk of loss of initial capital. The past performance is not a reliable indicator of future results. Be sure to understand risks before making an investment decision.
Go Further
I encourage you to read the complete analyses of A. O. Smith Corporation and Nano Nuclear Energy Inc to enhance your investment decisions: