Home > Comparison > Industrials > AOS vs KAI
The strategic rivalry between A. O. Smith Corporation and Kadant Inc. shapes the Industrials sector’s machinery landscape. A. O. Smith operates as a capital-intensive manufacturer of water heaters and treatment systems, while Kadant focuses on engineered systems and fluid-handling technologies with a leaner model. This head-to-head highlights a contest between broad industrial scale and specialized innovation. This analysis will reveal which company offers the superior risk-adjusted profile for diversified portfolios.
Table of contents
Companies Overview
A. O. Smith Corporation and Kadant Inc. both play pivotal roles in the industrial machinery sector, shaping the equipment landscape across diverse industries.
A. O. Smith Corporation: Global Water Heating Innovator
A. O. Smith dominates the residential and commercial water heating market, generating revenue through gas, electric, and heat pump water heaters. Its strategic focus in 2026 centers on expanding its global footprint, particularly in China and India, leveraging strong brand recognition and diversified product lines including water treatment and filtration systems.
Kadant Inc.: Engineered Systems Specialist
Kadant Inc. excels in supplying fluid-handling and industrial processing technologies worldwide. The company drives revenue through three core segments: Flow Control, Industrial Processing, and Material Handling. In 2026, Kadant emphasizes innovation in engineered systems and sustainability solutions, aiming to enhance operational efficiency for packaging, tissue, and wood product industries.
Strategic Collision: Similarities & Divergences
Both companies operate in the industrial machinery sector but diverge sharply in their approach. A. O. Smith pursues a broad consumer and commercial product strategy with a global reach, while Kadant focuses on highly engineered, specialized systems for industrial clients. Their battleground lies in technological innovation and operational efficiency. Investors will find A. O. Smith with a diversified revenue base, whereas Kadant offers a niche, technology-driven growth profile.
Income Statement Comparison
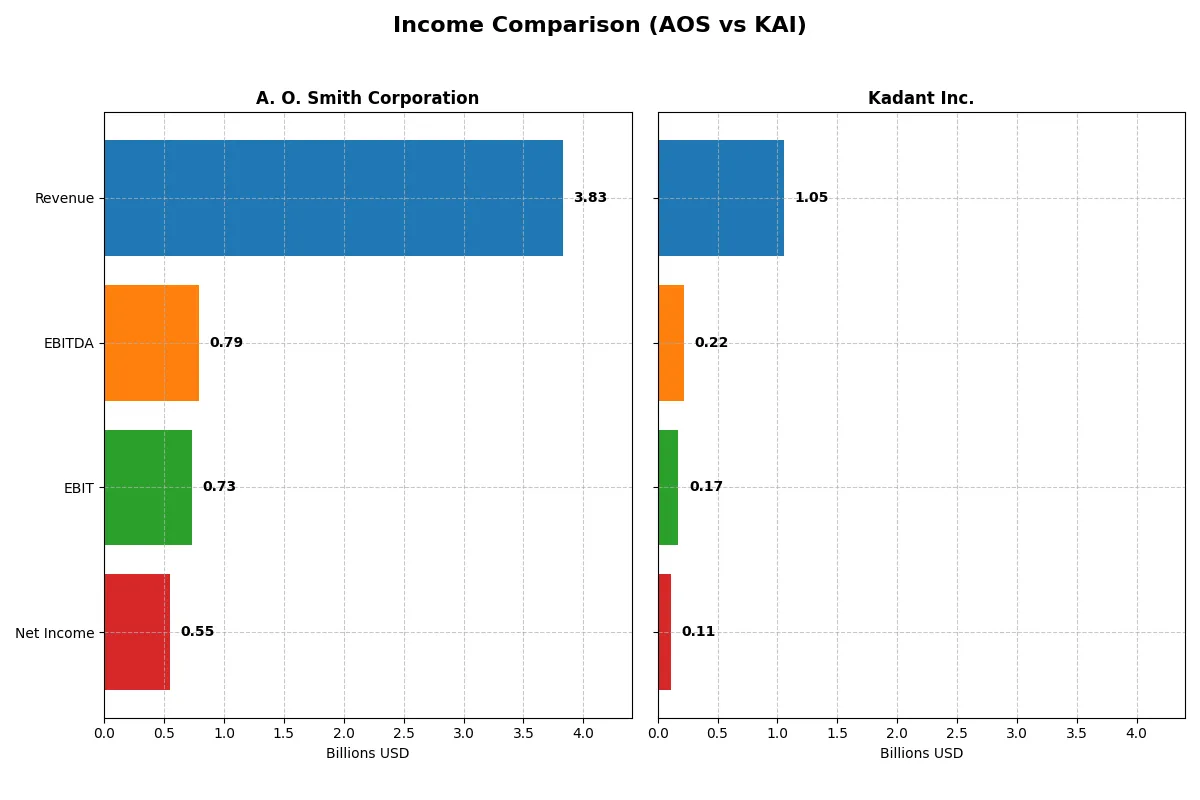
This data dissects the core profitability and scalability of both corporate engines to reveal who dominates the bottom line:
| Metric | A. O. Smith Corporation (AOS) | Kadant Inc. (KAI) |
|---|---|---|
| Revenue | 3.83B | 1.05B |
| Cost of Revenue | 2.34B | 587M |
| Operating Expenses | 759M | 294M |
| Gross Profit | 1.49B | 466M |
| EBITDA | 792M | 223M |
| EBIT | 729M | 173M |
| Interest Expense | 14M | 20M |
| Net Income | 546M | 112M |
| EPS | 3.86 | 9.51 |
| Fiscal Year | 2025 | 2024 |
Income Statement Analysis: The Bottom-Line Duel
The forthcoming income statement comparison reveals which company maximizes efficiency and profit from their revenue streams.
A. O. Smith Corporation Analysis
AOS shows steady revenue around 3.8B in recent years with net income rising from 487M in 2021 to 546M in 2025. Gross margin holds firm near 39%, signaling strong cost control. The company sustains solid net margins above 14%, reflecting operational discipline and improving earnings per share momentum.
Kadant Inc. Analysis
KAI exhibits robust revenue growth, reaching 1.05B in 2024 from 635M in 2020. Gross margin exceeds 44%, outperforming peers on production efficiency. Despite a net margin near 10.6%, recent EPS dipped slightly, indicating some margin pressure amid rising operating costs, yet the overall growth trajectory remains positive.
Margin Strength vs. Growth Momentum
AOS delivers consistently higher net margins, emphasizing profitability and operational efficiency. KAI impresses with rapid revenue and net income expansion but faces margin compression risks. For investors prioritizing stable profit generation, AOS’s profile offers reliability. Growth seekers may find KAI’s dynamic top-line momentum more compelling despite short-term margin challenges.
Financial Ratios Comparison
These vital ratios act as a diagnostic tool to expose the underlying fiscal health, valuation premiums, and capital efficiency of the companies compared below:
| Ratios | A. O. Smith Corporation (AOS) | Kadant Inc. (KAI) |
|---|---|---|
| ROE | 25.6% | 13.2% |
| ROIC | 23.9% | 10.1% |
| P/E | 17.1 | 36.9 |
| P/B | 4.39 | 4.86 |
| Current Ratio | 1.50 | 2.31 |
| Quick Ratio | 0.94 | 1.55 |
| D/E (Debt-to-Equity) | 0.09 | 0.38 |
| Debt-to-Assets | 6.1% | 22.6% |
| Interest Coverage | 53.9 | 8.55 |
| Asset Turnover | 1.22 | 0.74 |
| Fixed Asset Turnover | 5.62 | 6.18 |
| Payout ratio | 35.8% | 13.1% |
| Dividend yield | 2.09% | 0.36% |
| Fiscal Year | 2025 | 2024 |
Efficiency & Valuation Duel: The Vital Signs
Financial ratios act as a company’s DNA, exposing hidden risks and signaling operational excellence to investors.
A. O. Smith Corporation
AOS demonstrates robust profitability with a 25.64% ROE and a strong 14.26% net margin, indicating efficient operations. The valuation appears reasonable at a 17.13 P/E, though a 4.39 PB ratio signals some premium pricing. The 2.09% dividend yield rewards shareholders, reflecting disciplined capital allocation.
Kadant Inc.
KAI shows moderate profitability with a 13.17% ROE and 10.59% net margin, suggesting steady but less efficient returns. The stock trades at a stretched 36.9 P/E and a 4.86 PB, implying expensive valuation. A low 0.36% dividend yield hints at limited direct shareholder returns, possibly favoring reinvestment.
Balanced Efficiency vs. Premium Valuation
AOS offers a superior blend of profitability and fair valuation, balancing risk and reward better than KAI’s expensive multiples and modest returns. Investors seeking operational strength and income may prefer AOS, while those tolerating valuation risk might consider KAI’s growth potential.
Which one offers the Superior Shareholder Reward?
I compare A. O. Smith Corporation (AOS) and Kadant Inc. (KAI) on dividends, payout ratios, and buybacks. AOS yields 2.1% with a stable 36% payout ratio, supported by strong free cash flow coverage (~88%). KAI yields a meager 0.36% with a 13% payout ratio, signaling minimal dividend focus. Both run robust buyback programs, but AOS’s balanced dividend and buyback mix offers more sustainable, shareholder-friendly returns. KAI reinvests heavily in growth, but its higher valuation multiples (P/E ~29 vs. AOS’s ~17) and lower yield limit near-term reward. I favor AOS for a superior total return profile in 2026.
Comparative Score Analysis: The Strategic Profile
The radar chart reveals the fundamental DNA and trade-offs of both firms, highlighting their core strengths and vulnerabilities:
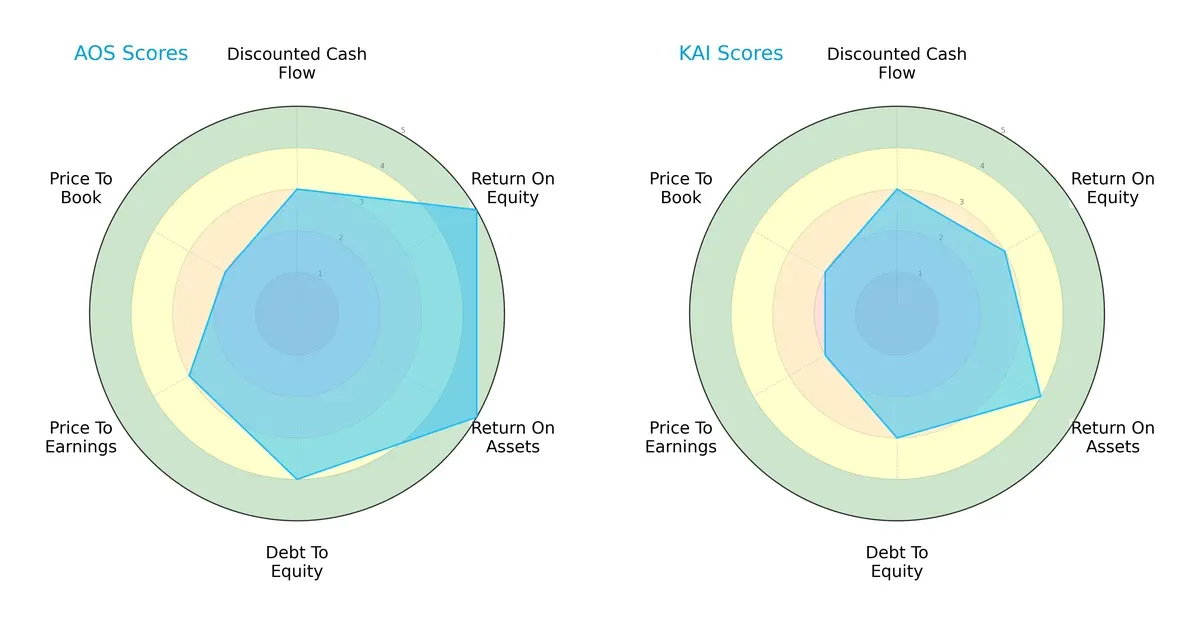
A. O. Smith Corporation (AOS) excels with very favorable ROE and ROA scores (5 each), showing superior profitability and asset utilization. Its debt-to-equity score (4) indicates prudent leverage management. Kadant Inc. (KAI) presents a more moderate profile, with balanced scores but no standout edge. AOS shows a more balanced and robust financial profile, while KAI depends on moderate operational efficiency and moderate leverage.
Bankruptcy Risk: Solvency Showdown
The Altman Z-Scores place both firms safely above distress thresholds, but AOS’s 8.33 score signals stronger financial stability compared to KAI’s 6.07:
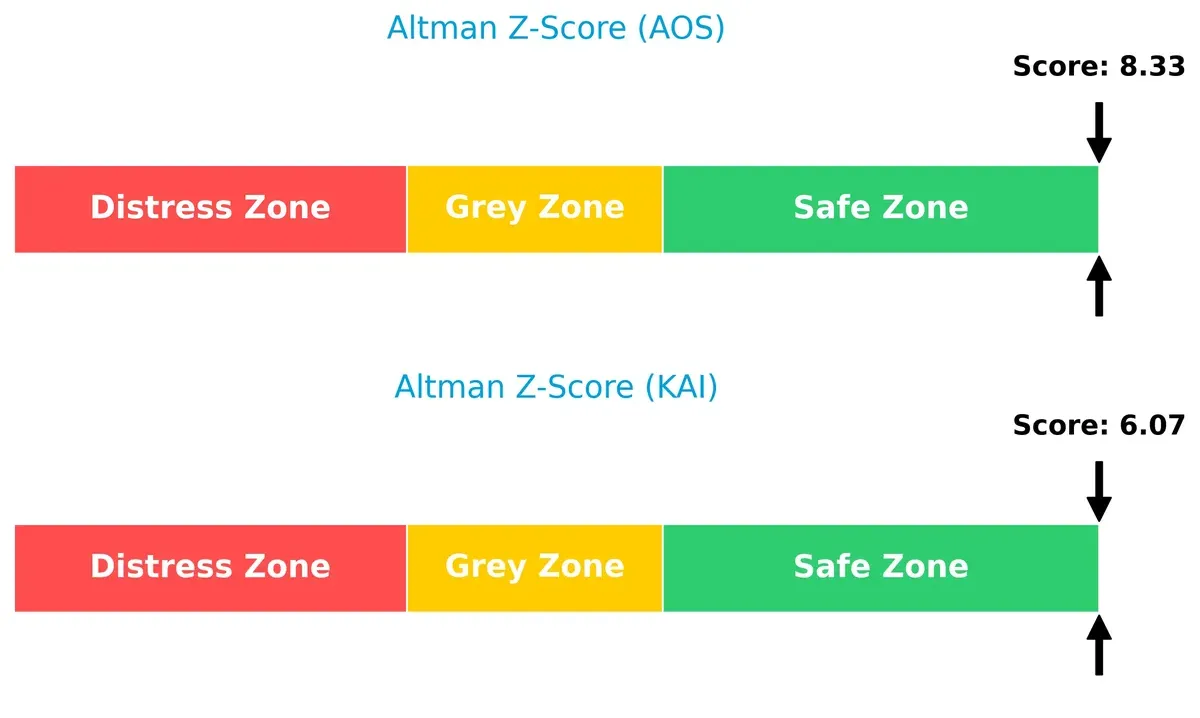
AOS’s higher Z-Score suggests it is more resilient against bankruptcy risk in this economic cycle. KAI remains safe but with a thinner margin.
Financial Health: Quality of Operations
Both companies score a strong 7 on the Piotroski F-Score, indicating solid financial health and operational quality:
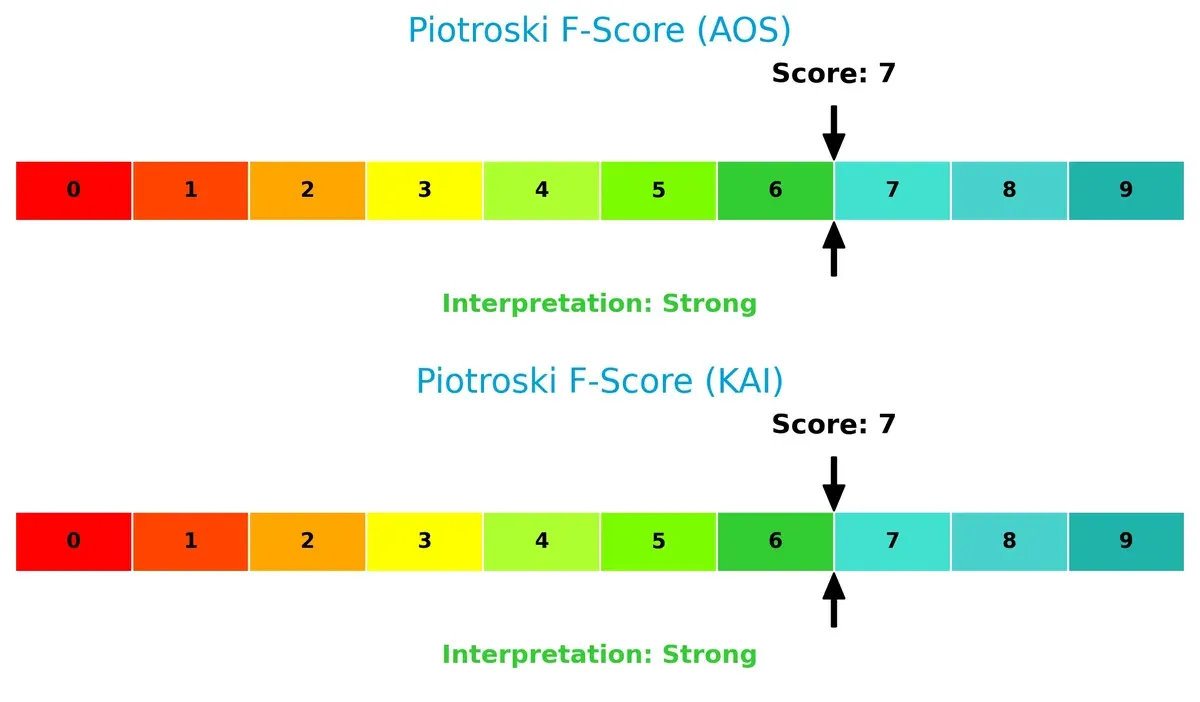
Neither firm shows red flags internally. Their strong Piotroski scores reflect efficient profitability, liquidity, and leverage management, supporting sustained value creation.
How are the two companies positioned?
This section dissects the operational DNA of AOS and KAI by comparing their revenue distribution and internal strengths and weaknesses. The goal is to confront their economic moats, revealing which model offers the most resilient, sustainable advantage today.
Revenue Segmentation: The Strategic Mix
This visual comparison dissects how A. O. Smith Corporation and Kadant Inc. diversify their income streams and where their primary sector bets lie:
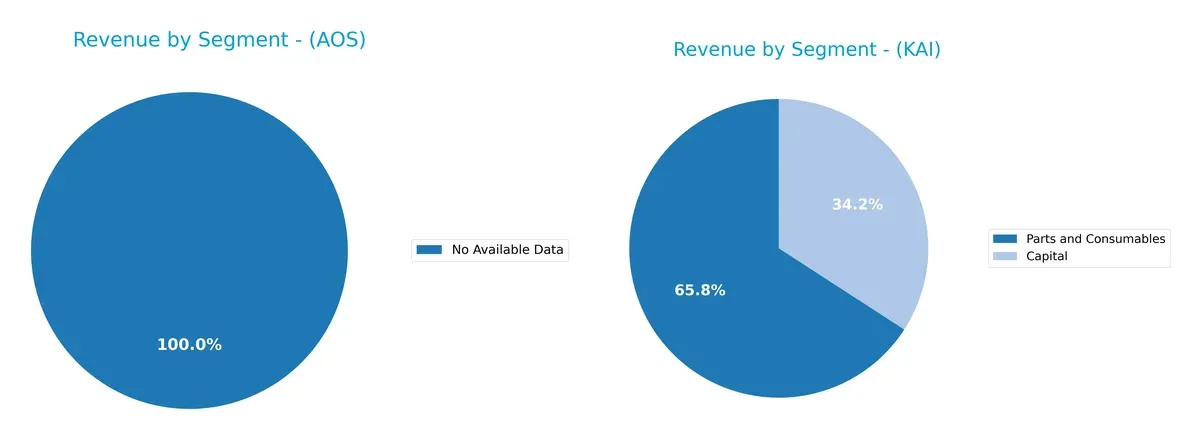
A. O. Smith’s segmentation data is unavailable, limiting direct comparison. Kadant leans heavily on Parts and Consumables, generating $694M in 2024, overshadowing $360M from Capital. This concentration anchors Kadant’s business model in aftermarket and recurring revenue, reducing cyclicality risk. Without A. O. Smith’s data, I see Kadant’s focus as a strategic bet on infrastructure dominance through service continuity.
Strengths and Weaknesses Comparison
This table compares the strengths and weaknesses of A. O. Smith Corporation and Kadant Inc.:
A. O. Smith Corporation Strengths
- Strong profitability with 14.26% net margin and 25.64% ROE
- Low debt levels with 0.09 debt-to-equity ratio
- High interest coverage at 54.03
- Consistent global presence with $3.82B revenue diversified across North America and Rest of World
Kadant Inc. Strengths
- Favorable liquidity ratios with 2.31 current and 1.55 quick ratio
- Balanced debt structure with 0.38 debt-to-equity
- Solid capital allocation supported by 6.18 fixed asset turnover
- Diverse geographic revenue including North America, Europe, and Asia totaling $1.05B
A. O. Smith Corporation Weaknesses
- Unfavorable weighted average cost of capital at 10.08% above ROIC
- Elevated price-to-book ratio at 4.39
- Neutral quick ratio at 0.94 may limit short-term flexibility
- Limited disclosed product diversification data
Kadant Inc. Weaknesses
- High price-to-earnings ratio at 36.9 signals expensive valuation
- Low dividend yield at 0.36% reduces income appeal
- Moderate asset turnover at 0.74 indicates less efficient asset use
- Narrower product segmentation with concentration in Capital and Parts
AOS demonstrates superior profitability and financial leverage control, benefiting from broad geographic reach. KAI shows stronger liquidity and asset utilization in fixed assets but faces valuation and income yield challenges. These contrasts highlight differing strategic priorities and operational focuses.
The Moat Duel: Analyzing Competitive Defensibility
A structural moat protects long-term profits from competition’s relentless erosion. Without it, sustainable returns vanish quickly. Let’s dissect the moats of two industrial machinery firms:
A. O. Smith Corporation: Durable Efficiency Moat
AOS leverages cost advantage and brand reputation, reflected in a robust 19% EBIT margin and 14% net margin. Its ROIC exceeds WACC by nearly 14%, signaling strong value creation. Expansion in global water treatment and heat pump markets could deepen this moat in 2026.
Kadant Inc.: Emerging Innovation Moat
KAI’s moat stems from specialized engineered systems and product mix diversification. Despite a lower margin profile than AOS, its ROIC trend grows 31%, showing improving capital efficiency. Rapid revenue growth and new industrial automation solutions may disrupt markets and strengthen its position.
Cost Leadership vs. Innovation Momentum
AOS commands a wider and more durable moat, proven by consistent returns well above cost of capital. KAI’s moat is narrower but improving, driven by innovation and market expansion. AOS remains better equipped to defend its established market share through operational excellence.
Which stock offers better returns?
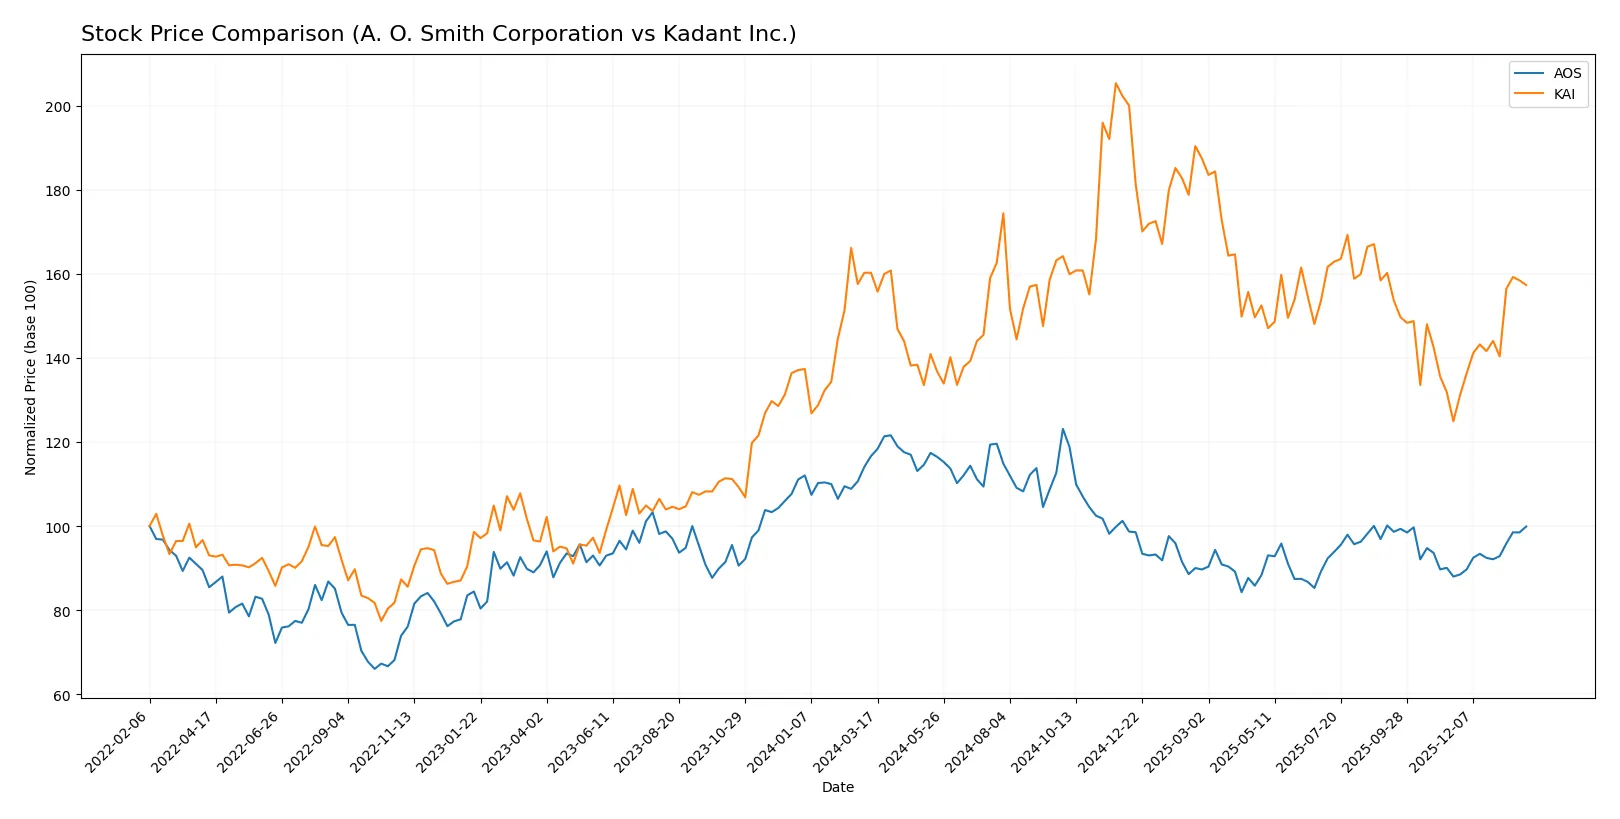
Over the past year, both stocks experienced notable price swings, with A. O. Smith Corporation showing a sustained downtrend and Kadant Inc. maintaining relative stability despite volatility.
Trend Comparison
A. O. Smith Corporation’s stock fell 14.37% over the last 12 months, marking a bearish trend with accelerating decline and moderate volatility. It reached a high of 90.59 and a low of 61.99.
Kadant Inc.’s stock declined 1.82% over the same period, indicating a bearish but near-neutral trend amid high volatility. The price ranged from 254.91 to 419.01, with acceleration in downward movement.
Kadant’s stock outperformed A. O. Smith overall, delivering a smaller loss and showing stronger recent upward momentum, despite both ending the year below their starting prices.
Target Prices
Analysts present a confident target consensus for both A. O. Smith Corporation and Kadant Inc.
| Company | Target Low | Target High | Consensus |
|---|---|---|---|
| A. O. Smith Corporation | 75 | 85 | 79 |
| Kadant Inc. | 275 | 410 | 342.5 |
A. O. Smith’s target consensus sits above its current price of 73.49, indicating moderate upside potential. Kadant’s consensus target of 342.5 also suggests room for growth from the current 321.04 price.

Don’t Let Luck Decide Your Entry Point
Optimize your entry points with our advanced ProRealTime indicators. You’ll get efficient buy signals with precise price targets for maximum performance. Start outperforming now!
How do institutions grade them?
A. O. Smith Corporation Grades
The table below summarizes recent grades assigned to A. O. Smith Corporation by well-known institutions.
| Grading Company | Action | New Grade | Date |
|---|---|---|---|
| Stifel | Maintain | Buy | 2026-01-30 |
| Citigroup | Maintain | Neutral | 2026-01-30 |
| DA Davidson | Maintain | Neutral | 2025-11-13 |
| Stifel | Maintain | Buy | 2025-10-29 |
| Citigroup | Maintain | Neutral | 2025-10-29 |
| Oppenheimer | Maintain | Outperform | 2025-07-28 |
| UBS | Maintain | Neutral | 2025-07-28 |
| Baird | Maintain | Neutral | 2025-07-25 |
| Stifel | Maintain | Buy | 2025-07-25 |
| Stifel | Maintain | Buy | 2025-07-21 |
Kadant Inc. Grades
Below is a summary of recent grades for Kadant Inc. from recognized grading companies.
| Grading Company | Action | New Grade | Date |
|---|---|---|---|
| Barrington Research | Maintain | Outperform | 2025-10-30 |
| Barrington Research | Maintain | Outperform | 2025-10-29 |
| Barrington Research | Maintain | Outperform | 2025-10-27 |
| Barrington Research | Maintain | Outperform | 2025-10-10 |
| Barrington Research | Maintain | Outperform | 2025-09-23 |
| DA Davidson | Maintain | Neutral | 2025-08-04 |
| Barrington Research | Maintain | Outperform | 2025-07-30 |
| Barrington Research | Maintain | Outperform | 2025-07-29 |
| Barrington Research | Maintain | Outperform | 2025-05-01 |
| DA Davidson | Maintain | Neutral | 2025-05-01 |
Which company has the best grades?
Kadant Inc. consistently receives “Outperform” ratings, indicating stronger analyst conviction than A. O. Smith Corporation’s mixed “Buy,” “Neutral,” and “Outperform” grades. This difference could influence investor sentiment and perceived growth potential.
Risks specific to each company
The following categories identify the critical pressure points and systemic threats facing both firms in the 2026 market environment:
1. Market & Competition
A. O. Smith Corporation
- Faces intense competition in residential and commercial water heating segments globally.
Kadant Inc.
- Operates in niche industrial machinery markets with specialized products, facing moderate competitive pressure.
2. Capital Structure & Debt
A. O. Smith Corporation
- Maintains a low debt-to-equity ratio (0.09), signaling conservative leverage and financial stability.
Kadant Inc.
- Higher debt-to-equity ratio (0.38) but manageable with solid interest coverage (8.64x).
3. Stock Volatility
A. O. Smith Corporation
- Beta of 1.35 indicates above-market volatility, reflecting sensitivity to economic cycles.
Kadant Inc.
- Slightly lower beta at 1.25 suggests marginally less stock price volatility.
4. Regulatory & Legal
A. O. Smith Corporation
- Subject to product safety and environmental regulations in multiple jurisdictions, increasing compliance costs.
Kadant Inc.
- Faces regulations related to industrial emissions and product safety, but with fewer global exposures.
5. Supply Chain & Operations
A. O. Smith Corporation
- Global operations expose it to raw material price fluctuations and logistic disruptions.
Kadant Inc.
- Supply chain concentrated on specialized components, vulnerable to supplier availability and price volatility.
6. ESG & Climate Transition
A. O. Smith Corporation
- Increasing pressure to innovate energy-efficient products amid tightening climate regulations.
Kadant Inc.
- ESG initiatives advancing but slower pace; industrial focus limits immediate climate transition risks.
7. Geopolitical Exposure
A. O. Smith Corporation
- Significant exposure to China and Europe markets, vulnerable to trade tensions and tariffs.
Kadant Inc.
- Primarily North American focus, reducing geopolitical risk but still exposed to US economic policy shifts.
Which company shows a better risk-adjusted profile?
A. O. Smith’s most impactful risk lies in its geopolitical exposure and related supply chain complexities. Kadant’s key risk is elevated leverage combined with its narrower product focus. Despite A. O. Smith’s higher volatility, its conservative capital structure and stronger profitability create a better risk-adjusted profile. Kadant’s higher P/E and debt ratios signal more vulnerability. The widening valuation gap underscores my caution on Kadant’s financial resilience.
Final Verdict: Which stock to choose?
A. O. Smith Corporation’s superpower lies in its robust capital efficiency and consistent value creation. Its durable moat is reflected in a strong ROIC well above WACC, signaling sustainable profitability. A point of vigilance is its moderate valuation multiples, which could temper near-term upside. It suits portfolios focused on steady, disciplined growth.
Kadant Inc. commands a strategic moat through its niche specialization and improving profitability, supported by a solid current ratio that underscores financial safety. While its ROIC lags WACC, the company’s growth trajectory appears promising. It fits growth-at-a-reasonable-price (GARP) portfolios seeking exposure to emerging operational improvements.
If you prioritize stable capital allocation and consistent value creation, A. O. Smith outshines due to its durable competitive advantage and favorable financial metrics. However, if you seek higher growth potential with a margin of safety, Kadant offers better stability and an accelerating profitability trend despite a thinner moat. Each presents a distinct analytical scenario tailored to different investor risk appetites.
Disclaimer: Investment carries a risk of loss of initial capital. The past performance is not a reliable indicator of future results. Be sure to understand risks before making an investment decision.
Go Further
I encourage you to read the complete analyses of A. O. Smith Corporation and Kadant Inc. to enhance your investment decisions: