Home > Comparison > Industrials > AOS vs JBTM
The strategic rivalry between A. O. Smith Corporation and JBT Marel Corporation shapes the industrial machinery sector’s evolution. A. O. Smith operates as a capital-intensive manufacturer specializing in water heaters and treatment solutions, while JBT Marel focuses on high-tech processing equipment for food and beverage industries. This analysis pits traditional manufacturing against advanced technology integration to identify the superior risk-adjusted investment opportunity for diversified portfolios.
Table of contents
Companies Overview
A. O. Smith Corporation and JBT Marel Corporation are key players shaping the industrial machinery landscape.
A. O. Smith Corporation: Leading Water Heating and Treatment Solutions
A. O. Smith Corporation dominates the residential and commercial water heating market, generating revenue chiefly from gas, electric, and heat pump water heaters. Its strategic focus in 2026 centers on expanding water treatment products and enhancing energy-efficient technologies across North America, China, Europe, and India, reinforcing its broad geographic footprint and diversified product portfolio.
JBT Marel Corporation: Innovator in Food and Beverage Processing
JBT Marel Corporation stands out as a specialist in advanced technology solutions for food and beverage processing. Its core revenue derives from automation and processing equipment across multiple segments, including poultry, meat, and pharma. The company’s 2026 strategy emphasizes innovation in automation and material handling systems to capture greater share in global food manufacturing and life sciences markets.
Strategic Collision: Similarities & Divergences
Both companies operate in industrial machinery but pursue distinct philosophies: A. O. Smith focuses on energy-efficient, end-user solutions, while JBT Marel drives growth through technology-led processing automation. Their primary battleground lies in industrial innovation—one in building systems, the other in food tech. This divergence creates contrasting investment profiles, balancing steady product demand against dynamic industrial automation growth.
Income Statement Comparison
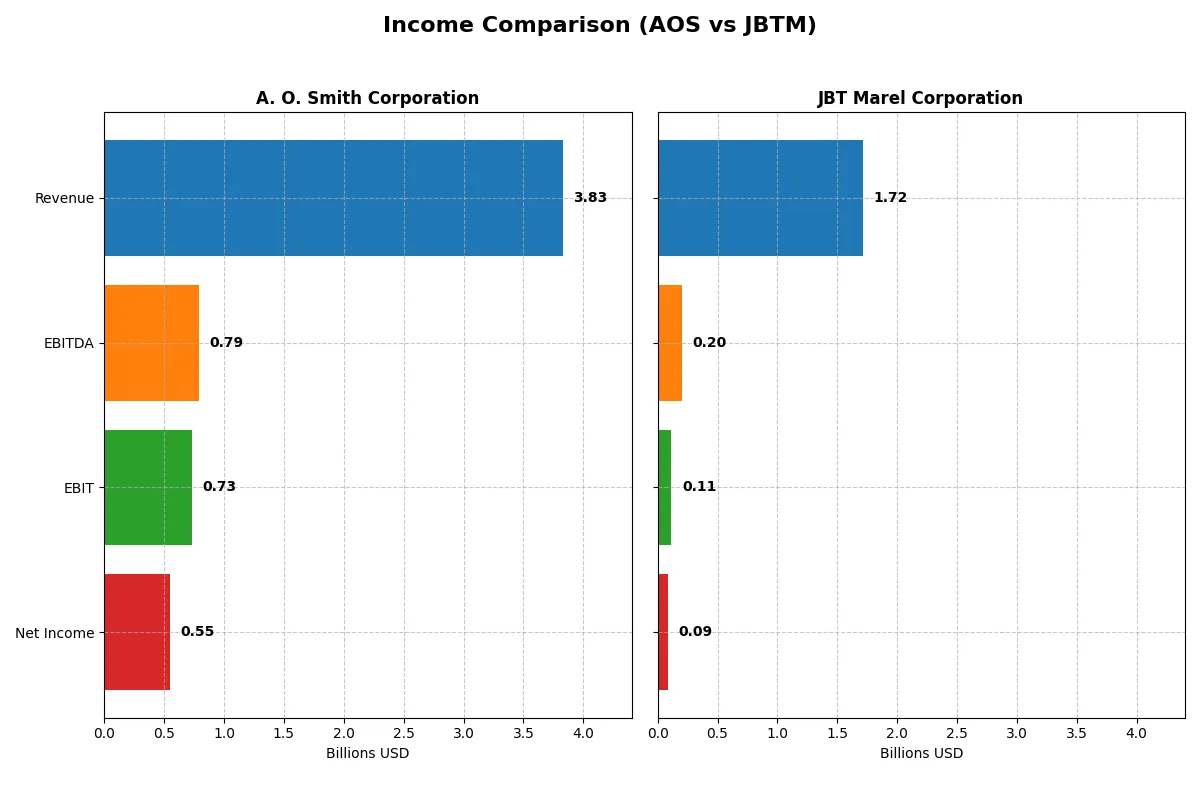
This data dissects the core profitability and scalability of both corporate engines to reveal who dominates the bottom line:
| Metric | A. O. Smith Corporation (AOS) | JBT Marel Corporation (JBTM) |
|---|---|---|
| Revenue | 3.83B | 1.72B |
| Cost of Revenue | 2.34B | 1.09B |
| Operating Expenses | 759M | 508M |
| Gross Profit | 1.49B | 627M |
| EBITDA | 792M | 204M |
| EBIT | 729M | 115M |
| Interest Expense | 13.5M | 19.4M |
| Net Income | 546M | 85.4M |
| EPS | 3.86 | 2.67 |
| Fiscal Year | 2025 | 2024 |
Income Statement Analysis: The Bottom-Line Duel
This income statement comparison reveals the true efficiency and profitability of two distinct corporate engines over recent years.
A. O. Smith Corporation Analysis
A. O. Smith’s revenue modestly increased from 3.54B in 2021 to 3.83B in 2025, reflecting steady growth. Net income improved strongly from 487M to 546M, underpinning a robust net margin of 14.3% in 2025. Gross and EBIT margins remain favorable at 38.8% and 19.0%, respectively, highlighting efficient cost control and sustained profitability momentum.
JBT Marel Corporation Analysis
JBT Marel’s revenue fluctuated around 1.4B-1.7B between 2020 and 2024, but net income declined from 119M in 2021 to 85M in 2024. The company’s gross margin at 36.5% is decent, but EBIT margin weakened to 6.7%, reflecting margin pressure. Recent year losses in net margin and EPS growth indicate deteriorating operational efficiency and profitability challenges.
Margin Strength vs. Earnings Consistency
A. O. Smith clearly outperforms JBT Marel across revenue and profit growth, sustaining superior margins and earnings efficiency. JBT Marel’s shrinking net income and margin erosion mark a fundamental weakness. Investors seeking stable earnings and margin resilience find A. O. Smith’s profile more attractive due to its consistent upward trajectory and profitability discipline.
Financial Ratios Comparison
These vital ratios act as a diagnostic tool to expose the underlying fiscal health, valuation premiums, and capital efficiency of the companies compared below:
| Ratios | A. O. Smith Corporation (AOS) | JBT Marel Corporation (JBTM) |
|---|---|---|
| ROE | 25.6% | 5.5% |
| ROIC | 23.9% | 3.7% |
| P/E | 17.1 | 47.6 |
| P/B | 4.39 | 2.63 |
| Current Ratio | 1.50 | 3.48 |
| Quick Ratio | 0.94 | 3.04 |
| D/E | 0.09 | 0.81 |
| Debt-to-Assets | 6.1% | 36.7% |
| Interest Coverage | 53.9 | 6.1 |
| Asset Turnover | 1.22 | 0.50 |
| Fixed Asset Turnover | 5.62 | 7.34 |
| Payout Ratio | 35.8% | 15.3% |
| Dividend Yield | 2.09% | 0.32% |
| Fiscal Year | 2025 | 2024 |
Efficiency & Valuation Duel: The Vital Signs
Ratios act as a company’s DNA, exposing hidden risks and operational excellence critical for sound investment decisions.
A. O. Smith Corporation
AOS demonstrates strong profitability with a 25.64% ROE and a solid 14.26% net margin, signaling efficiency. Its P/E of 17.13 appears reasonable, neither stretched nor cheap. The company rewards shareholders with a 2.09% dividend yield, balancing income with reinvestment in growth and capital discipline.
JBT Marel Corporation
JBTM shows weaker profitability metrics: a 5.53% ROE and 4.98% net margin, reflecting operational challenges. Its P/E of 47.63 suggests the stock is expensive relative to earnings. The dividend yield is minimal at 0.32%, indicating limited shareholder returns and likely focus on restructuring or growth investments.
Premium Valuation vs. Operational Safety
AOS offers a more attractive balance of profitability, valuation, and shareholder returns, reducing risk compared to JBTM’s stretched valuation and weaker margins. Investors prioritizing steady income and operational strength may find AOS’s profile more fitting.
Which one offers the Superior Shareholder Reward?
A. O. Smith Corporation (AOS) delivers a more balanced and sustainable shareholder reward than JBT Marel Corporation (JBTM). AOS pays a healthy 2.1% dividend yield with a moderate 36% payout ratio, well-covered by free cash flow at 88%. It complements dividends with steady buybacks, supporting long-term value. JBTM yields a meager 0.3% with a low 15% payout ratio, favoring reinvestment over distributions. However, JBTM’s heavy debt (debt-to-assets ~37%) and weaker cash flow coverage raise sustainability concerns. I conclude AOS offers a superior total return profile for income and growth-focused investors in 2026.
Comparative Score Analysis: The Strategic Profile
The radar chart reveals the fundamental DNA and trade-offs of A. O. Smith Corporation and JBT Marel Corporation, showcasing their financial strengths and vulnerabilities:
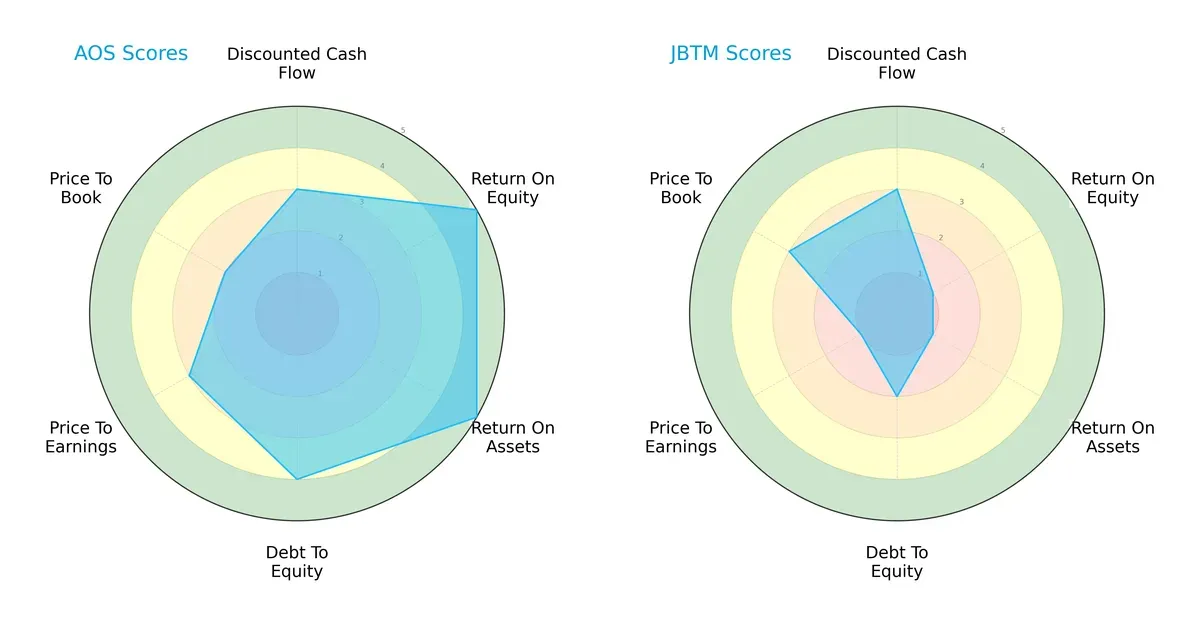
AOS exhibits a balanced profile with strong ROE and ROA scores (5 each) indicating efficient profit generation and asset use. Its moderate DCF (3) and debt-to-equity (4) scores suggest prudent valuation and solid financial stability. Conversely, JBTM relies heavily on moderate DCF (3) but suffers from very low ROE and ROA scores (1 each), signaling operational inefficiency. JBTM’s weaker debt-to-equity (2) and valuation metrics further highlight its riskier stance. AOS clearly dominates with a more robust and diversified financial profile.
Bankruptcy Risk: Solvency Showdown
The Altman Z-Score differential signals stark contrasts in long-term survival prospects in this economic cycle:
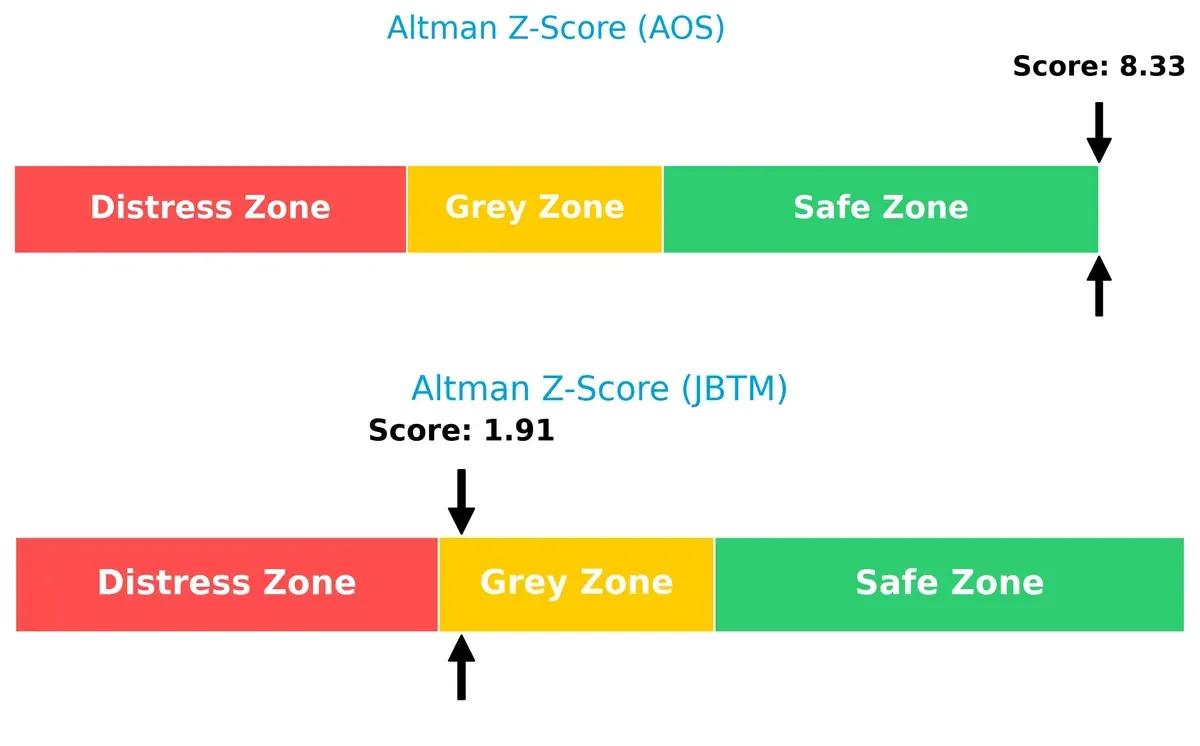
AOS stands firmly in the safe zone with a Z-Score above 8, reflecting strong solvency and low bankruptcy risk. JBTM’s score near 1.9 places it in the grey zone, indicating moderate financial distress and vulnerability if market conditions worsen.
Financial Health: Quality of Operations
Piotroski F-Scores reveal internal operational quality and financial strength:
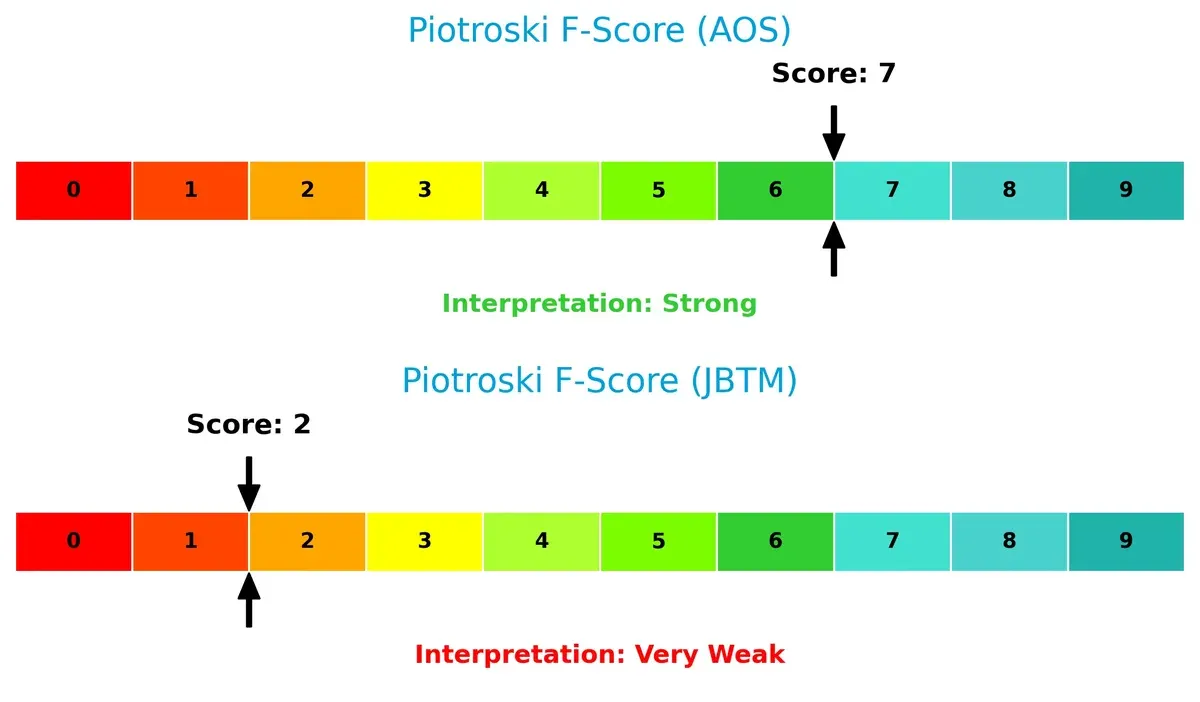
AOS scores a strong 7, reflecting solid profitability, liquidity, and efficiency. JBTM’s very weak score of 2 is a red flag, signaling poor internal metrics and potential financial distress. This gap underscores AOS’s superior operational health compared to JBTM.
How are the two companies positioned?
This section dissects AOS and JBTM’s operational DNA by comparing revenue distribution and internal dynamics. It aims to confront their economic moats to reveal which model offers a more resilient, sustainable advantage today.
Strengths and Weaknesses Comparison
This table compares the Strengths and Weaknesses of A. O. Smith Corporation and JBT Marel Corporation:
A. O. Smith Corporation Strengths
- Strong profitability with 14.26% net margin
- High ROE at 25.64% and ROIC at 23.94%
- Low debt-to-assets at 6.11% and strong interest coverage
- Consistent global presence with stable North America and Rest of World revenues
- Efficient asset turnover ratios
- Favorable dividend yield of 2.09%
JBT Marel Corporation Strengths
- Favorable WACC at 7.53% supports capital efficiency
- Strong quick ratio at 3.04 indicating liquidity
- High fixed asset turnover at 7.34
- Favorable interest coverage ratio at 5.92
- Neutral debt levels and moderate market valuation
A. O. Smith Corporation Weaknesses
- Elevated WACC at 10.08% raises capital cost concerns
- Unfavorable price-to-book ratio of 4.39 indicates potential overvaluation
- Quick ratio below 1 at 0.94 suggests liquidity caution
- Neutral current ratio at 1.5 limits short-term flexibility
JBT Marel Corporation Weaknesses
- Low profitability metrics with net margin at 4.98%, ROE at 5.53%, and ROIC at 3.65%
- High price-to-earnings ratio of 47.63 signals possible overvaluation
- High current ratio at 3.48 may indicate inefficient asset use
- Low dividend yield at 0.32% reduces income appeal
Overall, A. O. Smith exhibits strong profitability and conservative leverage but faces capital cost and valuation challenges. JBT Marel shows liquidity strengths and capital efficiency but struggles with low profitability and valuation risks. These factors will shape each company’s strategic priorities moving forward.
The Moat Duel: Analyzing Competitive Defensibility
A structural moat is the only reliable shield protecting long-term profits from relentless competitive erosion. Let’s dissect the moats of two industrial machinery players:
A. O. Smith Corporation: Durable Value Creator via Capital Efficiency
AOS’s moat stems from superior capital allocation and brand strength, reflected in a 14.3% net margin and ROIC exceeding WACC by nearly 14%. Its growing ROIC trend signals expanding profitability. New water treatment and energy-efficient product lines could deepen this moat in 2026.
JBT Marel Corporation: Struggling Cost Position with Weak Profitability
JBTM relies on technological solutions but lacks AOS’s capital efficiency. Its negative ROIC trend and 5% net margin reveal value destruction. Despite broad industry exposure, recent EBIT and EPS declines warn of structural challenges. Strategic innovation is critical to halt erosion in 2026.
ROIC Superiority vs. Innovation Necessity: Who Defends Market Share Better?
AOS’s wider and deeper moat rests on disciplined capital use and margin stability. JBTM’s declining ROIC and profitability expose it to competitive threats. I see AOS as far better equipped to defend and grow its market share through 2026.
Which stock offers better returns?
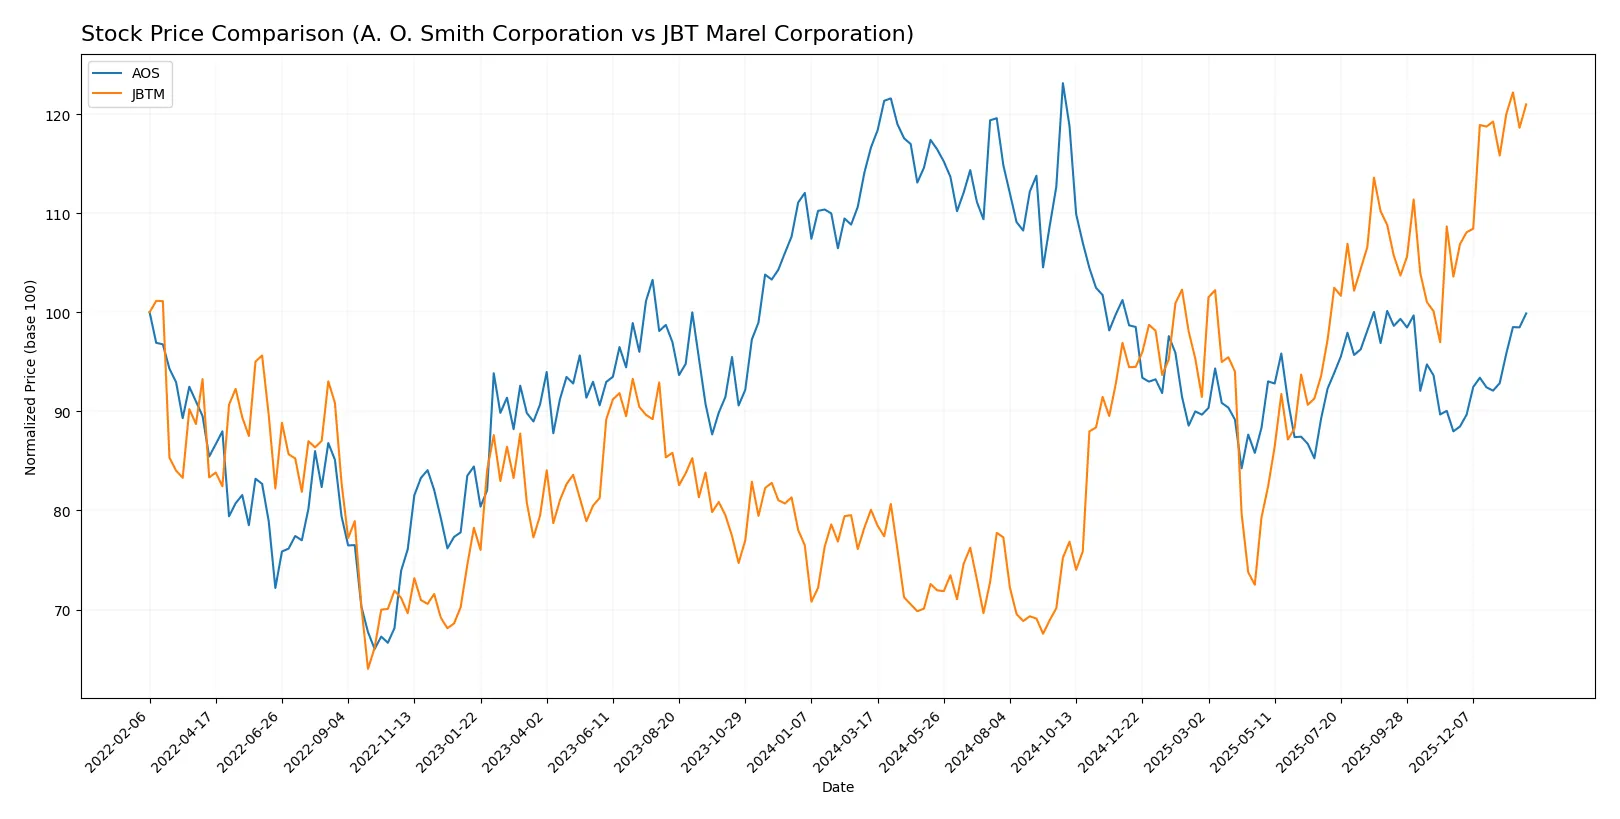
The past year shows divergent price dynamics: A. O. Smith Corporation faced a sharp decline overall, while JBT Marel Corporation posted robust gains with accelerating momentum.
Trend Comparison
A. O. Smith Corporation’s stock declined 14.37% over the past 12 months, marking a bearish trend with accelerating downside and a price range between 62 and 91. Recent months saw a 13.52% rebound.
JBT Marel Corporation’s stock rose 51.1% over the same period, confirming a bullish trend with accelerating gains and higher volatility. The price fluctuated between 88 and 159, with a recent 16.79% increase.
JBT Marel clearly outperformed A. O. Smith, delivering the strongest market returns and sustained upward momentum during the past year.
Target Prices
Analysts project moderate upside potential for both A. O. Smith Corporation and JBT Marel Corporation based on current consensus targets.
| Company | Target Low | Target High | Consensus |
|---|---|---|---|
| A. O. Smith Corporation | 75 | 85 | 79 |
| JBT Marel Corporation | 169 | 180 | 174.5 |
The target consensus for AOS suggests a 7% upside from the current price of $73.49. JBTM’s consensus target at $174.5 implies an 11% gain from its current $157.31. Both stocks show analyst confidence exceeding recent trading levels.
How do institutions grade them?
The following summarizes recent institutional grades for A. O. Smith Corporation and JBT Marel Corporation:
A. O. Smith Corporation Grades
This table lists recent grades from reputable firms for A. O. Smith Corporation.
| Grading Company | Action | New Grade | Date |
|---|---|---|---|
| Stifel | Maintain | Buy | 2026-01-30 |
| Citigroup | Maintain | Neutral | 2026-01-30 |
| DA Davidson | Maintain | Neutral | 2025-11-13 |
| Stifel | Maintain | Buy | 2025-10-29 |
| Citigroup | Maintain | Neutral | 2025-10-29 |
| Oppenheimer | Maintain | Outperform | 2025-07-28 |
| UBS | Maintain | Neutral | 2025-07-28 |
| Baird | Maintain | Neutral | 2025-07-25 |
| Stifel | Maintain | Buy | 2025-07-25 |
| Stifel | Maintain | Buy | 2025-07-21 |
JBT Marel Corporation Grades
This table summarizes recent institutional grades for JBT Marel Corporation.
| Grading Company | Action | New Grade | Date |
|---|---|---|---|
| Jefferies | Upgrade | Buy | 2025-12-10 |
| William Blair | Upgrade | Outperform | 2025-08-06 |
Which company has the best grades?
JBT Marel has received more positive recent upgrades to Buy and Outperform. In contrast, A. O. Smith’s grades are mixed, primarily Neutral and Buy with fewer upgrades. Investors may interpret JBT Marel’s stronger momentum as a signal of growing confidence by analysts.

Don’t Let Luck Decide Your Entry Point
Optimize your entry points with our advanced ProRealTime indicators. You’ll get efficient buy signals with precise price targets for maximum performance. Start outperforming now!
Risks specific to each company
The following categories identify critical pressure points and systemic threats facing A. O. Smith Corporation and JBT Marel Corporation in the 2026 market environment:
1. Market & Competition
A. O. Smith Corporation
- Operates in diverse water heating and treatment markets with strong brand recognition and moderate PE of 17.13.
JBT Marel Corporation
- Faces intense competition in food processing tech with high PE of 47.63 signaling growth expectations but valuation risk.
2. Capital Structure & Debt
A. O. Smith Corporation
- Low debt-to-equity at 0.09 and strong interest coverage of 54x indicate conservative leverage and strong solvency.
JBT Marel Corporation
- Higher debt-to-equity ratio of 0.81 and moderate interest coverage of 5.9x suggest elevated leverage and refinancing risk.
3. Stock Volatility
A. O. Smith Corporation
- Beta of 1.35 shows higher volatility than market average, implying sensitivity to market swings.
JBT Marel Corporation
- Beta of 1.00 indicates stock moves roughly in line with the market, lower relative volatility.
4. Regulatory & Legal
A. O. Smith Corporation
- Exposure to environmental regulations in water treatment and energy-efficient products may increase compliance costs.
JBT Marel Corporation
- Operates globally in food and pharma tech, facing strict safety and quality regulations with risk of costly recalls or sanctions.
5. Supply Chain & Operations
A. O. Smith Corporation
- Global manufacturing footprint with exposure to raw material price volatility and logistics disruptions.
JBT Marel Corporation
- Complex supply chains servicing multiple industries increase operational risks and dependency on component suppliers.
6. ESG & Climate Transition
A. O. Smith Corporation
- Invests in energy-efficient heating solutions, aligning with climate goals but must manage transition costs.
JBT Marel Corporation
- Faces pressure to innovate sustainable food processing tech amid rising ESG investor scrutiny.
7. Geopolitical Exposure
A. O. Smith Corporation
- Significant sales in North America, China, Europe, and India expose it to trade tensions and tariffs.
JBT Marel Corporation
- Diverse global presence across multiple continents increases vulnerability to geopolitical instability and regulatory shifts.
Which company shows a better risk-adjusted profile?
A. O. Smith’s conservative leverage and strong profitability mitigate risks better than JBT Marel’s elevated debt and weaker margins. AOS’s Altman Z-score of 8.3 versus JBTM’s 1.9 underscores superior financial stability. The high valuation and lower profitability of JBTM heighten its risk profile in a volatile market.
Final Verdict: Which stock to choose?
A. O. Smith Corporation’s superpower lies in its durable competitive advantage, consistently creating value with a growing ROIC well above its cost of capital. Its disciplined capital allocation and strong profitability make it a reliable cash generator. The main point of vigilance is its slightly elevated price-to-book ratio, which may temper upside. It suits portfolios targeting steady, aggressive growth.
JBT Marel Corporation’s strategic moat centers on its potential for operational transformation, supported by a high current ratio signaling liquidity strength. However, its recent declining ROIC and unfavorable profitability metrics raise caution. Compared to AOS, JBTM offers more volatility and risk but might appeal to investors favoring turnaround stories or GARP strategies seeking growth at reasonable valuations.
If you prioritize consistent value creation and stable profitability, A. O. Smith outshines as the compelling choice due to its strong moat and financial resilience. However, if you seek speculative growth with liquidity safety and can tolerate higher risk, JBT Marel offers a scenario with better short-term price momentum but weaker fundamentals. Each fits distinct investor profiles with differing risk appetites.
Disclaimer: Investment carries a risk of loss of initial capital. The past performance is not a reliable indicator of future results. Be sure to understand risks before making an investment decision.
Go Further
I encourage you to read the complete analyses of A. O. Smith Corporation and JBT Marel Corporation to enhance your investment decisions: