Home > Comparison > Industrials > HWM vs AOS
The strategic rivalry between Howmet Aerospace Inc. and A. O. Smith Corporation shapes the industrial machinery sector’s future. Howmet operates as a capital-intensive aerospace and transportation components provider, while A. O. Smith focuses on high-margin residential and commercial water heating solutions. This analysis contrasts their operational models and growth drivers to identify which company presents a superior risk-adjusted return for diversified portfolios amid evolving industrial demands.
Table of contents
Companies Overview
Howmet Aerospace and A. O. Smith stand as influential players in the industrial machinery sector, each commanding distinct market niches.
Howmet Aerospace Inc.: Advanced Aerospace Solutions Leader
Howmet Aerospace dominates the aerospace and transportation markets through engineered components like airfoils and titanium forgings. Its core revenue stems from four segments: Engine Products, Fastening Systems, Engineered Structures, and Forged Wheels. In 2026, Howmet sharpened its focus on innovation in aerospace materials, aiming to capture growth amid global aerospace demand.
A. O. Smith Corporation: Premier Water Heating and Treatment Provider
A. O. Smith leads in residential and commercial water heating and treatment products across multiple continents. Its revenue engine revolves around diversified offerings, including boilers, water heaters, and filtration systems. The company prioritized expanding its e-commerce presence and brand portfolio in 2026 to strengthen market penetration in North America and Asia.
Strategic Collision: Similarities & Divergences
Both firms operate in industrial machinery but pursue divergent business models—Howmet focuses on aerospace component innovation, while A. O. Smith targets diversified water solutions. Their battleground centers on industrial manufacturing excellence, yet Howmet’s aerospace specialization contrasts sharply with A. O. Smith’s broader consumer and commercial water treatment focus. This divergence yields distinctly different risk and growth profiles for investors.
Income Statement Comparison
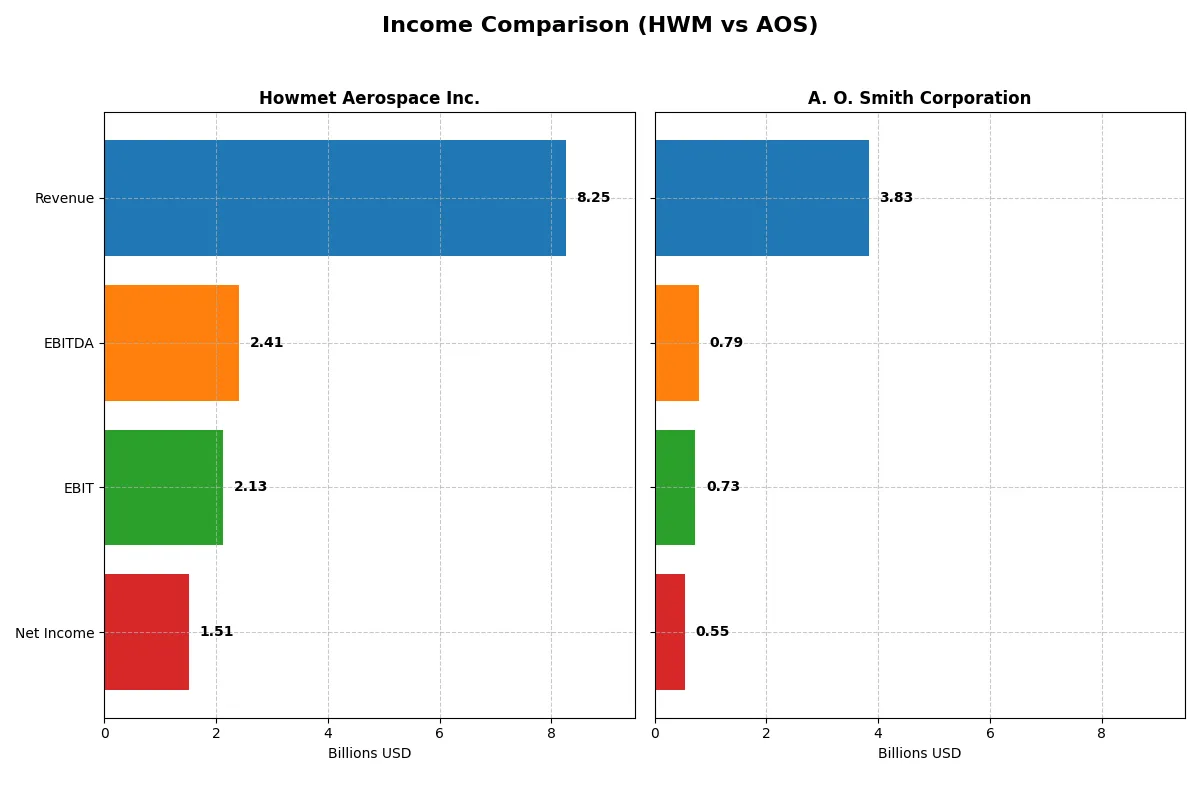
The following data dissects the core profitability and scalability of both corporate engines to reveal who dominates the bottom line:
| Metric | Howmet Aerospace Inc. (HWM) | A. O. Smith Corporation (AOS) |
|---|---|---|
| Revenue | 8.25B | 3.83B |
| Cost of Revenue | 5.72B | 2.34B |
| Operating Expenses | 407M | 759M |
| Gross Profit | 2.54B | 1.49B |
| EBITDA | 2.41B | 792M |
| EBIT | 2.13B | 729M |
| Interest Expense | 151M | 14M |
| Net Income | 1.51B | 546M |
| EPS | 3.73 | 3.86 |
| Fiscal Year | 2025 | 2025 |
Income Statement Analysis: The Bottom-Line Duel
This income statement comparison reveals which company runs a more efficient and profitable corporate engine through recent financial performance.
Howmet Aerospace Inc. (HWM) Analysis
Howmet Aerospace’s revenue climbed impressively from 5B in 2021 to 8.25B in 2025, with net income surging from 258M to 1.5B. The company sustains healthy margins, boasting a gross margin near 31% and a strong net margin above 18%. In 2025, its net income growth accelerated sharply, reflecting robust operational efficiency and margin expansion.
A. O. Smith Corporation (AOS) Analysis
A. O. Smith’s revenue growth has been modest, edging up from 3.54B in 2021 to 3.83B in 2025, with net income rising from 487M to 546M. The firm maintains a higher gross margin near 39%, but a lower net margin around 14%. Its recent one-year revenue growth slowed to 0.3%, indicating more stable but less dynamic earnings momentum.
Verdict: High Growth Efficiency vs. Stable Margin Strength
Howmet Aerospace delivers superior top-line growth and margin expansion, highlighting a powerful earnings trajectory. A. O. Smith shows steadier revenue but with less momentum and lower net margins. Investors seeking aggressive growth and margin improvement may favor Howmet, while those prioritizing stable profitability might prefer A. O. Smith’s consistent margin profile.
Financial Ratios Comparison
These vital ratios act as a diagnostic tool to expose the underlying fiscal health, valuation premiums, and capital efficiency of the companies compared below:
| Ratios | Howmet Aerospace Inc. (HWM) | A. O. Smith Corporation (AOS) |
|---|---|---|
| ROE | 28.2% | 29.4% |
| ROIC | 18.2% | 23.9% |
| P/E | 54.9 | 17.1 |
| P/B | 15.5 | 5.04 |
| Current Ratio | 2.13 | 1.50 |
| Quick Ratio | 1.09 | 0.94 |
| D/E | 0.57 | 0.10 |
| Debt-to-Assets | 27.3% | 6.1% |
| Interest Coverage | 14.1 | 53.9 |
| Asset Turnover | 0.74 | 1.22 |
| Fixed Asset Turnover | 3.18 | 5.62 |
| Payout ratio | 12.0% | 35.8% |
| Dividend yield | 0.22% | 2.09% |
| Fiscal Year | 2025 | 2025 |
Efficiency & Valuation Duel: The Vital Signs
Financial ratios act as a company’s DNA, exposing hidden risks and revealing operational excellence crucial for investment decisions.
Howmet Aerospace Inc.
Howmet Aerospace delivers strong profitability with a 28.17% ROE and an 18.27% net margin, signaling operational efficiency. However, its valuation appears stretched, trading at a high 54.93 P/E and 15.47 P/B ratio. Shareholder returns are minimal with a 0.22% dividend yield, suggesting reinvestment in growth and innovation rather than payouts.
A. O. Smith Corporation
A. O. Smith posts a solid 29.4% ROE and a 14.26% net margin, indicating efficient capital use and profitability. The valuation is reasonable at a 17.13 P/E, though its 5.04 P/B ratio raises some caution. It rewards shareholders with a healthy 2.09% dividend yield, reflecting a balanced mix of income and growth focus.
Valuation Stretch vs. Balanced Efficiency
Howmet Aerospace shows superior profitability but at a stretched valuation and limited dividends, raising risk concerns. A. O. Smith offers a better valuation and stronger shareholder returns, suggesting a more balanced risk-reward profile. Investors seeking growth with income may prefer A. O. Smith’s steadier approach.
Which one offers the Superior Shareholder Reward?
I find A. O. Smith Corporation (AOS) delivers a superior shareholder reward compared to Howmet Aerospace Inc. (HWM) in 2026. AOS yields about 2.1%, threefold HWM’s 0.22%, with a payout ratio near 36%, well-covered by 89% free cash flow. AOS also maintains robust buybacks, enhancing total return. HWM’s payout ratio is a modest 12%, reflecting conservative dividends and reinvestment in growth. HWM’s buyback intensity lags behind AOS, limiting shareholder capital return. AOS balances a sustainable, generous dividend alongside strong buybacks, underpinned by higher free cash flow and lower leverage. I conclude AOS offers a more attractive total return profile for long-term investors in 2026.
Comparative Score Analysis: The Strategic Profile
The radar chart reveals the fundamental DNA and trade-offs of Howmet Aerospace Inc. and A. O. Smith Corporation’s financial profiles:
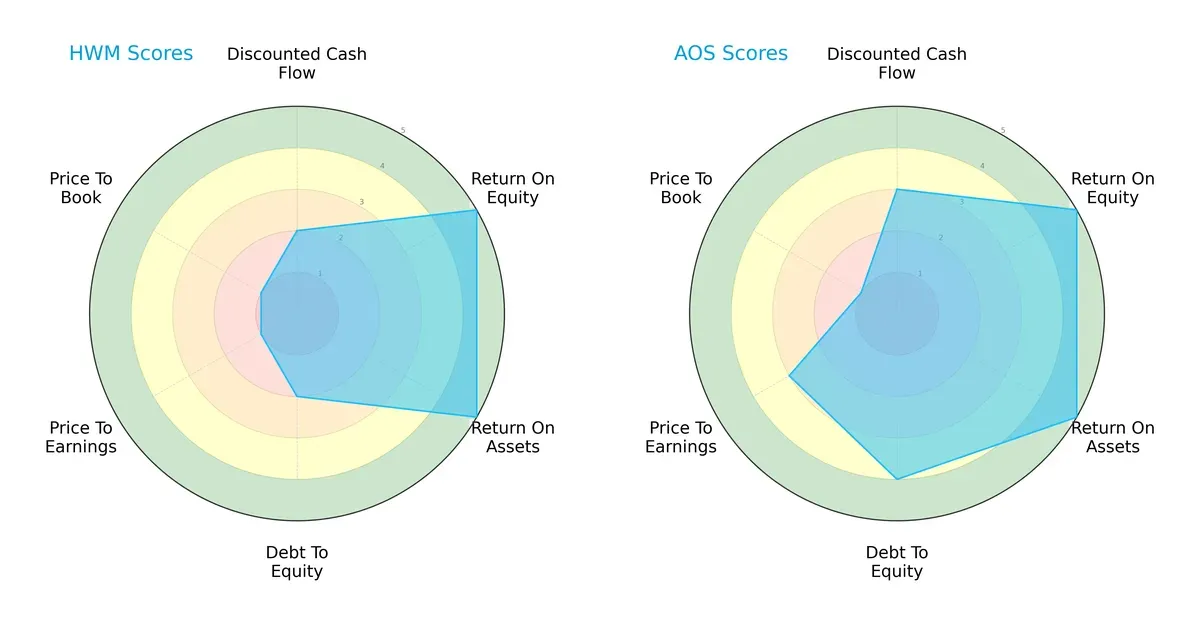
Howmet Aerospace shows strong operational efficiency with top ROE and ROA scores but struggles on valuation and leverage metrics. A. O. Smith offers a more balanced profile, excelling not only in returns but also in debt management and fairer valuation. I see A. O. Smith relying less on a singular strength and presenting a steadier investment case.
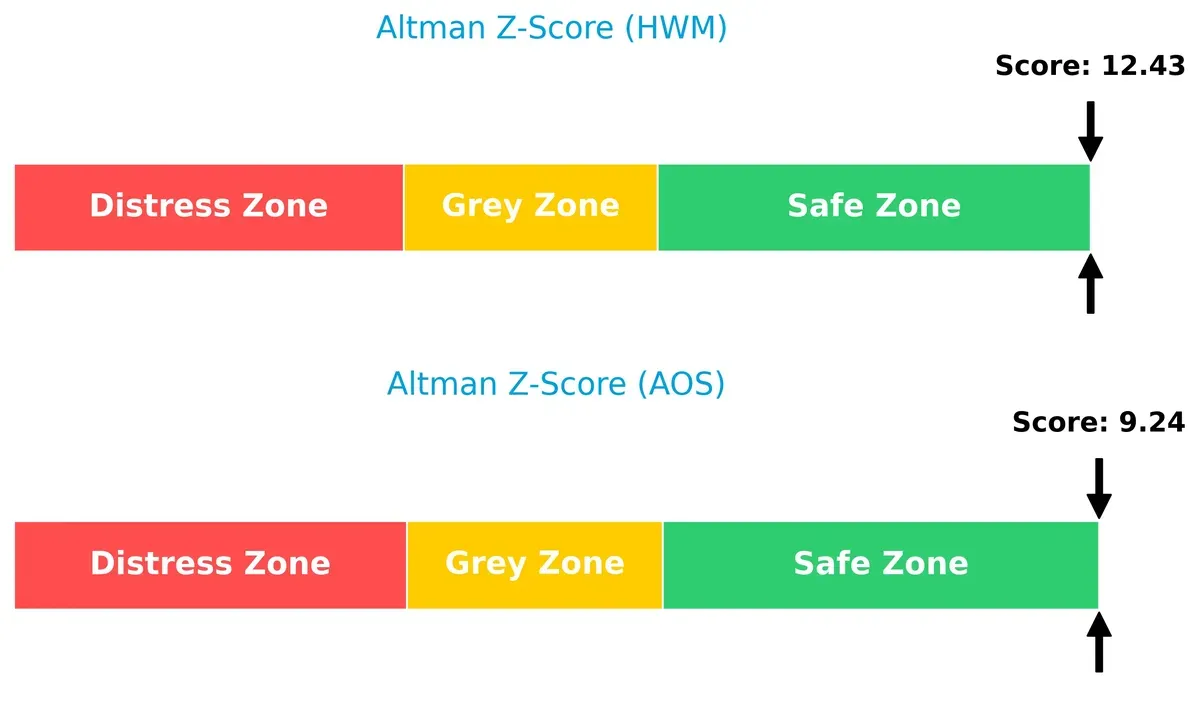
Bankruptcy Risk: Solvency Showdown
The Altman Z-Scores place both companies in the safe zone, with Howmet Aerospace at 12.4 and A. O. Smith at 9.2, signaling robust financial stability and very low bankruptcy risk in this cycle:
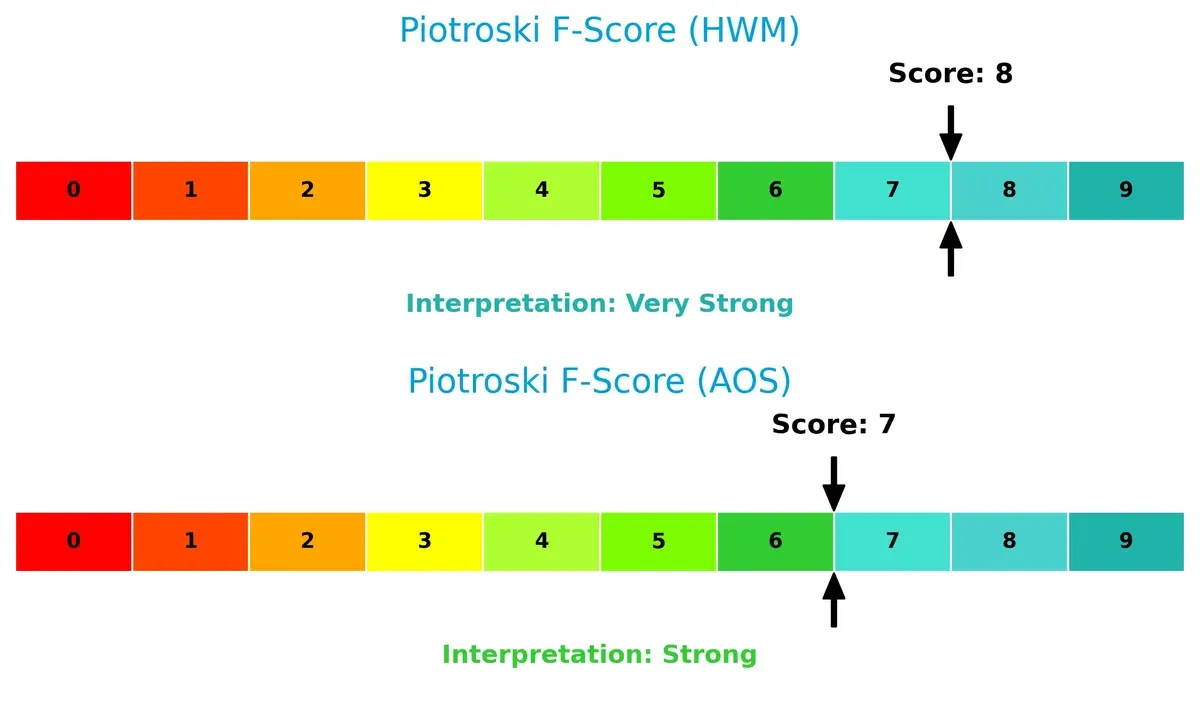
Financial Health: Quality of Operations
Howmet Aerospace scores an 8, indicating very strong financial health, while A. O. Smith’s 7 reflects strong but slightly less robust internal metrics. Neither shows red flags, but Howmet edges ahead in operational quality:
How are the two companies positioned?
This section dissects the operational DNA of HWM and AOS by comparing their revenue distribution and internal dynamics. The goal is to confront their economic moats to determine which business model offers the most resilient competitive advantage today.
Revenue Segmentation: The Strategic Mix
This visual comparison dissects how Howmet Aerospace and A. O. Smith diversify their income streams and where their primary sector bets lie:
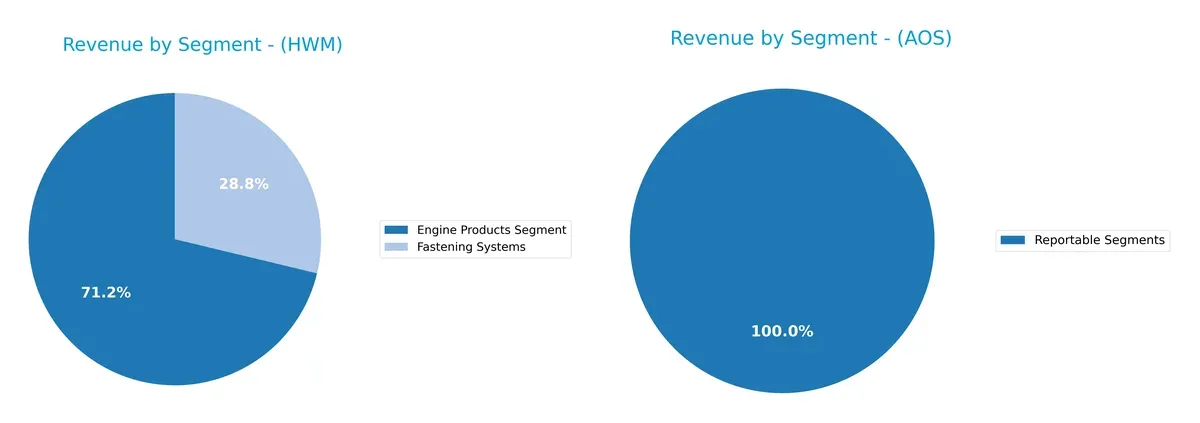
Howmet Aerospace shows a clearly diversified portfolio with $4.3B in Engine Products and $1.7B in Fastening Systems for 2025. It balances these with smaller segments, reducing concentration risk. In contrast, A. O. Smith reports only a single $3.8B segment, indicating high dependency and potential vulnerability to market shifts. Howmet’s mix supports ecosystem lock-in, while A. O. Smith’s focus pivots on core infrastructure dominance but lacks diversification.
Strengths and Weaknesses Comparison
This table compares the Strengths and Weaknesses of Howmet Aerospace Inc. and A. O. Smith Corporation:
Howmet Aerospace Inc. Strengths
- Diverse aerospace product segments with Engine and Fastening Systems
- Strong profitability with 18.27% net margin and 28.17% ROE
- Favorable liquidity ratios: current ratio 2.13 and quick ratio 1.09
- Global presence across North America, Europe, and Asia with $4.38B US revenue
- Favorable debt management with 27.28% debt-to-assets and strong interest coverage
A. O. Smith Corporation Strengths
- Higher profitability with 23.94% ROIC and 29.4% ROE
- Strong asset efficiency: fixed asset turnover 5.62 and asset turnover 1.22
- Favorable leverage with 6.11% debt-to-assets and excellent interest coverage of 54.03
- Consistent dividend yield of 2.09%
- Geographic diversification with $2.62B North America and $1.21B Rest of World revenue
Howmet Aerospace Inc. Weaknesses
- High valuation multiples: PE 54.93 and PB 15.47, signaling market premium risk
- Dividend yield low at 0.22%, less attractive for income investors
- Moderate asset turnover at 0.74, below AOS’s efficiency
- Neutral debt-to-equity ratio of 0.57, higher than AOS’s conservative 0.1
A. O. Smith Corporation Weaknesses
- Lower net margin at 14.26% compared to Howmet’s 18.27%
- Neutral liquidity ratios: current ratio 1.5 and quick ratio 0.94
- Slightly unfavorable PB ratio at 5.04, less extreme than Howmet
- Less product diversification with a single reportable segment
Howmet Aerospace shows strengths in product diversification and liquidity but trades at high valuation multiples. A. O. Smith excels in asset efficiency and dividend yield but has less product variety and moderate liquidity. Both companies maintain favorable leverage and profitability, reflecting solid financial management under different strategic focuses.
The Moat Duel: Analyzing Competitive Defensibility
A structural moat is the only shield protecting long-term profits from relentless competition erosion. Let’s dissect two industrial giants’ moats:
Howmet Aerospace Inc. (HWM): Engineering Precision Moat
I identify Howmet’s moat in its intangible assets and advanced engineering. Its 25.8% EBIT margin and 8.8% ROIC premium over WACC reflect robust value creation. Expanding aerospace and transportation markets in 2026 could deepen this competitive edge.
A. O. Smith Corporation (AOS): Durable Brand & Cost Efficiency Moat
AOS’s moat lies in strong brand loyalty combined with cost advantage. It posts a wider ROIC premium of 14.1% over WACC but with slower ROIC growth. Its stable margins and global water solutions portfolio position it well for incremental market expansion.
Precision Engineering vs. Brand Power: Moat Strength Showdown
Howmet Aerospace boasts a deeper moat with accelerating ROIC growth and higher margin expansion. AOS holds wider moat breadth via brand and cost but slower profitability gains. Howmet is better equipped to defend market share amid rising aerospace demand.
Which stock offers better returns?
Over the past 12 months, Howmet Aerospace’s stock soared with accelerating bullish momentum, while A. O. Smith’s price declined despite recent short-term gains.
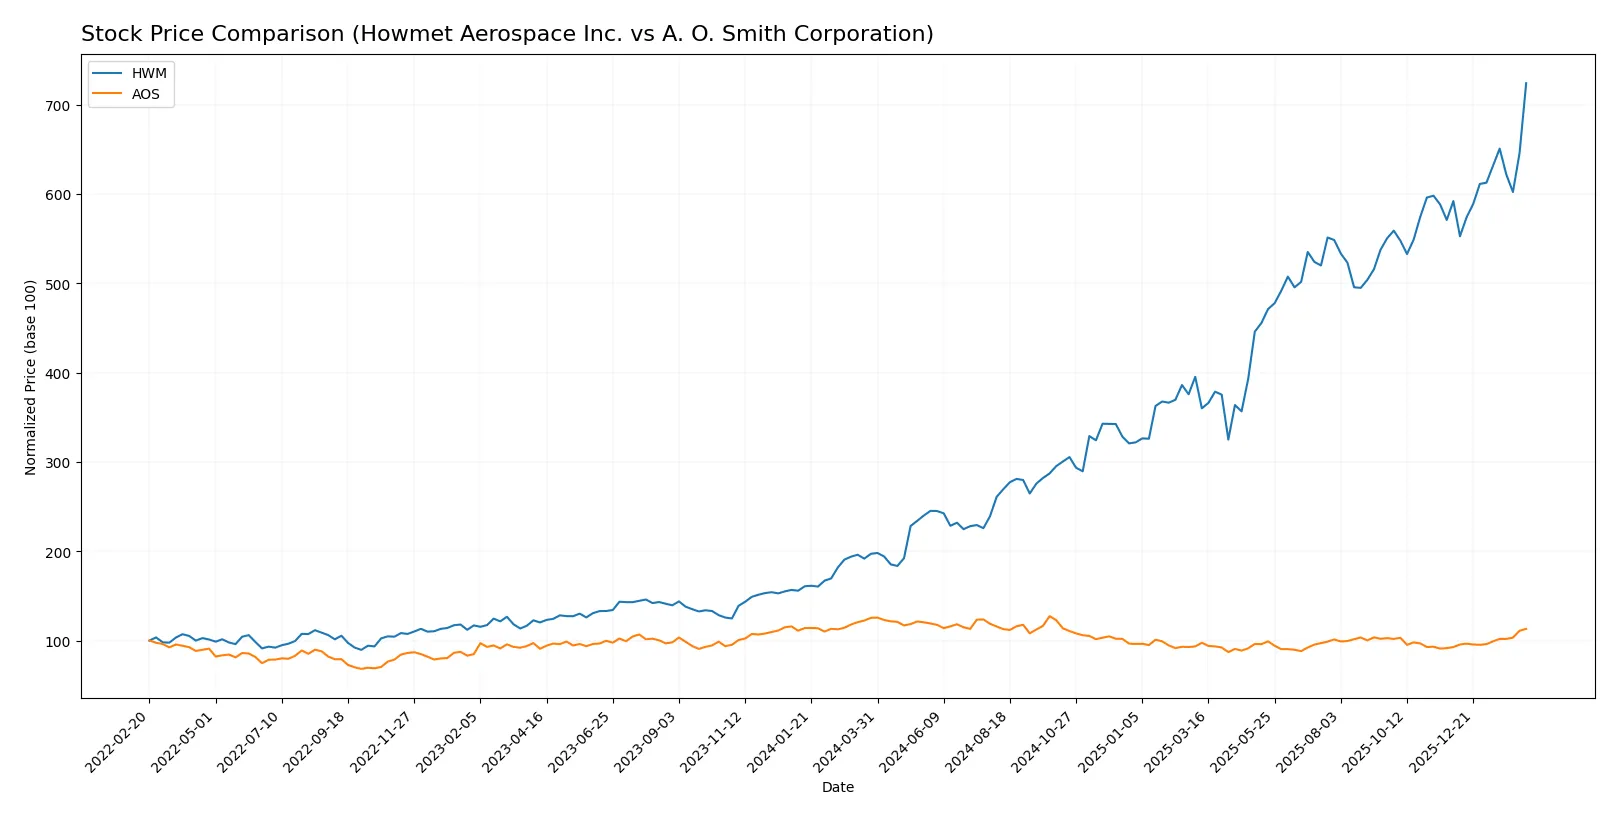
Trend Comparison
Howmet Aerospace (HWM) recorded a strong 267.4% gain over the past year, showing an accelerating bullish trend with high volatility and a peak price of 250.21.
A. O. Smith (AOS) saw a 9.9% decline overall this year, reflecting a bearish trend despite recent 22% gains and moderate volatility.
Howmet Aerospace outperformed A. O. Smith by a wide margin, delivering the highest market performance across the analyzed period.
Target Prices
Analysts present a confident target price range signaling moderate upside potential for both Howmet Aerospace Inc. and A. O. Smith Corporation.
| Company | Target Low | Target High | Consensus |
|---|---|---|---|
| Howmet Aerospace Inc. | 209 | 290 | 259.63 |
| A. O. Smith Corporation | 69 | 85 | 76.2 |
Howmet Aerospace’s consensus target of 259.63 sits slightly above its current price of 250.21, indicating cautious optimism. A. O. Smith’s consensus target of 76.2 suggests modest downside from its current 80.46, reflecting tempered expectations.

Don’t Let Luck Decide Your Entry Point
Optimize your entry points with our advanced ProRealTime indicators. You’ll get efficient buy signals with precise price targets for maximum performance. Start outperforming now!
How do institutions grade them?
Here is a summary of recent institutional grades for Howmet Aerospace Inc. and A. O. Smith Corporation:
Howmet Aerospace Inc. Grades
The following table lists recent grades from reputable financial institutions for Howmet Aerospace Inc.:
| Grading Company | Action | New Grade | Date |
|---|---|---|---|
| Susquehanna | Maintain | Positive | 2026-02-13 |
| Citigroup | Maintain | Buy | 2026-01-13 |
| B of A Securities | Maintain | Buy | 2025-11-14 |
| JP Morgan | Maintain | Overweight | 2025-11-10 |
| BTIG | Maintain | Buy | 2025-11-03 |
| Goldman Sachs | Maintain | Buy | 2025-11-03 |
| TD Cowen | Maintain | Buy | 2025-10-31 |
| RBC Capital | Maintain | Outperform | 2025-10-31 |
| UBS | Maintain | Neutral | 2025-10-31 |
| Truist Securities | Maintain | Buy | 2025-10-15 |
A. O. Smith Corporation Grades
Below are recent grades issued by recognized financial firms for A. O. Smith Corporation:
| Grading Company | Action | New Grade | Date |
|---|---|---|---|
| DA Davidson | Maintain | Neutral | 2026-02-02 |
| Stifel | Maintain | Buy | 2026-01-30 |
| Citigroup | Maintain | Neutral | 2026-01-30 |
| DA Davidson | Maintain | Neutral | 2025-11-13 |
| Citigroup | Maintain | Neutral | 2025-10-29 |
| Stifel | Maintain | Buy | 2025-10-29 |
| UBS | Maintain | Neutral | 2025-07-28 |
| Oppenheimer | Maintain | Outperform | 2025-07-28 |
| Stifel | Maintain | Buy | 2025-07-25 |
| Baird | Maintain | Neutral | 2025-07-25 |
Which company has the best grades?
Howmet Aerospace consistently receives bullish grades, mostly Buy and Outperform, indicating strong institutional confidence. A. O. Smith shows mixed Neutral and Buy ratings, suggesting cautious optimism. Investors might interpret Howmet’s stronger consensus as a sign of greater market enthusiasm.
Risks specific to each company
The following categories identify critical pressure points and systemic threats facing Howmet Aerospace Inc. and A. O. Smith Corporation in the 2026 market environment:
1. Market & Competition
Howmet Aerospace Inc.
- Faces intense aerospace industry competition with cyclical demand risk.
A. O. Smith Corporation
- Operates in competitive water heating and treatment markets with steady residential/commercial demand.
2. Capital Structure & Debt
Howmet Aerospace Inc.
- Moderate debt-to-equity ratio (0.57) with favorable interest coverage (14.11x).
A. O. Smith Corporation
- Low leverage (debt-to-equity 0.1) and very strong interest coverage (54x) signal financial stability.
3. Stock Volatility
Howmet Aerospace Inc.
- Beta of 1.25 indicates moderate stock volatility above market average.
A. O. Smith Corporation
- Higher beta of 1.34 suggests elevated volatility risk compared to Howmet.
4. Regulatory & Legal
Howmet Aerospace Inc.
- Aerospace sector faces strict safety and export regulations; compliance costs remain high.
A. O. Smith Corporation
- Water heater regulations impact product standards; environmental compliance increasing costs.
5. Supply Chain & Operations
Howmet Aerospace Inc.
- Global supply chain risks with exposure to multiple international markets and raw material costs.
A. O. Smith Corporation
- Supply chain complexity lower; regional focus eases operational risks but depends on key distributors.
6. ESG & Climate Transition
Howmet Aerospace Inc.
- Pressure to reduce carbon footprint in aerospace manufacturing; ESG policies under scrutiny.
A. O. Smith Corporation
- Transitioning to energy-efficient products aligns with climate goals; ESG ratings improving.
7. Geopolitical Exposure
Howmet Aerospace Inc.
- Operations in multiple countries expose Howmet to geopolitical tensions and trade disruptions.
A. O. Smith Corporation
- More concentrated geographic footprint reduces but does not eliminate geopolitical risk.
Which company shows a better risk-adjusted profile?
Howmet’s most significant risk lies in market cyclicality and international geopolitical exposure. A. O. Smith’s key risk is higher stock volatility and regulatory cost pressures. Overall, A. O. Smith offers a stronger risk-adjusted profile, supported by lower leverage, higher interest coverage, and more stable operational exposure. Notably, Howmet’s elevated P/E and P/B ratios signal potential overvaluation, increasing investor risk.
Final Verdict: Which stock to choose?
Howmet Aerospace (HWM) excels as a powerhouse of operational efficiency and rapid profitability growth. Its core strength lies in creating significant value through a rising ROIC well above its cost of capital. A point of vigilance remains its rich valuation multiples, which could temper near-term returns. HWM suits aggressive growth portfolios seeking outsized capital appreciation.
A. O. Smith (AOS) offers a robust strategic moat with steady cash flow and superior capital allocation efficiency. Its low leverage and strong interest coverage underscore a safer balance sheet compared to HWM. AOS fits well within GARP portfolios, balancing sustainable growth and reasonable valuation metrics.
If you prioritize high-growth momentum and are comfortable with a premium valuation, Howmet Aerospace outshines as the compelling choice due to its accelerating profitability and strong operational leverage. However, if you seek better stability with a proven capital return track record and lower financial risk, A. O. Smith offers superior resilience and a more moderate valuation profile.
Disclaimer: Investment carries a risk of loss of initial capital. The past performance is not a reliable indicator of future results. Be sure to understand risks before making an investment decision.
Go Further
I encourage you to read the complete analyses of Howmet Aerospace Inc. and A. O. Smith Corporation to enhance your investment decisions: