Home > Comparison > Industrials > AOS vs GNRC
The strategic rivalry between A. O. Smith Corporation and Generac Holdings Inc. shapes the industrial machinery sector’s evolution. A. O. Smith operates as a diversified manufacturer of water heaters and treatment products, while Generac specializes in power generation and energy storage solutions. This analysis pits A. O. Smith’s broad industrial base against Generac’s focused innovation to assess which company offers a superior risk-adjusted return for a diversified portfolio in today’s dynamic market.
Table of contents
Companies Overview
A. O. Smith Corporation and Generac Holdings Inc. dominate distinct niches within the industrial machinery sector.
A. O. Smith Corporation: Global Water Heating and Treatment Leader
A. O. Smith Corporation centers on residential and commercial water heaters, boilers, and water treatment products. Its revenue streams derive from diverse markets including North America, China, Europe, and India. In 2026, the company’s strategic focus sharpened on expanding e-commerce sales and enhancing energy-efficient product lines to meet growing environmental standards.
Generac Holdings Inc.: Power Generation Innovator
Generac Holdings Inc. specializes in power generation equipment and energy storage systems for residential, commercial, and industrial customers worldwide. Its core revenue comes from generators and clean energy solutions under PWRcell and PWRview brands. In 2026, Generac prioritized expanding its clean energy portfolio and improving remote monitoring technologies to capitalize on the energy transition.
Strategic Collision: Similarities & Divergences
Both companies thrive in industrial machinery but pursue divergent philosophies: A. O. Smith emphasizes a diverse product ecosystem with global reach, while Generac focuses on power solutions and energy innovation. Their primary battleground lies in commercial and residential infrastructure markets. Investors will find A. O. Smith offers steady, broad-based exposure, whereas Generac presents a higher-growth, technology-driven profile.
Income Statement Comparison
This data dissects the core profitability and scalability of both corporate engines to reveal who dominates the bottom line:
| Metric | A. O. Smith Corporation (AOS) | Generac Holdings Inc. (GNRC) |
|---|---|---|
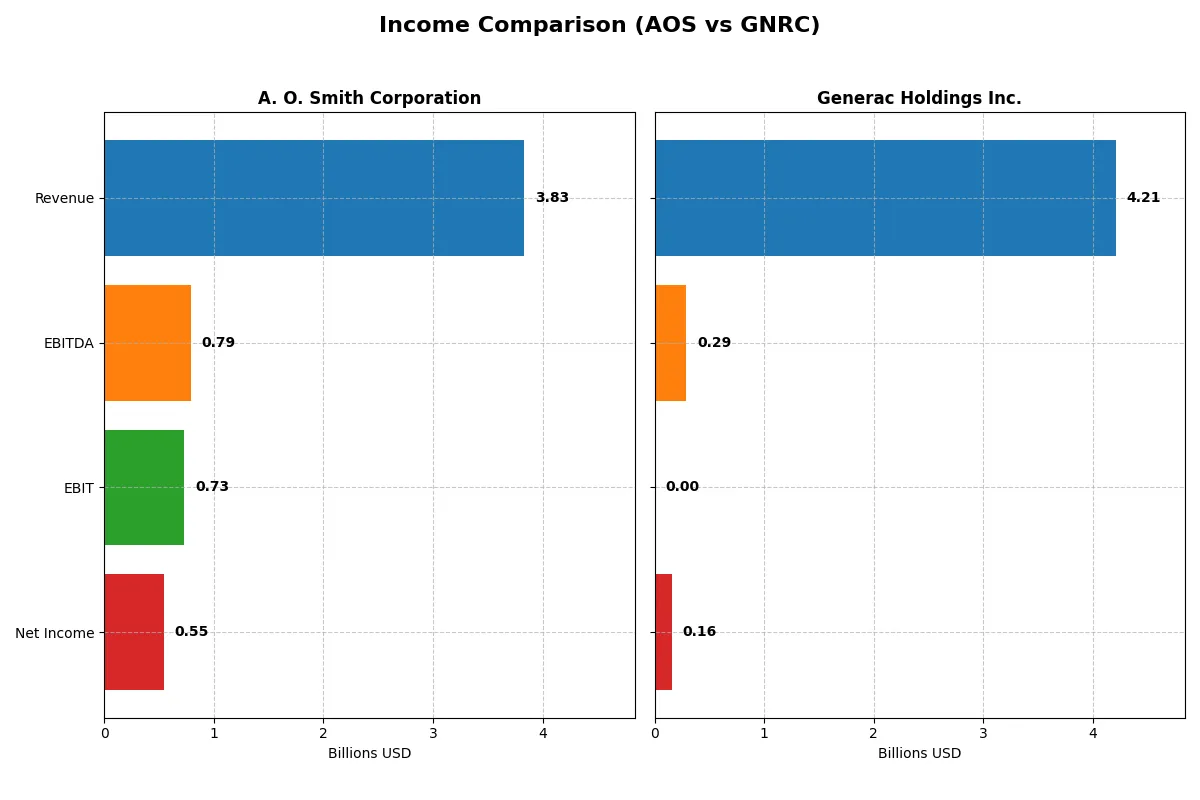
| Revenue | 3.83B | 4.21B |
| Cost of Revenue | 2.34B | 2.60B |
| Operating Expenses | 759M | 1.32B |
| Gross Profit | 1.49B | 1.61B |
| EBITDA | 792M | 289M |
| EBIT | 729M | 0 |
| Interest Expense | 13.5M | -70.7M |
| Net Income | 546M | 160M |
| EPS | 3.86 | 2.73 |
| Fiscal Year | 2025 | 2025 |
Income Statement Analysis: The Bottom-Line Duel
This income statement comparison reveals how efficiently each company converts revenue into profit and sustains margin strength.
A. O. Smith Corporation Analysis
A. O. Smith’s revenue shows steady growth, reaching $3.83B in 2025 with net income at $546M. Gross and net margins remain healthy at 38.8% and 14.3%, respectively. The 2025 results highlight consistent operational efficiency and moderate margin expansion, supported by favorable interest expense control and a resilient EPS growth of 6.3% year-over-year.
Generac Holdings Inc. Analysis
Generac’s revenue peaked at $4.30B in 2024 but fell 2% to $4.21B in 2025. Gross margin remains robust at 38.3%, yet EBIT margin collapsed to zero, dragging net margin down to 3.8%. The sharp decline in EBIT and net income reflects significant operational challenges and margin compression, with EPS halving over the past year, signaling weakening profitability momentum.
Margin Strength vs. Profitability Erosion
A. O. Smith outperforms Generac by maintaining strong margins and steady net income growth despite slower revenue gains. Generac’s top-line scale masks deteriorating profitability and margin erosion, driven by rising expenses and a zero EBIT margin in 2025. For investors, A. O. Smith’s profile signals stable earnings power, whereas Generac presents heightened risks with inconsistent profitability.
Financial Ratios Comparison
These vital ratios act as a diagnostic tool to expose the underlying fiscal health, valuation premiums, and capital efficiency of the companies compared below:
| Ratios | A. O. Smith Corporation (AOS) | Generac Holdings Inc. (GNRC) |
|---|---|---|
| ROE | 29.40% | 0.00% |
| ROIC | 23.94% | 0.00% |
| P/E | 17.13 | 50.02 |
| P/B | 5.04 | 0.00 |
| Current Ratio | 1.50 | 0.00 |
| Quick Ratio | 0.94 | 0.00 |
| D/E (Debt-to-Equity) | 0.10 | 0.00 |
| Debt-to-Assets | 6.11% | 0.00% |
| Interest Coverage | 53.93 | -4.09 |
| Asset Turnover | 1.22 | 0.00 |
| Fixed Asset Turnover | 5.62 | 0.00 |
| Payout ratio | 35.83% | 0.18% |
| Dividend yield | 2.09% | 0.00% |
| Fiscal Year | 2025 | 2025 |
Efficiency & Valuation Duel: The Vital Signs
Financial ratios act as a company’s DNA, uncovering hidden risks and signaling operational strength and valuation discipline.
A. O. Smith Corporation
AOS delivers robust profitability with a 29.4% ROE and a healthy 14.26% net margin, indicating efficient operations. Its P/E of 17.13 suggests a fairly valued stock, though a 5.04 PB ratio appears stretched. The company rewards shareholders with a 2.09% dividend yield, reflecting stable cash returns amid solid reinvestment.
Generac Holdings Inc.
GNRC struggles with profitability, posting a weak 3.79% net margin and zero ROE, signaling operational challenges. Its P/E ratio of 50.02 marks the stock as expensive relative to earnings. No dividends are paid, and key liquidity ratios are unavailable, highlighting financial stress and riskier shareholder returns.
Premium Valuation vs. Operational Safety
AOS offers a superior balance of profitability, valuation, and shareholder returns with mostly favorable ratios. GNRC’s stretched valuation and weak margins pose significant risks. Investors prioritizing stable earnings and dividends will lean toward AOS, while those seeking high growth despite risk may consider GNRC.
Which one offers the Superior Shareholder Reward?
A. O. Smith Corporation (AOS) delivers a balanced distribution approach with a 2.1% dividend yield and a sustainable 36% payout ratio, supported by steady free cash flow of 3.9B per share. It maintains consistent buybacks, enhancing total returns. Generac Holdings Inc. (GNRC) barely pays dividends, yielding near zero, but reinvests heavily in growth, showing strong free cash flow of 7.5B per share with modest buybacks. I see AOS’s blend of dividends and buybacks as more sustainable and attractive for 2026 investors seeking stable income plus capital appreciation.
Comparative Score Analysis: The Strategic Profile
The radar chart reveals the fundamental DNA and trade-offs of A. O. Smith Corporation and Generac Holdings Inc., highlighting their core financial strengths and vulnerabilities:
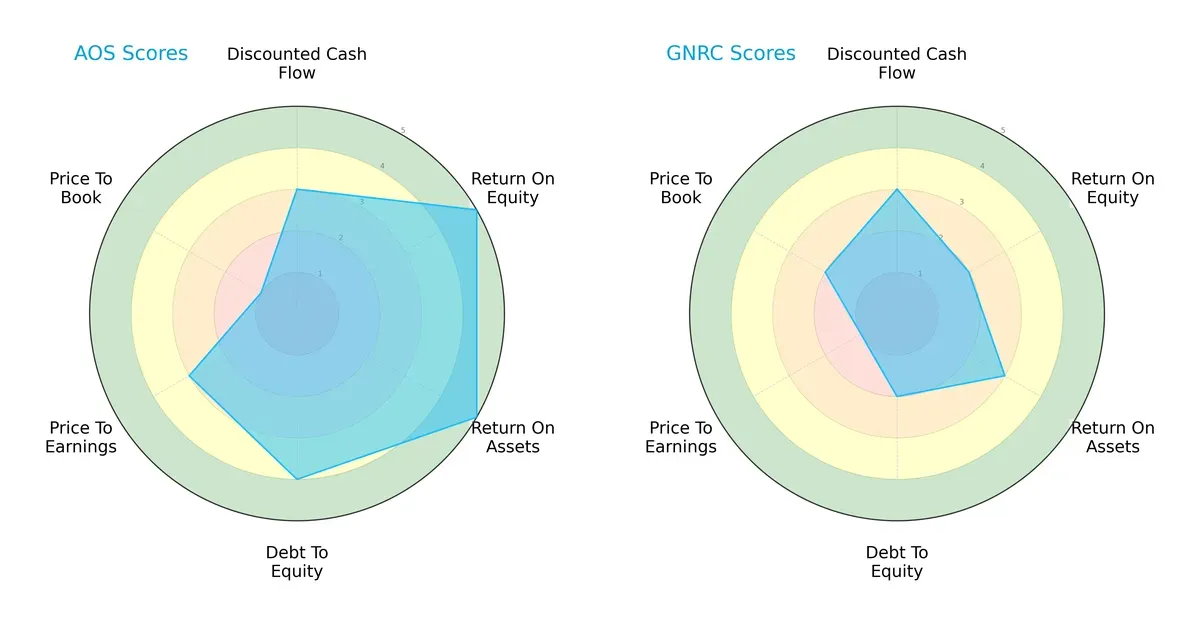
A. O. Smith exhibits a more balanced profile with very favorable ROE and ROA scores (5 each) and a strong debt-to-equity score (4), signaling operational efficiency and solid financial stability. In contrast, Generac relies on a moderate DCF score (3) but suffers from weak profitability (ROE 2) and higher leverage risk (debt-to-equity 2). Generac’s valuation metrics are also less attractive, with very unfavorable P/E (1) and unfavorable P/B (2) scores, underscoring valuation concerns.
Bankruptcy Risk: Solvency Showdown
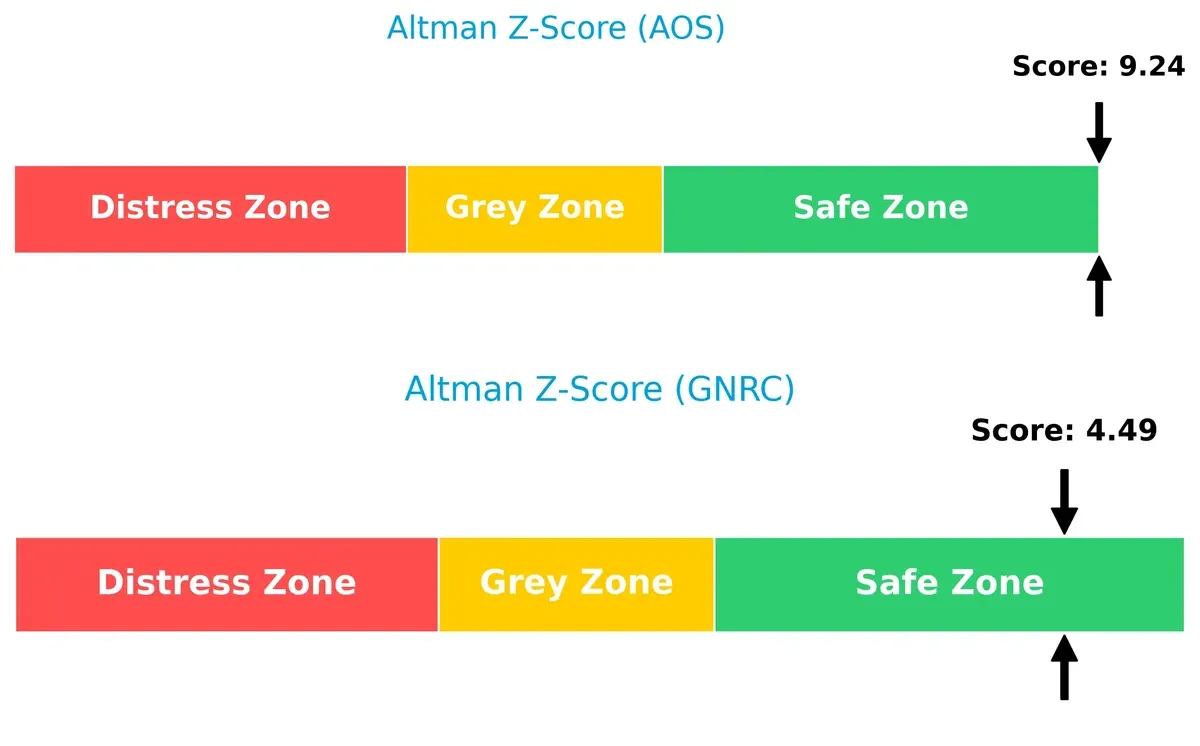
A. O. Smith’s Altman Z-Score of 9.24 vastly exceeds Generac’s 4.49, indicating a significantly stronger solvency position and lower bankruptcy risk in this cycle:
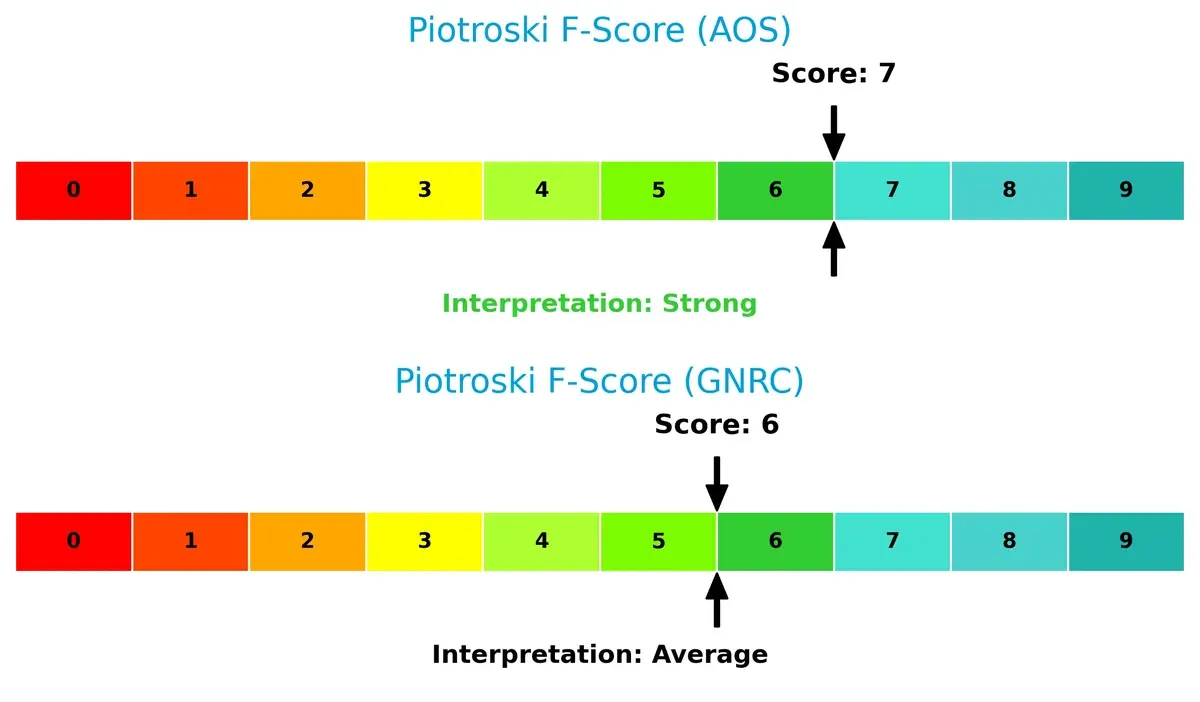
Financial Health: Quality of Operations
A. O. Smith’s Piotroski F-Score of 7 signals strong financial health, outperforming Generac’s average score of 6. There are no immediate red flags for either, but A. O. Smith shows greater operational quality and balance:
How are the two companies positioned?
This section dissects AOS and GNRC’s operational DNA by comparing revenue distribution and internal dynamics. The goal is to confront their economic moats and reveal which business model delivers the most resilient competitive advantage today.
Revenue Segmentation: The Strategic Mix
This visual comparison dissects how A. O. Smith Corporation and Generac Holdings Inc. diversify their income streams and reveals their primary sector bets:
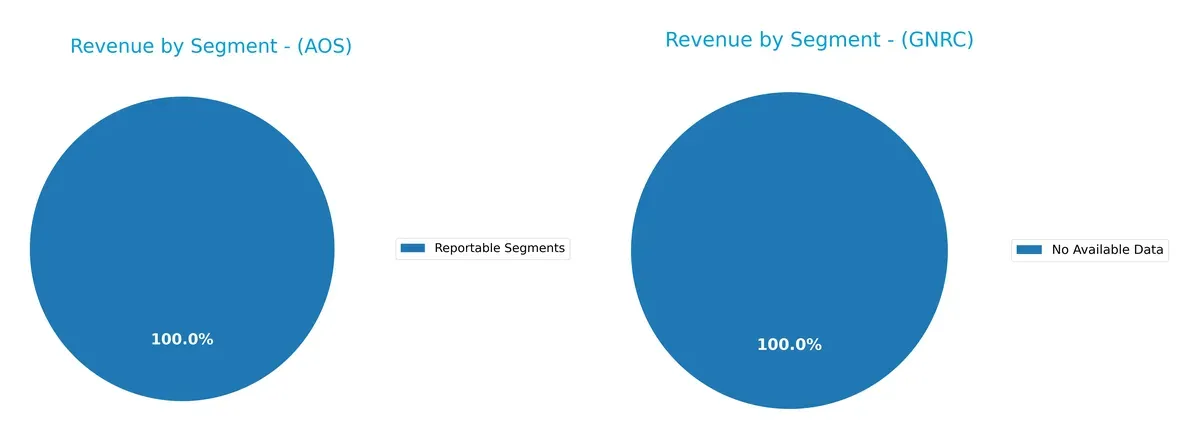
A. O. Smith Corporation relies entirely on a single reportable segment generating $3.83B, showing a concentrated revenue base. Generac Holdings lacks segment data, preventing direct comparison. AOS’s concentration suggests risk exposure but also signals focused expertise and potential infrastructure dominance. Without diversification, AOS must leverage its core segment’s moat to sustain growth amid market cycles.
Strengths and Weaknesses Comparison
This table compares the Strengths and Weaknesses of AOS and GNRC based on key financial and operational metrics:
AOS Strengths
- Strong profitability with 14.26% net margin
- High ROE at 29.4%
- Favorable ROIC at 23.94%
- Low debt-to-assets at 6.11%
- High interest coverage at 54.03
- Solid asset turnover ratios
- Consistent global revenue diversification
GNRC Strengths
- Favorable price-to-book ratio
- Zero debt levels
- Debt-to-assets ratio at 0% indicating low leverage
AOS Weaknesses
- Unfavorable price-to-book ratio at 5.04
- Neutral liquidity ratios (current 1.5, quick 0.94)
- Moderate WACC at 9.88%
- Limited innovation and market share details
GNRC Weaknesses
- Unfavorable profitability with 3.79% net margin
- ROE and ROIC at 0%, indicating no returns
- Unavailable WACC data
- Zero liquidity ratios
- Negative interest coverage
- No dividend yield
- No reported revenue diversification
AOS exhibits robust profitability and financial stability, supported by global revenue streams. GNRC faces significant financial challenges, reflected in weak profitability and liquidity, limiting its strategic flexibility.
The Moat Duel: Analyzing Competitive Defensibility
A structural moat stands as the sole shield protecting long-term profits from relentless competition erosion. Consider the following:
A. O. Smith Corporation: Durable Cost Advantage
A. O. Smith leverages a cost advantage rooted in manufacturing scale and operational efficiency. Its consistently high ROIC and stable margins reflect this strength. In 2026, expansion in international markets and energy-efficient products could deepen this moat.
Generac Holdings Inc.: Product Ecosystem Lock-in
Generac’s moat arises from its integrated power solutions ecosystem, contrasting AOS’s cost focus. However, declining ROIC signals weakening competitive positioning. Future growth depends heavily on innovation in clean energy and energy storage to reverse margin pressures.
Cost Efficiency vs. Ecosystem Innovation: The Moat Showdown
A. O. Smith exhibits a wider, more sustainable moat, demonstrated by growing ROIC and margin stability. Generac’s moat is narrower and under threat due to profitability declines. AOS is better equipped to defend and grow its market share in 2026.
Which stock offers better returns?
The past year shows divergent trajectories: A. O. Smith Corporation’s stock declined overall but surged recently, while Generac Holdings Inc. delivered robust gains with accelerating momentum.
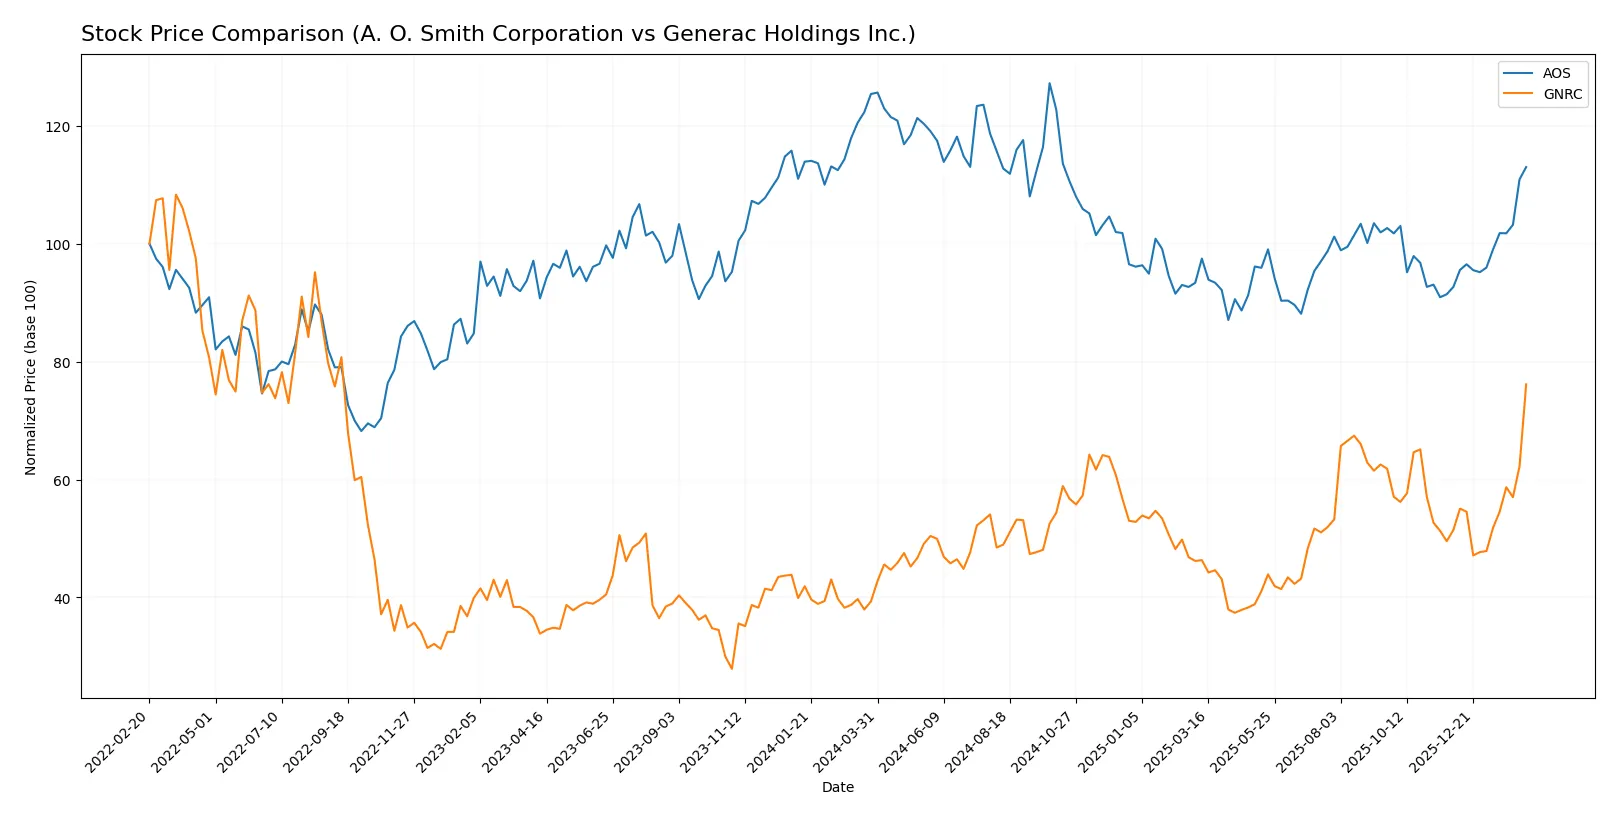
Trend Comparison
A. O. Smith Corporation’s stock fell 9.88% over the past year, marking a bearish trend with accelerating decline and a high volatility of 7.71%. It reached a peak of 90.59 and a low of 61.99.
Generac Holdings Inc. posted a bullish trend, rising 93.64% over the same period with accelerating gains and a volatility of 22.77%. It hit a high of 224.45 and a low of 110.25.
Generac’s stock outperformed A. O. Smith by a wide margin, delivering the highest market performance and stronger upward price momentum.
Target Prices
Analysts present a mixed but generally optimistic target consensus for A. O. Smith Corporation and Generac Holdings Inc.
| Company | Target Low | Target High | Consensus |
|---|---|---|---|
| A. O. Smith Corporation | 69 | 85 | 76.2 |
| Generac Holdings Inc. | 195 | 292 | 238.89 |
The consensus target price for AOS slightly undercuts its current $80.46 share price, suggesting modest downside risk. GNRC’s consensus target significantly exceeds its $224.45 market price, indicating strong upside potential.

Don’t Let Luck Decide Your Entry Point
Optimize your entry points with our advanced ProRealTime indicators. You’ll get efficient buy signals with precise price targets for maximum performance. Start outperforming now!
How do institutions grade them?
Here is a summary of the latest institutional grades for both companies:
A. O. Smith Corporation Grades
The following table shows recent grades assigned by reputable analysts to A. O. Smith Corporation.
| Grading Company | Action | New Grade | Date |
|---|---|---|---|
| DA Davidson | Maintain | Neutral | 2026-02-02 |
| Stifel | Maintain | Buy | 2026-01-30 |
| Citigroup | Maintain | Neutral | 2026-01-30 |
Generac Holdings Inc. Grades
Below is a summary of recent analyst grades for Generac Holdings Inc.
| Grading Company | Action | New Grade | Date |
|---|---|---|---|
| Barclays | Maintain | Equal Weight | 2026-02-13 |
| Wells Fargo | Maintain | Overweight | 2026-02-12 |
| Guggenheim | Downgrade | Neutral | 2026-02-12 |
Which company has the best grades?
A. O. Smith Corporation consistently receives Neutral to Buy ratings, indicating stable confidence. Generac Holdings shows a mix of Overweight and Neutral grades with some recent downgrades. Investors may interpret A. O. Smith’s steadier outlook as a sign of more consistent analyst sentiment.
Risks specific to each company
The following categories identify the critical pressure points and systemic threats facing both firms in the 2026 market environment:
1. Market & Competition
A. O. Smith Corporation
- Faces intense competition in water heating and treatment products with established brands.
Generac Holdings Inc.
- Operates in a highly competitive power generation market with rapid innovation and emerging clean energy rivals.
2. Capital Structure & Debt
A. O. Smith Corporation
- Maintains low debt-to-equity (0.1), signaling conservative leverage and strong balance sheet.
Generac Holdings Inc.
- Shows no reported debt but has weak interest coverage, indicating potential liquidity risks.
3. Stock Volatility
A. O. Smith Corporation
- Beta of 1.34 suggests moderate volatility compared to the market.
Generac Holdings Inc.
- Higher beta of 1.81 reflects greater sensitivity to market swings and investor sentiment.
4. Regulatory & Legal
A. O. Smith Corporation
- Subject to environmental and safety regulations in multiple regions, with moderate compliance risks.
Generac Holdings Inc.
- Faces regulatory scrutiny on emissions and energy storage, with evolving standards potentially impacting costs.
5. Supply Chain & Operations
A. O. Smith Corporation
- Global supply chain spans North America, China, Europe, and India, exposing it to geopolitical disruptions.
Generac Holdings Inc.
- Relies on diverse suppliers for components and batteries, vulnerable to raw material price fluctuations.
6. ESG & Climate Transition
A. O. Smith Corporation
- Integrates solar and heat pump technologies, aligning with climate transition trends.
Generac Holdings Inc.
- Expanding clean energy portfolio but dependent on fossil-fuel backup generators, posing sustainability challenges.
7. Geopolitical Exposure
A. O. Smith Corporation
- Diversified international operations expose it to trade tensions and tariffs, especially in China.
Generac Holdings Inc.
- Primarily US-focused but supply chain globalized, facing risks from trade policy shifts and tariffs.
Which company shows a better risk-adjusted profile?
A. O. Smith faces a notable risk from global supply chain complexity but benefits from solid capital structure and steady margins. Generac contends with high stock volatility and weak profitability metrics, signaling operational and financial stress. The most impactful risk for A. O. Smith is geopolitical supply chain exposure. For Generac, poor financial leverage and interest coverage present critical vulnerabilities. A. O. Smith’s favorable Altman Z-score (9.24, safe zone) and strong Piotroski score (7) confirm a more resilient risk-adjusted profile compared to Generac’s lower scores and unfavorable financial ratios. The widening valuation gap—Generac’s P/E at 50 versus A. O. Smith’s 17—underscores heightened investor concern about Generac’s earnings sustainability.
Final Verdict: Which stock to choose?
A. O. Smith Corporation’s superpower lies in its robust capital efficiency and consistent value creation. Its very favorable moat, driven by a steadily growing ROIC well above WACC, underscores long-term competitive strength. A point of vigilance is its elevated price-to-book ratio, suggesting premium valuation. It suits portfolios focused on stable, quality growth.
Generac Holdings Inc. benefits from a strategic moat rooted in specialized product demand and recurring revenue streams, albeit less evident in financial metrics. Its bullish price momentum signals growth potential but comes with higher volatility and weaker profitability metrics than AOS. It fits growth-at-a-reasonable-price portfolios willing to tolerate risk for upside.
If you prioritize enduring capital efficiency and financial resilience, A. O. Smith Corporation outshines as the compelling choice due to its sustainable economic moat and strong profitability metrics. However, if you seek high-growth exposure with a tolerance for valuation and earnings volatility, Generac Holdings offers superior momentum and niche market positioning. Analytical scenarios favor disciplined investors to balance these profiles carefully.
Disclaimer: Investment carries a risk of loss of initial capital. The past performance is not a reliable indicator of future results. Be sure to understand risks before making an investment decision.
Go Further
I encourage you to read the complete analyses of A. O. Smith Corporation and Generac Holdings Inc. to enhance your investment decisions: