Home > Comparison > Industrials > EMR vs AOS
The strategic rivalry between Emerson Electric Co. and A. O. Smith Corporation shapes the industrial machinery sector’s future. Emerson dominates as a diversified industrial technology leader with broad automation and control solutions. In contrast, A. O. Smith excels as a focused manufacturer of water heating and treatment products. This analysis examines their contrasting operational models to identify which company offers a superior risk-adjusted opportunity for a balanced industrial portfolio.
Table of contents
Companies Overview
Emerson Electric Co. and A. O. Smith Corporation are key industrial players shaping machinery markets globally.
Emerson Electric Co.: Industrial Engineering Leader
Emerson Electric Co. dominates industrial and commercial markets through Automation Solutions and Commercial & Residential Solutions. Its core revenue comes from measurement instruments, industrial valves, process control software, and HVAC products. In 2026, Emerson focuses strategically on integrated technology solutions for oil and gas, refining, and power generation sectors, leveraging its broad industrial footprint.
A. O. Smith Corporation: Water Heating and Treatment Specialist
A. O. Smith Corporation leads in residential and commercial water heaters and water treatment products. It generates revenue mainly from gas, electric, and solar water heaters plus filtration systems. The company’s 2026 strategy prioritizes expanding its North American and international presence via diversified heating technologies and direct-to-consumer e-commerce channels.
Strategic Collision: Similarities & Divergences
Both companies operate in industrial machinery but differ in focus: Emerson drives technology integration, while A. O. Smith centers on water heating and treatment. They compete in commercial infrastructure markets but with distinct scopes—Emerson in broad industrial automation, A. O. Smith in specialized water systems. Their investment profiles diverge accordingly: Emerson offers diversified industrial exposure, A. O. Smith targets niche water solutions.
Income Statement Comparison
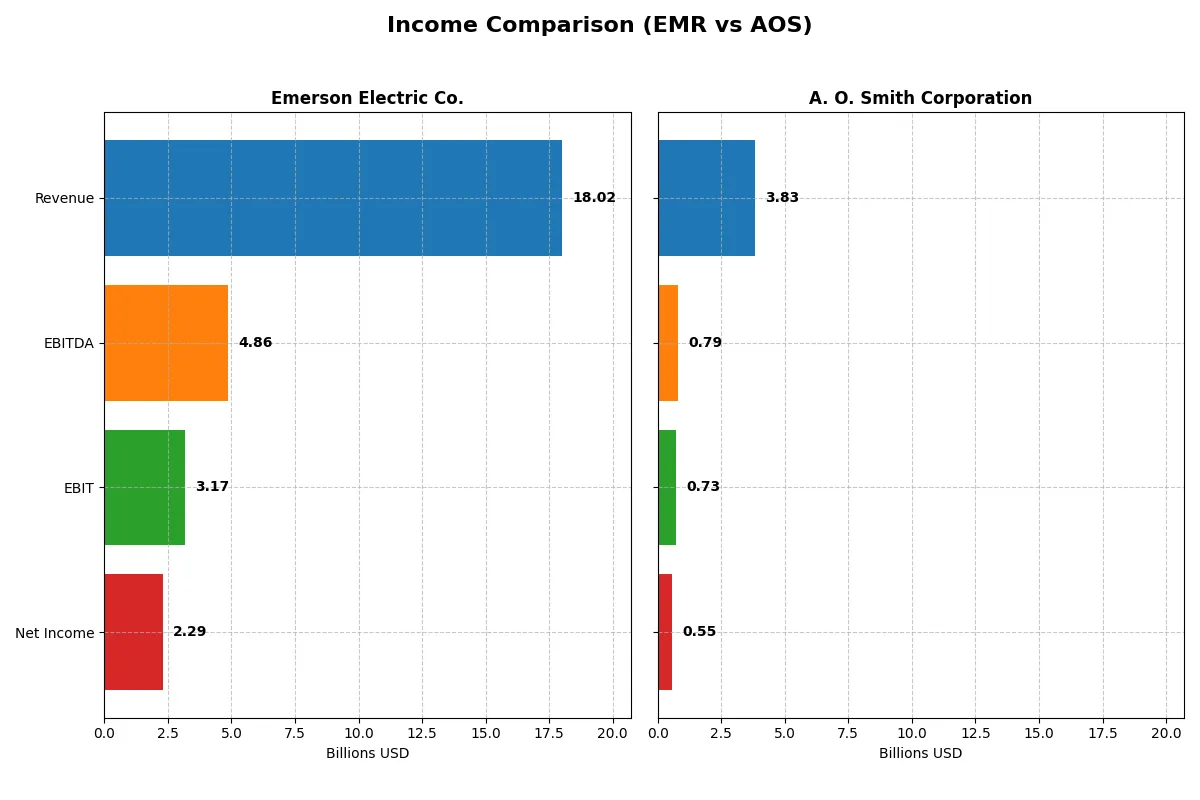
This data dissects the core profitability and scalability of both corporate engines to reveal who dominates the bottom line:
| Metric | Emerson Electric Co. (EMR) | A. O. Smith Corporation (AOS) |
|---|---|---|
| Revenue | 18.0B | 3.83B |
| Cost of Revenue | 8.50B | 2.34B |
| Operating Expenses | 7.28B | 759M |
| Gross Profit | 9.52B | 1.49B |
| EBITDA | 4.86B | 792M |
| EBIT | 3.17B | 729M |
| Interest Expense | 237M | 13.5M |
| Net Income | 2.29B | 546M |
| EPS | 4.06 | 3.86 |
| Fiscal Year | 2025 | 2025 |
Income Statement Analysis: The Bottom-Line Duel
The upcoming income statement comparison exposes which company operates more efficiently and delivers stronger profitability under current market conditions.
Emerson Electric Co. Analysis
Emerson Electric Co. has steadily grown revenue from $12.9B in 2021 to $18.0B in 2025. Its gross margin improved to 52.8%, signaling strong cost control. Net income reached $2.29B in 2025, with net margin at 12.7%, reflecting solid profitability and a 13.1% net margin growth in the latest year. EBIT rose 35.3%, showing operational momentum.
A. O. Smith Corporation Analysis
A. O. Smith’s revenue grew modestly to $3.83B in 2025 from $3.54B in 2021. Gross margin stands at 38.8%, lower than Emerson’s but stable. Net income increased to $546M in 2025, with a 14.3% net margin, slightly higher than Emerson’s margin. EPS grew 6.3% last year, indicating steady earnings expansion despite limited revenue growth.
Margin Power vs. Revenue Scale
Emerson Electric dominates in revenue scale and gross margin, driving strong EBIT and net income growth. A. O. Smith posts higher net margin and EPS growth but from a smaller base. Emerson’s profile suits investors favoring large-scale operational efficiency. A. O. Smith appeals for those prioritizing margin improvement and consistent earnings growth.
Financial Ratios Comparison
These vital ratios act as a diagnostic tool to expose the underlying fiscal health, valuation premiums, and capital efficiency of the companies analyzed:
| Ratios | Emerson Electric Co. (EMR) | A. O. Smith Corporation (AOS) |
|---|---|---|
| ROE | 11.31% | 25.64% |
| ROIC | 4.60% | 23.94% |
| P/E | 32.42 | 17.13 |
| P/B | 3.67 | 4.39 |
| Current Ratio | 0.88 | 1.50 |
| Quick Ratio | 0.65 | 0.94 |
| D/E | 0.68 | 0.09 |
| Debt-to-Assets | 32.79% | 6.11% |
| Interest Coverage | 9.44 | 53.93 |
| Asset Turnover | 0.43 | 1.22 |
| Fixed Asset Turnover | 5.14 | 5.62 |
| Payout ratio | 51.98% | 35.83% |
| Dividend yield | 1.60% | 2.09% |
| Fiscal Year | 2025 | 2025 |
Efficiency & Valuation Duel: The Vital Signs
Financial ratios serve as a company’s DNA, uncovering hidden risks and operational strengths crucial for investment decisions.
Emerson Electric Co.
Emerson shows a neutral ROE at 11.3% with a favorable net margin of 12.7%, but its ROIC lags at 4.6%, below WACC at 8.8%. The stock appears expensive, with a P/E of 32.4 and a stretched P/B of 3.7. Dividend yield is moderate at 1.6%, suggesting steady shareholder returns amid some operational inefficiencies.
A. O. Smith Corporation
A. O. Smith commands a robust ROE of 25.6% and net margin of 14.3%, with a strong ROIC of 23.9% exceeding WACC of 10.1%. Valuation is reasonable, with a P/E of 17.1 and a high P/B of 4.4. The dividend yield of 2.1% reflects solid shareholder rewards backed by efficient asset use and low leverage.
Premium Valuation vs. Operational Safety
A. O. Smith offers a superior balance of profitability and valuation risk with mostly favorable ratios, while Emerson’s stretched valuation and lower capital returns pose caution. Growth-oriented investors may prefer A. O. Smith’s efficiency, while value-focused profiles might scrutinize Emerson’s mixed signals more closely.
Which one offers the Superior Shareholder Reward?
I compare Emerson Electric Co. (EMR) and A. O. Smith Corporation (AOS) based on their dividend yield, payout ratio, and buyback intensity. EMR yields 1.6% with a 52% payout, supported by strong free cash flow coverage (1.9x), and maintains moderate buybacks. AOS offers a slightly higher yield near 2.1%, but with a lower payout ratio around 36%, indicating room for growth. AOS’s free cash flow coverage exceeds 2.3x, reflecting a more conservative and sustainable distribution policy. Both companies prioritize buybacks, but AOS’s lower leverage (0.09 debt/equity vs. EMR’s 0.68) bolsters its capacity. I find AOS’s balanced dividend and buyback model more sustainable and attractive for total shareholder return in 2026.
Comparative Score Analysis: The Strategic Profile
The radar chart reveals the fundamental DNA and trade-offs of Emerson Electric Co. and A. O. Smith Corporation:
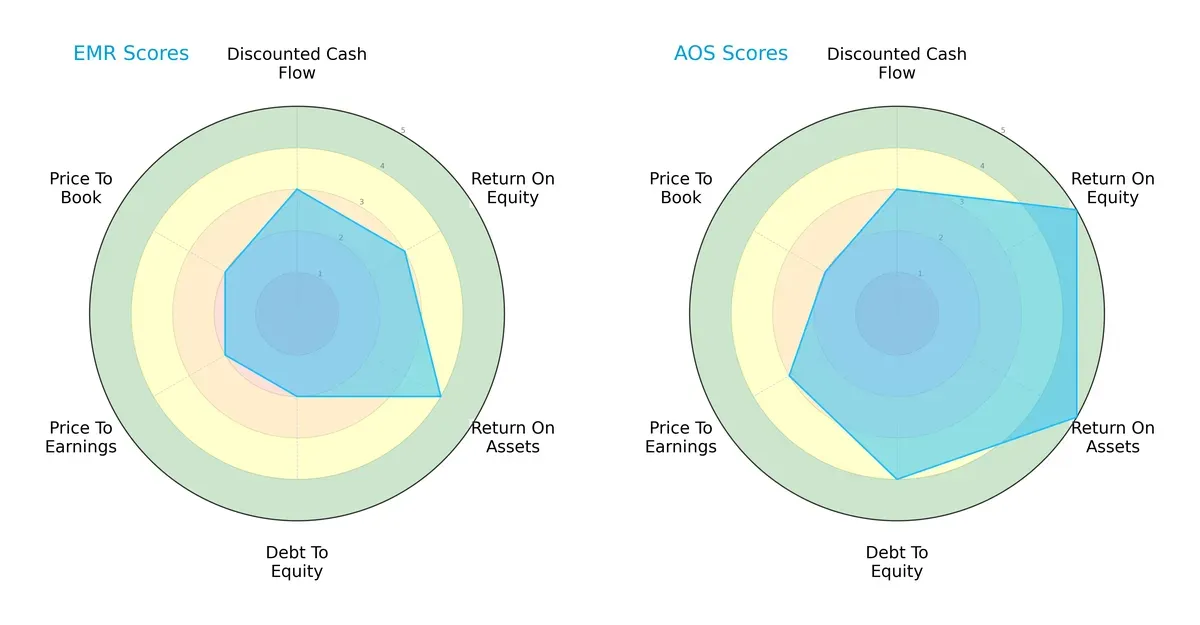
A. O. Smith outperforms Emerson Electric with a more balanced and favorable profile, scoring higher in ROE (5 vs. 3), ROA (5 vs. 4), and Debt/Equity (4 vs. 2). Emerson shows moderate DCF and valuation scores but relies more heavily on asset utilization. A. O. Smith’s superior financial leverage and profitability metrics mark it as the stronger strategic player.
Bankruptcy Risk: Solvency Showdown
The Altman Z-Score gap signals A. O. Smith’s stronger solvency position, suggesting superior resilience in this economic cycle:
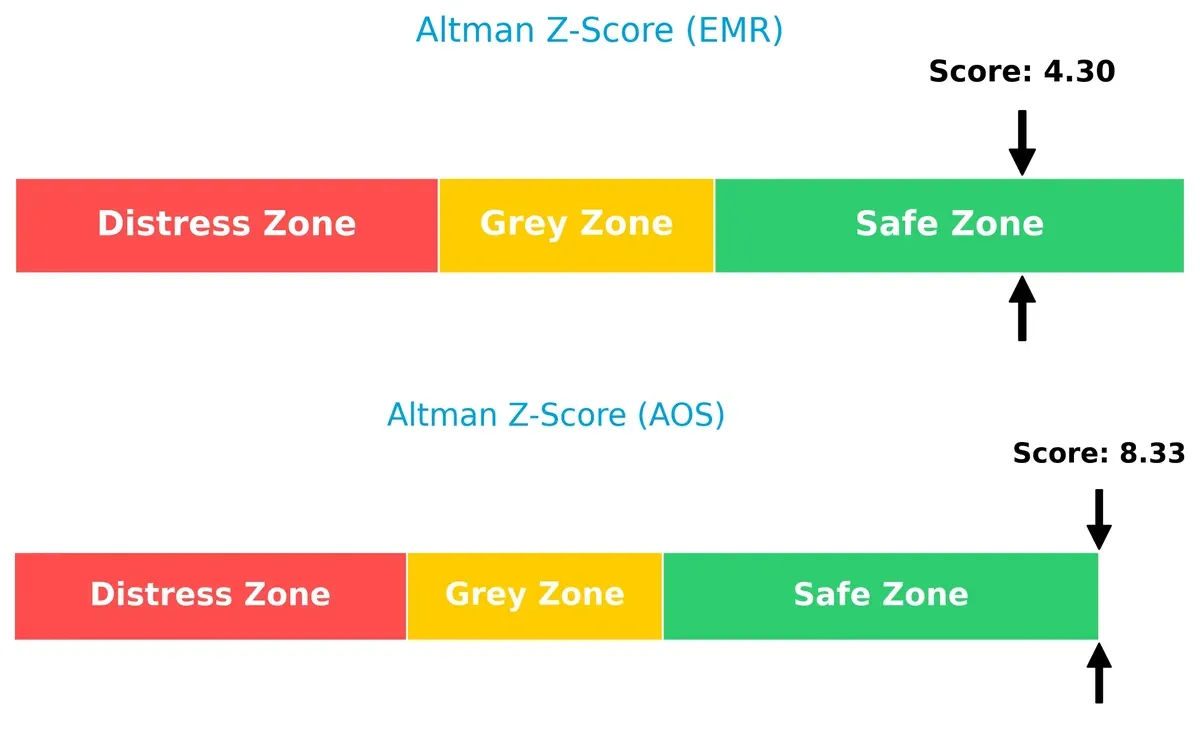
A. O. Smith’s 8.33 score places it deep in the safe zone, well ahead of Emerson’s 4.30. Both firms avoid distress, but Emerson’s lower score warrants caution amid tightening credit conditions.
Financial Health: Quality of Operations
Both companies score 7 on the Piotroski F-Score, indicating strong financial health with no immediate red flags:
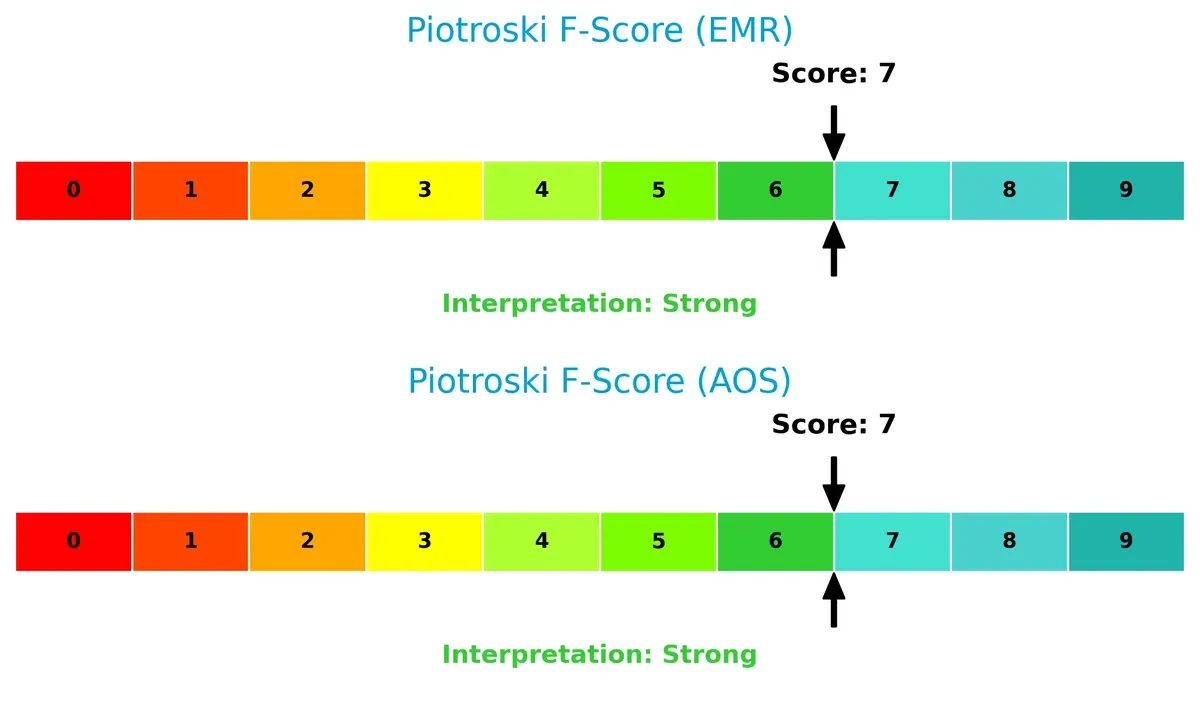
A tie in internal quality metrics reflects solid operational management for Emerson and A. O. Smith. Investors can trust each firm’s fundamentals, but Emerson’s weaker leverage profile still demands close monitoring.
How are the two companies positioned?
This section dissects the operational DNA of Emerson Electric Co. and A. O. Smith by comparing their revenue distribution and internal dynamics. The goal is to confront their economic moats and identify which model offers the most resilient competitive advantage today.
Revenue Segmentation: The Strategic Mix
This visual comparison dissects how Emerson Electric Co. and A. O. Smith Corporation diversify their income streams and where their primary sector bets lie:
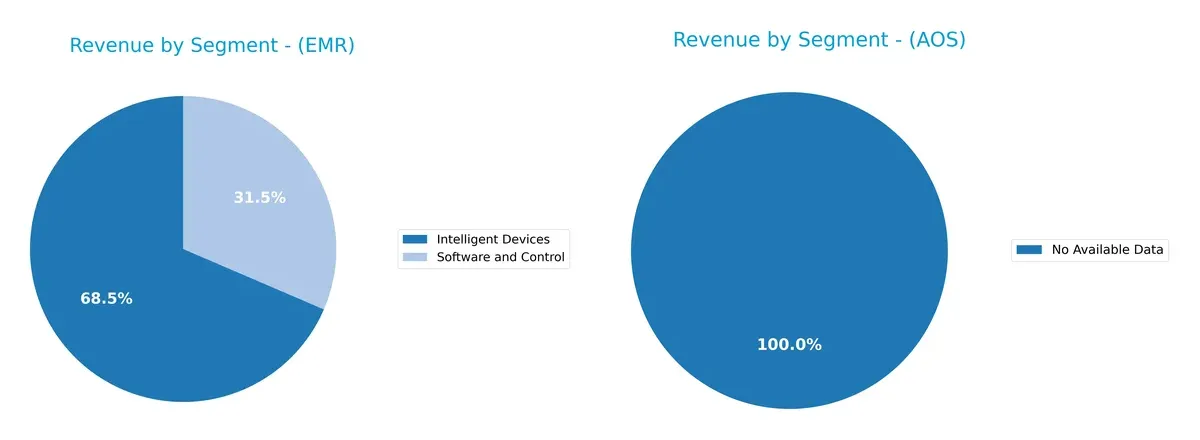
Emerson Electric Co. anchors its revenue heavily in “Intelligent Devices” at $12.4B and “Software and Control” at $5.7B, reflecting a strong industrial automation focus. In contrast, A. O. Smith lacks available segment data, preventing meaningful comparison. Emerson’s mix shows an ecosystem lock-in strategy, leveraging automation infrastructure, but it carries concentration risk by relying chiefly on two segments.
Strengths and Weaknesses Comparison
This table compares the Strengths and Weaknesses of Emerson Electric Co. and A. O. Smith Corporation:
Emerson Electric Co. Strengths
- Diverse revenue streams from intelligent devices and software
- Strong presence across Americas, Asia, Europe
- Favorable net margin (12.73%) and interest coverage (13.38)
- Efficient fixed asset turnover (5.14)
A. O. Smith Corporation Strengths
- High profitability with net margin (14.26%), ROE (25.64%), ROIC (23.94%)
- Low debt levels with favorable debt-to-assets (6.11%)
- Strong liquidity (current ratio 1.5)
- Robust global presence in North America and Rest of World
- Favorable asset turnover (1.22) and interest coverage (54.03)
Emerson Electric Co. Weaknesses
- Below-par liquidity ratios (current 0.88, quick 0.65) raise short-term risk
- ROIC (4.6%) below WACC (8.84%) signals capital inefficiency
- Unfavorable valuation multiples (PE 32.42, PB 3.67)
- Low asset turnover (0.43) implies underused assets
A. O. Smith Corporation Weaknesses
- Higher WACC (10.08%) vs. ROIC demands careful capital allocation
- Unfavorable PB ratio (4.39) may indicate premium valuation
- Exposure concentrated mainly in North America and Rest of World, limiting diversification
Emerson Electric shows solid diversification and stable profitability but faces liquidity and capital efficiency challenges. A. O. Smith delivers strong profitability and financial health, though higher capital costs and modest geographic diversification pose potential constraints.
The Moat Duel: Analyzing Competitive Defensibility
A structural moat protects long-term profits from relentless competitive erosion. Without it, market share and margins quickly vanish:
Emerson Electric Co.: Diverse Industrial Solutions Moat
Emerson’s moat stems from broad product diversification and embedded automation tech. Yet, its declining ROIC signals weakening capital efficiency. New markets in process control could stabilize margins in 2026.
A. O. Smith Corporation: Water Heating Efficiency Moat
A. O. Smith leverages cost advantages and brand strength in water heating. Its rising ROIC confirms growing value creation. Expanding in emerging markets offers solid growth catalysts for 2026.
Capital Efficiency vs. Market Breadth: The Moat Showdown
A. O. Smith boasts a deeper, expanding moat with rising ROIC and value creation. Emerson’s broad portfolio lacks capital efficiency, risking profit erosion. A. O. Smith stands better poised to defend market share.
Which stock offers better returns?
Over the past 12 months, Emerson Electric Co. surged 33.4%, showing accelerating gains, while A. O. Smith Corporation declined 14.4%, despite recent signs of recovery.
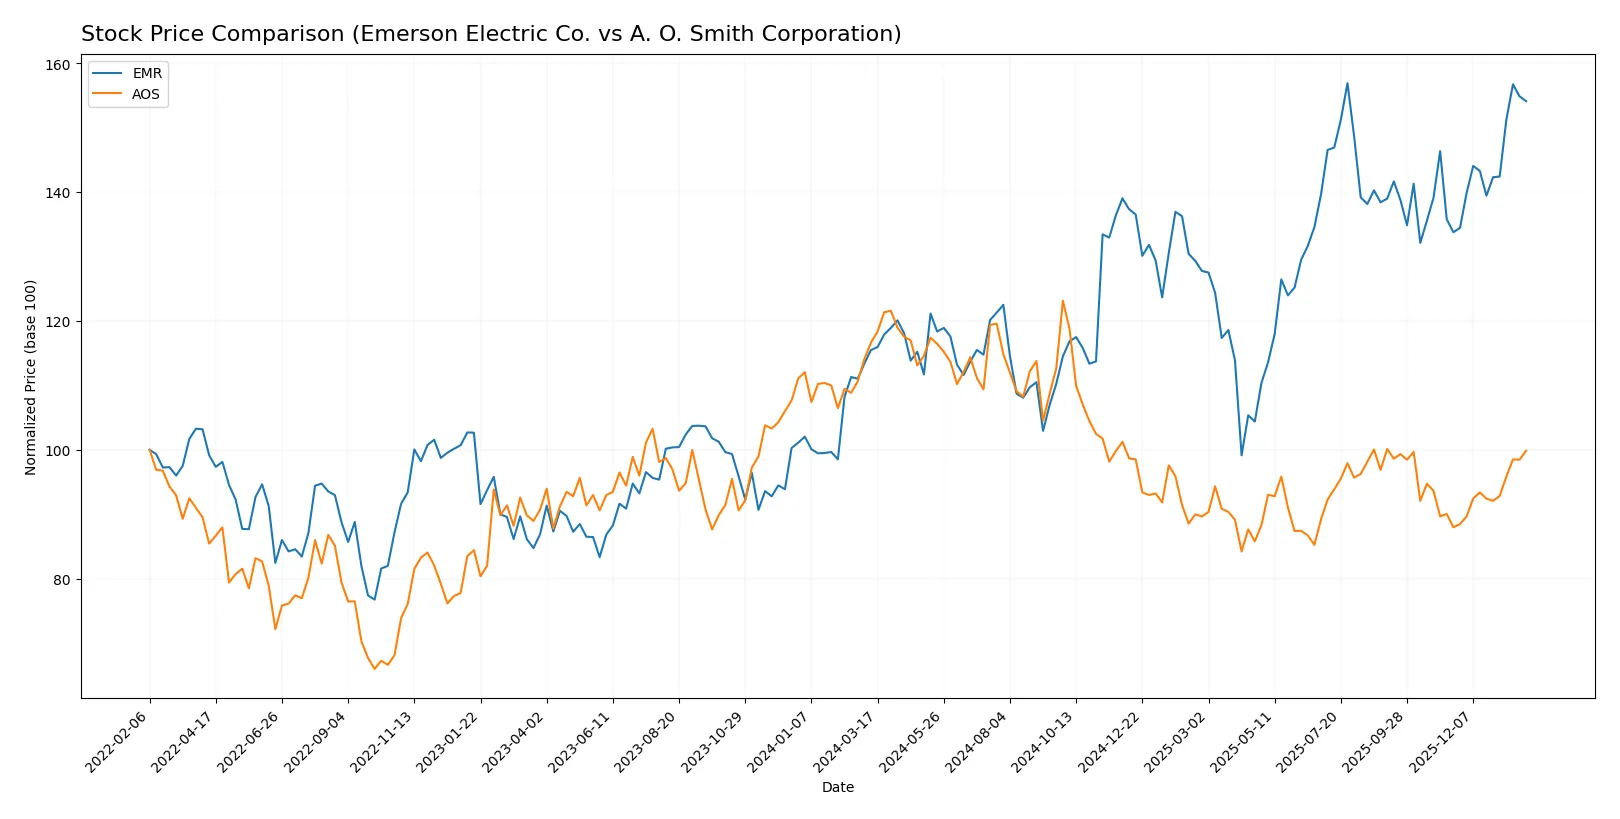
Trend Comparison
Emerson Electric Co. posted a 33.4% price increase over the past year, signaling a bullish trend with accelerating momentum and a high of 149.63. Volatility is notable with a 13.03 standard deviation.
A. O. Smith Corporation fell 14.4% in the same period, marking a bearish trend. However, recent gains of 13.5% indicate a possible rebound. Volatility remains moderate at a 7.87 standard deviation.
Emerson Electric Co.’s sustained bullish trend and larger overall gains outperform A. O. Smith Corporation’s weaker, albeit recently improving, market performance.
Target Prices
Analysts present a moderately bullish consensus for Emerson Electric Co. and A. O. Smith Corporation.
| Company | Target Low | Target High | Consensus |
|---|---|---|---|
| Emerson Electric Co. | 125 | 170 | 149.67 |
| A. O. Smith Corporation | 75 | 85 | 79 |
Emerson’s consensus target of 149.67 slightly exceeds its current price of 146.96, indicating modest upside potential. A. O. Smith’s target consensus of 79 is well above its current 73.49, suggesting room for appreciation according to analysts.

Don’t Let Luck Decide Your Entry Point
Optimize your entry points with our advanced ProRealTime indicators. You’ll get efficient buy signals with precise price targets for maximum performance. Start outperforming now!
How do institutions grade them?
Emerson Electric Co. Grades
The following table lists recent grade actions by notable financial institutions for Emerson Electric Co.:
| Grading Company | Action | New Grade | Date |
|---|---|---|---|
| Oppenheimer | Downgrade | Perform | 2026-01-27 |
| JP Morgan | Maintain | Neutral | 2026-01-16 |
| Wells Fargo | Maintain | Equal Weight | 2026-01-07 |
| Barclays | Maintain | Equal Weight | 2026-01-07 |
| UBS | Upgrade | Buy | 2026-01-05 |
| Jefferies | Downgrade | Hold | 2025-12-10 |
| JP Morgan | Maintain | Neutral | 2025-11-10 |
| RBC Capital | Maintain | Outperform | 2025-11-06 |
| Barclays | Maintain | Equal Weight | 2025-11-06 |
| RBC Capital | Maintain | Outperform | 2025-10-16 |
A. O. Smith Corporation Grades
Below is the recent grade history from major institutions for A. O. Smith Corporation:
| Grading Company | Action | New Grade | Date |
|---|---|---|---|
| Stifel | Maintain | Buy | 2026-01-30 |
| Citigroup | Maintain | Neutral | 2026-01-30 |
| DA Davidson | Maintain | Neutral | 2025-11-13 |
| Stifel | Maintain | Buy | 2025-10-29 |
| Citigroup | Maintain | Neutral | 2025-10-29 |
| Oppenheimer | Maintain | Outperform | 2025-07-28 |
| UBS | Maintain | Neutral | 2025-07-28 |
| Baird | Maintain | Neutral | 2025-07-25 |
| Stifel | Maintain | Buy | 2025-07-25 |
| Stifel | Maintain | Buy | 2025-07-21 |
Which company has the best grades?
A. O. Smith Corporation consistently holds Buy and Outperform ratings, suggesting stronger institutional confidence. Emerson Electric shows mixed grades with recent downgrades, implying more caution from analysts. This divergence may influence investor sentiment and portfolio positioning.
Risks specific to each company
The following categories identify critical pressure points and systemic threats facing Emerson Electric Co. and A. O. Smith Corporation in the 2026 market environment:
1. Market & Competition
Emerson Electric Co.
- Faces intense competition in industrial machinery; margin pressures persist due to innovation demands and global market shifts.
A. O. Smith Corporation
- Strong foothold in water heating and treatment; competitive pricing and brand diversity bolster resilience but face cyclical demand risks.
2. Capital Structure & Debt
Emerson Electric Co.
- Moderate leverage with debt-to-equity at 0.68; current and quick ratios below 1 signal liquidity constraints and potential short-term stress.
A. O. Smith Corporation
- Low leverage with debt-to-equity at 0.09; healthier liquidity ratios provide cushion and financial flexibility amid market fluctuations.
3. Stock Volatility
Emerson Electric Co.
- Beta at 1.25 indicates moderately high volatility; stock price range wide, reflecting sensitivity to market cycles and sector dynamics.
A. O. Smith Corporation
- Beta at 1.35 shows higher volatility; price range narrower, suggesting more stable investor sentiment despite sector cyclicality.
4. Regulatory & Legal
Emerson Electric Co.
- Exposure to global regulatory changes in industrial and environmental standards; compliance costs could rise, impacting margins.
A. O. Smith Corporation
- Faces regulatory scrutiny mainly in product safety and environmental compliance; expanding global footprint increases complexity.
5. Supply Chain & Operations
Emerson Electric Co.
- Complex global supply chain vulnerable to disruptions; raw material cost inflation pressures manufacturing efficiencies.
A. O. Smith Corporation
- Supply chain more concentrated geographically; operational efficiencies supported by strong vendor relationships but sensitive to trade policies.
6. ESG & Climate Transition
Emerson Electric Co.
- Increasing pressure to innovate energy-efficient products; transition risks from fossil fuel reliance in some segments.
A. O. Smith Corporation
- Proactive in sustainable water heating solutions; ESG initiatives align with climate goals, enhancing long-term competitiveness.
7. Geopolitical Exposure
Emerson Electric Co.
- Diverse global presence subjects it to geopolitical tensions, tariffs, and currency risks affecting supply and demand.
A. O. Smith Corporation
- Significant exposure to North America and Asia; geopolitical tensions in key markets could disrupt sales and supply chains.
Which company shows a better risk-adjusted profile?
A. O. Smith faces fewer liquidity and leverage risks, with superior profitability and operational efficiency. Emerson Electric confronts greater short-term financial pressure and broader geopolitical complexity. The dominant risk for Emerson is liquidity strain; for A. O. Smith, geopolitical exposure. A. O. Smith’s strong capital structure and higher ROIC provide a clearer risk-adjusted advantage.
Final Verdict: Which stock to choose?
Emerson Electric Co. stands out for its operational resilience and strong cash flow generation, a true cash machine in industrial automation. However, its declining ROIC and tight liquidity ratios signal a need for vigilance. It suits portfolios aiming for stable income with moderate growth exposure.
A. O. Smith Corporation commands a durable moat with robust ROIC well above its cost of capital, reflecting superior capital efficiency and profitability. Its conservative leverage and solid liquidity offer better safety than Emerson. This stock fits well in a GARP portfolio focused on sustainable growth with reasonable risk.
If you prioritize durable competitive advantage and efficient capital use, A. O. Smith offers a compelling choice due to its growing profitability and safer financial structure. However, if your focus is on operational cash strength with some tolerance for cyclical risks, Emerson’s cash flow prowess could be appealing despite its value erosion concerns.
Disclaimer: Investment carries a risk of loss of initial capital. The past performance is not a reliable indicator of future results. Be sure to understand risks before making an investment decision.
Go Further
I encourage you to read the complete analyses of Emerson Electric Co. and A. O. Smith Corporation to enhance your investment decisions: