Home > Comparison > Industrials > ETN vs AOS
The strategic rivalry between Eaton Corporation plc and A. O. Smith Corporation shapes the industrial machinery sector’s competitive landscape. Eaton operates as a global power management giant with diversified industrial and aerospace segments. In contrast, A. O. Smith focuses on high-margin water heating and treatment solutions for residential and commercial markets. This analysis will assess which company offers a superior risk-adjusted return, balancing scale against specialization, for a diversified portfolio.
Table of contents
Companies Overview
Eaton Corporation plc and A. O. Smith Corporation stand as key players in the industrial machinery sector, shaping global markets.
Eaton Corporation plc: Power Management Leader
Eaton dominates as a power management company with diverse segments including electrical, aerospace, and vehicle components. Its revenue stems from industrial and commercial electrical products alongside hydraulic and aerospace systems. In 2026, Eaton sharpens its focus on expanding its eMobility segment, targeting growth in hybrid power systems and power distribution solutions.
A. O. Smith Corporation: Water Heating Specialist
A. O. Smith specializes in residential and commercial water heating and water treatment products. It generates revenue through a broad product portfolio including gas and electric water heaters, boilers, and filtration systems, distributed via wholesale and retail channels. The company prioritizes innovation in energy-efficient heating technology and expansion in international markets in 2026.
Strategic Collision: Similarities & Divergences
Both firms operate in industrial machinery but diverge in core philosophy: Eaton pursues a broad diversified portfolio with a power systems emphasis, while A. O. Smith focuses on specialized water heating solutions. Their primary battleground lies in advancing energy efficiency and sustainability. Eaton’s scale offers resilience, contrasting with A. O. Smith’s niche innovation-driven profile.
Income Statement Comparison
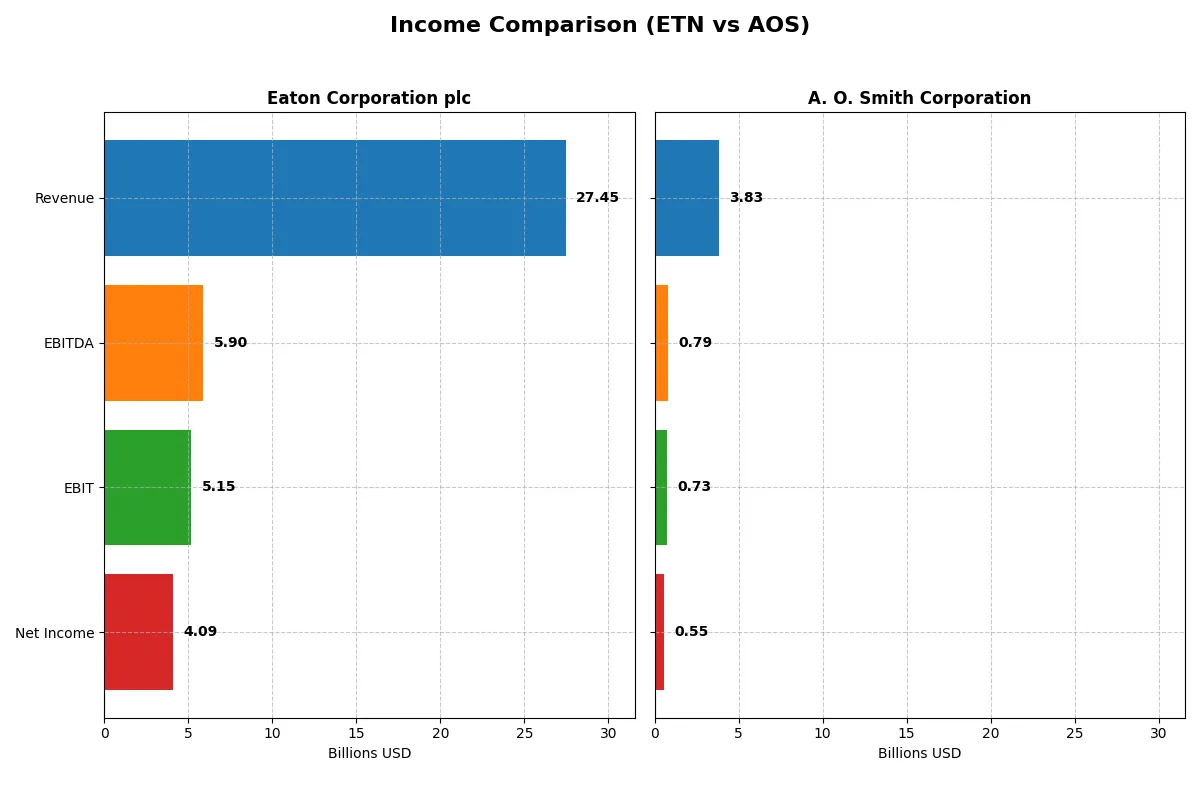
The following data dissects the core profitability and scalability of both corporate engines to reveal who dominates the bottom line:
| Metric | Eaton Corporation plc (ETN) | A. O. Smith Corporation (AOS) |
|---|---|---|
| Revenue | 27.4B | 3.83B |
| Cost of Revenue | 17.1B | 2.34B |
| Operating Expenses | 5.08B | 759M |
| Gross Profit | 10.3B | 1.49B |
| EBITDA | 5.90B | 792M |
| EBIT | 5.15B | 729M |
| Interest Expense | 264M | 13.5M |
| Net Income | 4.09B | 546M |
| EPS | 10.49 | 3.86 |
| Fiscal Year | 2025 | 2025 |
Income Statement Analysis: The Bottom-Line Duel
This income statement comparison reveals how efficiently each company converts revenue into profit, highlighting their operational strength and financial health.
Eaton Corporation plc Analysis
Eaton’s revenue climbed 10.3% to $27.4B in 2025, while net income surged 7.8% to $4.1B. Its gross margin remains solid at 37.6%, and net margin holds a healthy 14.9%. The firm demonstrates robust momentum, with operating expenses growing proportionately to revenue, underscoring disciplined cost control and efficient capital allocation.
A. O. Smith Corporation Analysis
A. O. Smith’s revenue edged up slightly by 0.3% to $3.8B in 2025, with net income rising 2.4% to $546M. Gross margin stands at a strong 38.8%, and net margin at 14.3%. However, growth momentum appears subdued, reflecting stable but modest expansion, with operating expenses nearly flat, indicating tight cost management but limited scale leverage.
Verdict: Strong Growth vs. Stable Profitability
Eaton outpaces A. O. Smith in revenue and net income growth, showcasing superior operating leverage and margin expansion. Eaton’s nearly 40% revenue growth over five years and 90% net income increase mark it as the more dynamic profit generator. Investors seeking growth and efficiency may find Eaton’s profile more compelling, while A. O. Smith offers steadier, lower-scale profitability.
Financial Ratios Comparison
These vital ratios act as a diagnostic tool to expose the underlying fiscal health, valuation premiums, and capital efficiency of the companies compared below:
| Ratios | Eaton Corporation plc (ETN) | A. O. Smith Corporation (AOS) |
|---|---|---|
| ROE | 21.1% | 25.6% |
| ROIC | 13.1% | 23.9% |
| P/E | 30.2 | 17.1 |
| P/B | 6.37 | 4.39 |
| Current Ratio | 1.32 | 1.50 |
| Quick Ratio | 0.81 | 0.94 |
| D/E | 0.54 | 0.09 |
| Debt-to-Assets | 25.5% | 6.1% |
| Interest Coverage | 19.8 | 53.9 |
| Asset Turnover | 0.67 | 1.22 |
| Fixed Asset Turnover | 5.40 | 5.62 |
| Payout ratio | 39.5% | 35.8% |
| Dividend yield | 1.31% | 2.09% |
| Fiscal Year | 2025 | 2025 |
Efficiency & Valuation Duel: The Vital Signs
Financial ratios act as the company’s DNA, unveiling operational strengths and hidden risks crucial for investment decisions.
Eaton Corporation plc
Eaton delivers solid profitability with a 21.05% ROE and a 14.9% net margin, signaling operational efficiency. However, its elevated P/E of 30.24 suggests a stretched valuation compared to sector norms. Eaton returns value through a modest 1.31% dividend yield, balancing shareholder rewards with reinvestment in R&D at 2.9% of revenue.
A. O. Smith Corporation
A. O. Smith boasts a stronger 25.64% ROE and 14.26% net margin, reflecting superior capital efficiency. Its P/E ratio of 17.13 appears reasonable, indicating a fairly valued stock. The company supports shareholders with a 2.09% dividend yield, while maintaining robust reinvestment in growth, evidenced by high returns on invested capital (23.94%).
Premium Valuation vs. Operational Safety
A. O. Smith offers a more attractive risk-reward tradeoff with higher profitability and a fairer valuation. Eaton’s premium multiples impose valuation risk despite solid returns. Investors favoring growth and capital efficiency may gravitate toward A. O. Smith, while those prioritizing stable dividends might consider Eaton’s profile.
Which one offers the Superior Shareholder Reward?
I observe Eaton Corporation plc (ETN) delivers steady dividends with a 1.3% yield and a 39% payout ratio, supported by strong free cash flow coverage. Its buyback program complements distributions but is less aggressive than A. O. Smith Corporation’s (AOS). AOS offers a higher dividend yield near 2.1%, a lower payout ratio around 36%, and more robust buybacks, fueled by superior operating cash flow ratios and lower leverage. I see AOS’s distribution model as more sustainable, balancing capital return with growth capacity. For 2026 investors seeking total return, AOS presents a more attractive profile due to its stronger cash flow, disciplined payout, and aggressive buyback strategy.
Comparative Score Analysis: The Strategic Profile
The radar chart reveals the fundamental DNA and trade-offs of Eaton Corporation plc and A. O. Smith Corporation, highlighting strategic strengths and weaknesses:
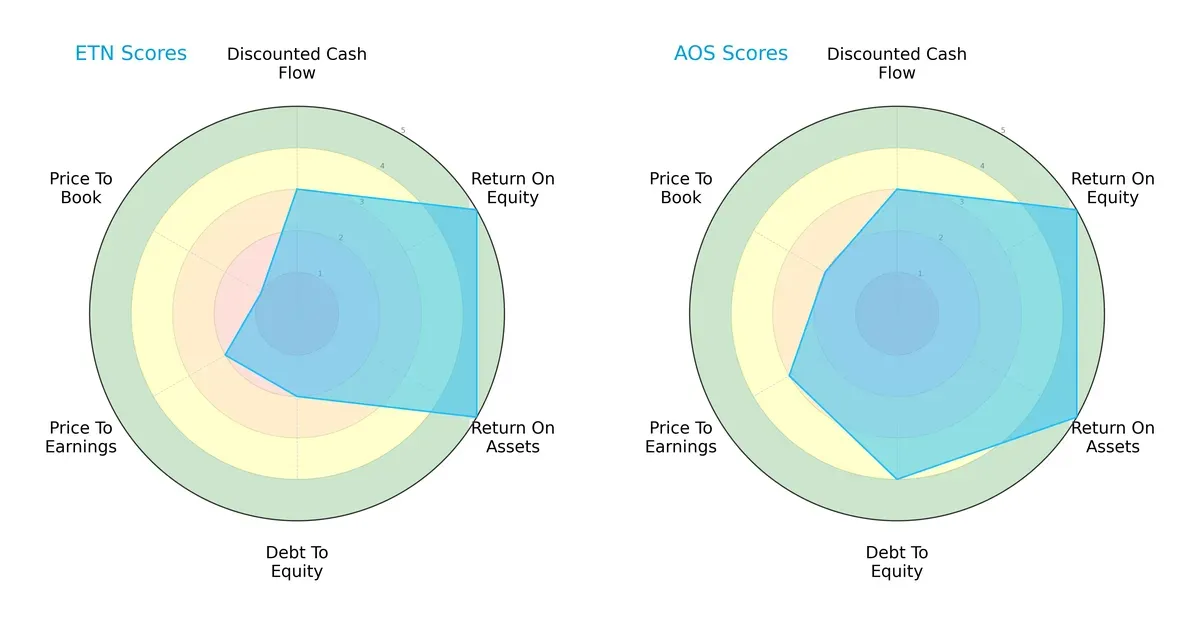
A. O. Smith demonstrates a more balanced profile with favorable debt-to-equity and valuation scores, supporting its overall “A” rating. Eaton shows strength in profitability metrics (ROE and ROA) but struggles with valuation, especially price-to-book, which signals potential market skepticism. Eaton relies heavily on operational efficiency, while A. O. Smith combines solid capital structure with moderate valuation appeal.
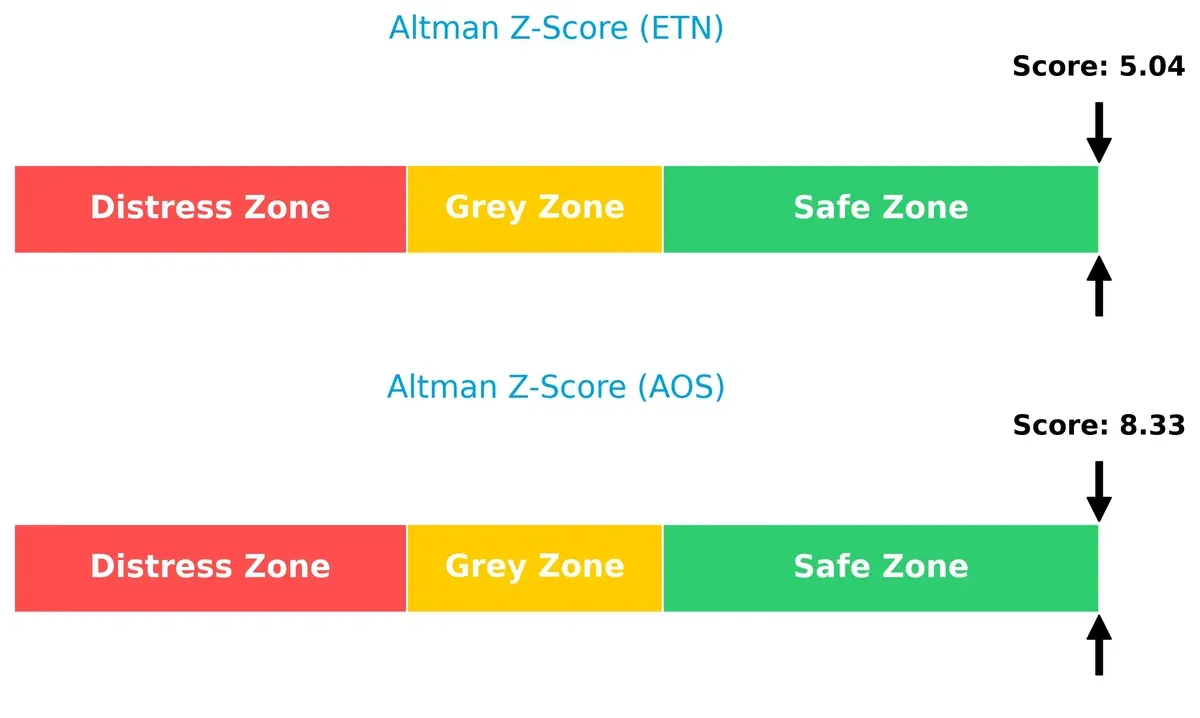
Bankruptcy Risk: Solvency Showdown
A. O. Smith’s Altman Z-Score of 8.33 significantly outperforms Eaton’s 5.04, suggesting stronger solvency and lower bankruptcy risk for A. O. Smith in this cycle:
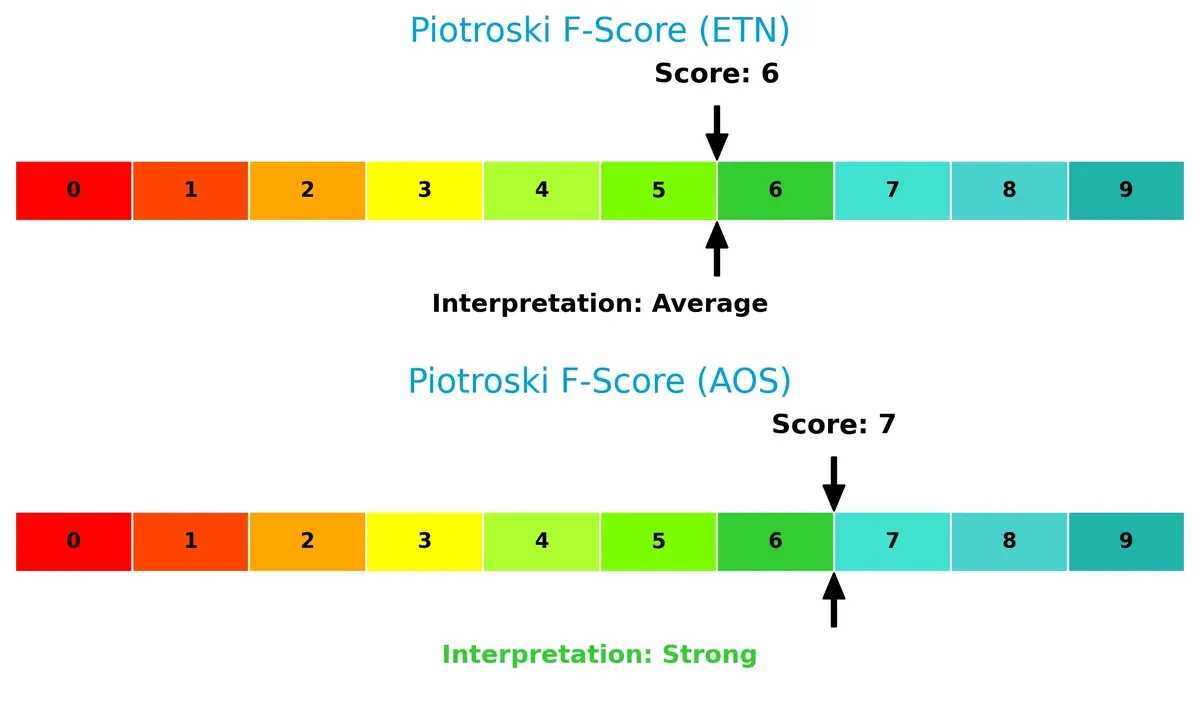
Financial Health: Quality of Operations
A. O. Smith’s Piotroski F-Score of 7 versus Eaton’s 6 indicates a superior internal financial health, with Eaton showing slight red flags in operational quality and balance sheet efficiency:
How are the two companies positioned?
This section dissects Eaton and A. O. Smith’s operational DNA by comparing revenue distribution and internal dynamics. The goal is to confront their economic moats and identify which model offers the most resilient competitive advantage today.
Revenue Segmentation: The Strategic Mix
The following visual comparison dissects how Eaton Corporation plc and A. O. Smith Corporation diversify their income streams and where their primary sector bets lie:
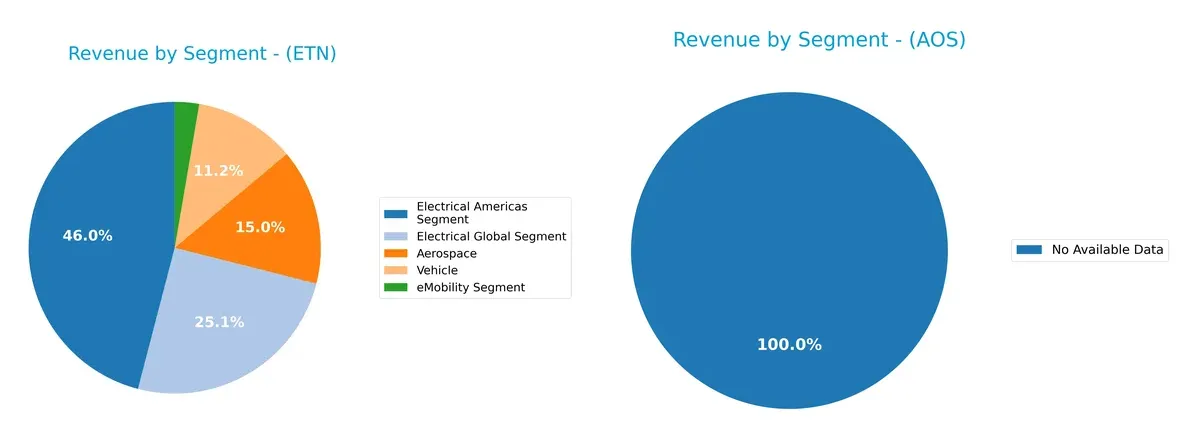
Eaton’s revenue divides across Aerospace ($3.74B), Electrical Americas ($11.44B), Electrical Global ($6.25B), Vehicle ($2.79B), and eMobility ($669M). This mix reveals a broad industrial footprint anchored by electrical segments. In contrast, A. O. Smith lacks available data for segmentation analysis, preventing direct comparison. Eaton’s diversified base reduces concentration risk and leverages infrastructure dominance, especially in electrical markets. This strategy contrasts with companies relying heavily on a single segment for growth.
Strengths and Weaknesses Comparison
This table compares the Strengths and Weaknesses of Eaton Corporation plc (ETN) and A. O. Smith Corporation (AOS):
ETN Strengths
- Diversified revenue across Aerospace, Electrical, Vehicle, and eMobility segments
- Strong U.S. market presence with $15.15B revenue
- Favorable net margin (14.9%) and ROE (21.05%)
- Low debt-to-assets ratio (25.53%) and high interest coverage (19.5)
AOS Strengths
- Favorable profitability metrics: net margin (14.26%), ROE (25.64%), and ROIC (23.94%)
- Low debt-equity (0.09) and debt-to-assets (6.11%) ratios
- Strong asset turnover (1.22) and interest coverage (54.03)
- Higher dividend yield (2.09%)
- Balanced geographic revenue with North America and Rest of World
ETN Weaknesses
- Unfavorable valuation multiples: PE (30.24) and PB (6.37) suggest possible overvaluation
- Neutral liquidity ratios (current 1.32, quick 0.81) could pressure short-term flexibility
- Moderate asset turnover (0.67) lags AOS
AOS Weaknesses
- Unfavorable weighted average cost of capital (10.06%) exceeds ROIC gap
- Unfavorable PB ratio (4.39) may indicate valuation risk
- Geographic revenue less diversified, concentrated mainly in North America and Rest of World
ETN shows strength in diversification and solid profitability but faces valuation and liquidity concerns. AOS excels in operational efficiency and low leverage but must address cost of capital and geographic concentration risks. Both companies display distinct profiles shaping their strategic outlooks.
The Moat Duel: Analyzing Competitive Defensibility
A structural moat is the only barrier protecting long-term profits from relentless competition and margin erosion. Let’s examine the key moats for these industrial giants:
Eaton Corporation plc: Diversified Industrial Powerhouse with Scale Advantage
Eaton’s moat stems from its broad product portfolio and global scale, driving stable margins and a growing ROIC well above WACC. Expansion in eMobility deepens its competitive edge in 2026.
A. O. Smith Corporation: Focused Water Heating Specialist with Efficiency Moat
A. O. Smith leverages manufacturing efficiency and brand strength in water heating, reflected in a superior ROIC premium over WACC. Its steady innovation in water treatment fuels moderate growth potential.
Scale Leadership vs. Operational Efficiency: Who Holds the Wider Moat?
Eaton boasts a wider moat due to diversified markets and faster ROIC growth, despite A. O. Smith’s higher ROIC spread. Eaton’s scale and innovation position it better to defend market share long term.
Which stock offers better returns?
Both Eaton Corporation plc and A. O. Smith Corporation exhibit distinct price movements and trading dynamics over the past year, reflecting contrasting market sentiments and momentum shifts.
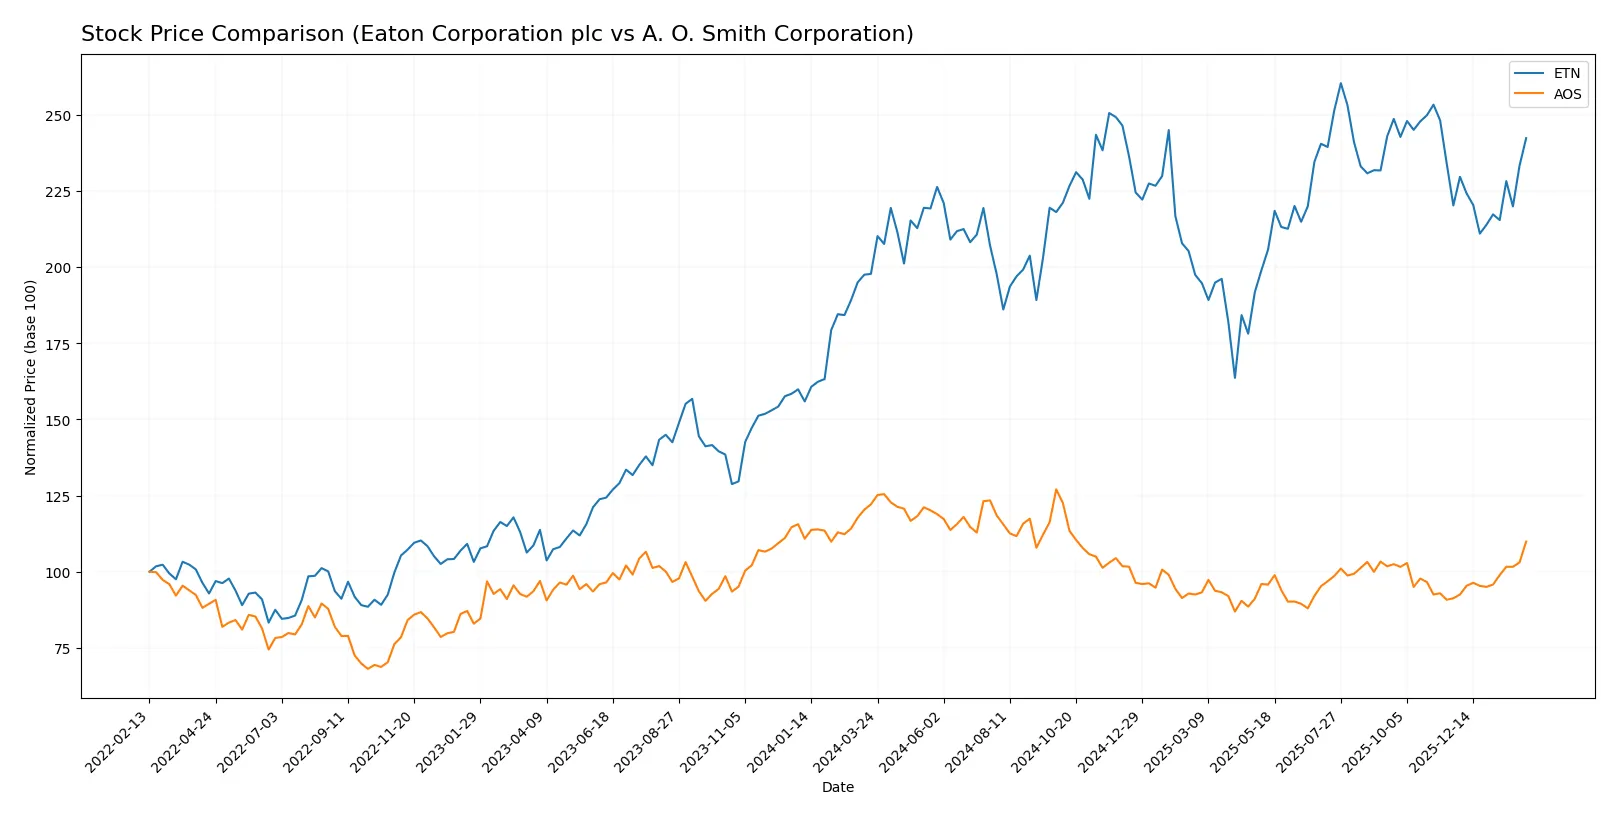
Trend Comparison
Eaton Corporation plc’s stock price rose 22.52% over the past year, showing a bullish trend with accelerating momentum and a high volatility level (29.41 std. dev.). The stock hit a high of 392.17 and a low of 246.52.
A. O. Smith Corporation experienced a 10.01% decline over the same period, indicating a bearish trend despite recent acceleration. Its volatility is lower at 7.79 std. dev., with a high of 90.59 and a low of 61.99.
Comparing both, Eaton Corporation plc delivered the highest market performance with a strong upward trend, while A. O. Smith’s stock showed a significant overall decline despite recent gains.
Target Prices
Analysts present a balanced target consensus for Eaton Corporation plc and A. O. Smith Corporation, reflecting moderate upside potential.
| Company | Target Low | Target High | Consensus |
|---|---|---|---|
| Eaton Corporation plc | 295 | 495 | 395.42 |
| A. O. Smith Corporation | 75 | 85 | 78 |
Eaton’s consensus target of 395.42 suggests a 8% upside from the current 365 price, indicating solid confidence. A. O. Smith’s target aligns closely with its 78.37 price, signaling limited near-term growth expectations.

Don’t Let Luck Decide Your Entry Point
Optimize your entry points with our advanced ProRealTime indicators. You’ll get efficient buy signals with precise price targets for maximum performance. Start outperforming now!
How do institutions grade them?
The following tables summarize the most recent institutional grades for Eaton Corporation plc and A. O. Smith Corporation:
Eaton Corporation plc Grades
This table shows the latest grades issued by established financial firms for Eaton Corporation plc.
| Grading Company | Action | New Grade | Date |
|---|---|---|---|
| Wells Fargo | Maintain | Equal Weight | 2026-02-04 |
| JP Morgan | Maintain | Overweight | 2026-01-16 |
| HSBC | Upgrade | Buy | 2026-01-16 |
| Morgan Stanley | Maintain | Overweight | 2026-01-12 |
| Citigroup | Maintain | Buy | 2026-01-12 |
| Barclays | Maintain | Equal Weight | 2026-01-07 |
| UBS | Downgrade | Neutral | 2026-01-05 |
| Wells Fargo | Maintain | Equal Weight | 2025-12-18 |
| Wolfe Research | Upgrade | Outperform | 2025-12-09 |
| JP Morgan | Maintain | Overweight | 2025-11-06 |
A. O. Smith Corporation Grades
This table lists recent grades from reputable analysts for A. O. Smith Corporation.
| Grading Company | Action | New Grade | Date |
|---|---|---|---|
| DA Davidson | Maintain | Neutral | 2026-02-02 |
| Citigroup | Maintain | Neutral | 2026-01-30 |
| Stifel | Maintain | Buy | 2026-01-30 |
| DA Davidson | Maintain | Neutral | 2025-11-13 |
| Citigroup | Maintain | Neutral | 2025-10-29 |
| Stifel | Maintain | Buy | 2025-10-29 |
| Oppenheimer | Maintain | Outperform | 2025-07-28 |
| UBS | Maintain | Neutral | 2025-07-28 |
| Baird | Maintain | Neutral | 2025-07-25 |
| Stifel | Maintain | Buy | 2025-07-25 |
Which company has the best grades?
Eaton Corporation plc holds a broader range of positive grades, including multiple Overweight and Buy ratings, and recent upgrades. A. O. Smith Corporation maintains mostly Neutral and Buy ratings without recent upgrades. Eaton’s stronger grades may signal higher analyst confidence, affecting investor sentiment and portfolio positioning.
Risks specific to each company
The following categories identify critical pressure points and systemic threats facing Eaton Corporation plc and A. O. Smith Corporation in the 2026 market environment:
1. Market & Competition
Eaton Corporation plc
- Faces intense competition in power management and industrial machinery sectors with global scale rivals.
A. O. Smith Corporation
- Competes in residential and commercial water heating with strong regional players and diversification challenges.
2. Capital Structure & Debt
Eaton Corporation plc
- Moderate leverage with debt-to-equity at 0.54; interest coverage strong at 19.5 times.
A. O. Smith Corporation
- Low leverage with debt-to-equity at 0.09 and very strong interest coverage of 54 times.
3. Stock Volatility
Eaton Corporation plc
- Beta of 1.19 indicates moderate sensitivity to market swings, typical for industrials.
A. O. Smith Corporation
- Higher beta at 1.34 suggests greater volatility and exposure to market fluctuations.
4. Regulatory & Legal
Eaton Corporation plc
- Operating globally, faces complex international compliance and regulatory risks.
A. O. Smith Corporation
- US-centric with some international exposure, regulatory risk more concentrated but less complex.
5. Supply Chain & Operations
Eaton Corporation plc
- Complex global supply chain for electrical and aerospace components increases operational risk.
A. O. Smith Corporation
- Supply chain focused on manufacturing water heaters with exposure to raw material cost volatility.
6. ESG & Climate Transition
Eaton Corporation plc
- Power management products align with energy efficiency trends, but climate regulation risk remains.
A. O. Smith Corporation
- Water heating products face pressure to innovate cleaner technologies amid tightening climate policies.
7. Geopolitical Exposure
Eaton Corporation plc
- Significant international footprint exposes it to geopolitical tensions and trade disruptions.
A. O. Smith Corporation
- More US-focused with limited but growing exposure to China and India geopolitical risks.
Which company shows a better risk-adjusted profile?
A. O. Smith faces lower financial and capital structure risks, reflected in its stronger debt metrics and Altman Z-score. Eaton’s broader geographic and operational scope introduces higher complexity and market risk. The higher beta and weaker price-to-book ratio for Eaton signal elevated valuation risk. A. O. Smith’s stronger Piotroski score and debt profile give it a more robust risk-adjusted stance. However, Eaton’s diversified product lines could offer resilience if managed prudently. Recent data show Eaton’s financial leverage and valuation multiples as key risk flags, while A. O. Smith’s volatility remains a caution for momentum investors.
Final Verdict: Which stock to choose?
Eaton Corporation plc (ETN) excels as a cash-generating powerhouse with a very favorable moat, reflecting efficient capital use and growing profitability. Its point of vigilance lies in a relatively high valuation that might limit near-term upside. ETN suits portfolios aiming for steady, value-creating industrial exposure.
A. O. Smith Corporation (AOS) commands a strategic moat through superior returns on invested capital and a conservative balance sheet. It offers better financial stability than ETN, with a strong free cash flow profile and attractive dividend yield. AOS fits well within GARP portfolios seeking growth with a margin of safety.
If you prioritize robust capital efficiency and a proven value creator, ETN outshines with its sustainable moat and income statement strength. However, if you seek a financially safer growth story supported by solid cash flows and dividends, AOS offers better stability and an appealing risk-reward profile.
Disclaimer: Investment carries a risk of loss of initial capital. The past performance is not a reliable indicator of future results. Be sure to understand risks before making an investment decision.
Go Further
I encourage you to read the complete analyses of Eaton Corporation plc and A. O. Smith Corporation to enhance your investment decisions: