Home > Comparison > Industrials > DOV vs AOS
The strategic rivalry between Dover Corporation and A. O. Smith Corporation defines the current trajectory of the industrial machinery sector. Dover operates a diversified equipment and components business spanning multiple end-markets, while A. O. Smith specializes in residential and commercial water heating and treatment solutions. This analysis pits broad industrial diversification against focused product specialization to identify which offers a superior risk-adjusted return for a diversified portfolio.
Table of contents
Companies Overview
Dover Corporation and A. O. Smith Corporation both hold pivotal roles in the industrial machinery sector. Their market presence shapes key infrastructure and utility services across multiple regions.
Dover Corporation: Diverse Industrial Solutions Leader
Dover Corporation commands a strong position in industrial machinery, generating revenue from equipment, software, and support services. Its engineered products serve aerospace, automation, and fluid handling markets. In 2026, Dover sharpened its focus on clean energy and digital solutions, reinforcing its competitive advantage through innovation and diversified end-markets.
A. O. Smith Corporation: Water Heating and Treatment Specialist
A. O. Smith Corporation excels in residential and commercial water heating and treatment systems. It earns primarily through water heaters, boilers, and filtration products distributed globally. In 2026, the company prioritized expanding its water treatment portfolio and e-commerce presence, strengthening its brand recognition in sustainable water solutions.
Strategic Collision: Similarities & Divergences
Both companies operate in industrial machinery but pursue distinct business models. Dover adopts a broad, multi-industry approach with a focus on clean energy tech, while A. O. Smith targets water-related products with a consumer-facing mix. Their primary battleground is innovation in sustainable infrastructure. Investors encounter contrasting profiles: Dover’s diversified industrial growth versus A. O. Smith’s niche specialization and consumer engagement.
Income Statement Comparison
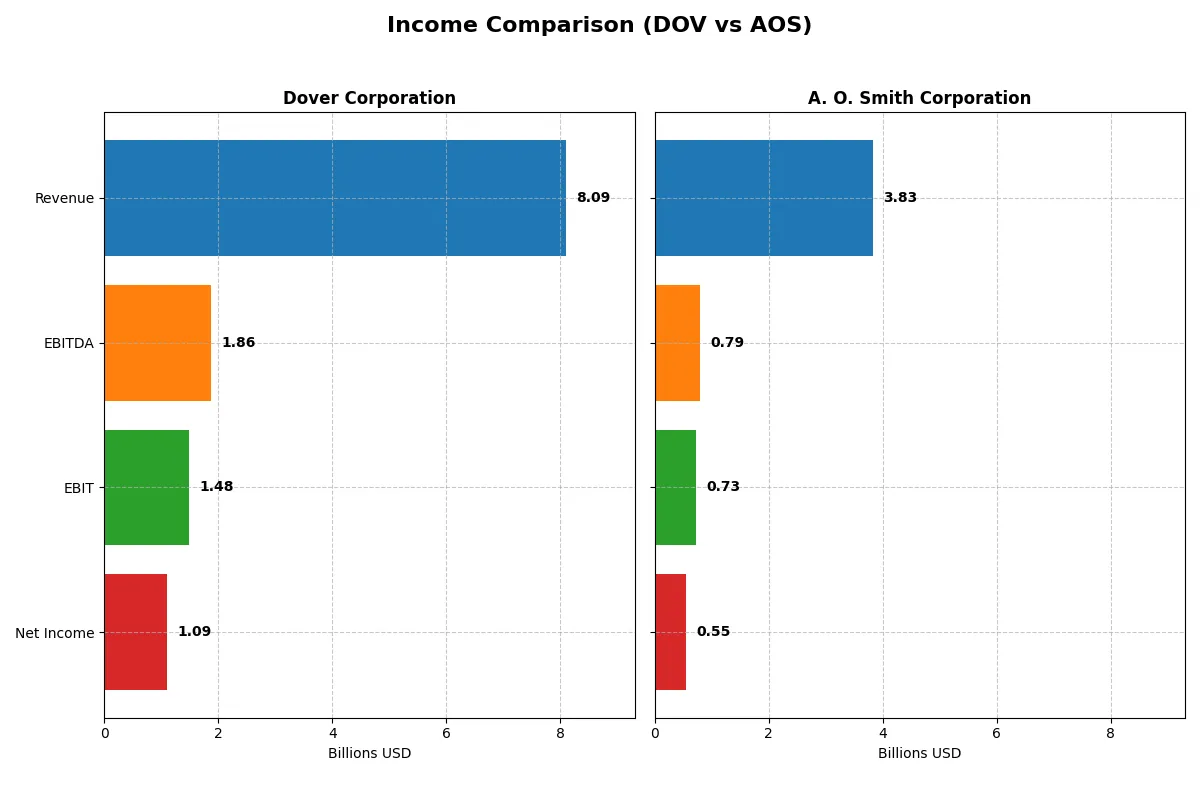
This data dissects the core profitability and scalability of both corporate engines to reveal who dominates the bottom line:
| Metric | Dover Corporation (DOV) | A. O. Smith Corporation (AOS) |
|---|---|---|
| Revenue | 8.09B | 3.83B |
| Cost of Revenue | 4.87B | 2.34B |
| Operating Expenses | 1.84B | 759M |
| Gross Profit | 3.22B | 1.49B |
| EBITDA | 1.86B | 792M |
| EBIT | 1.48B | 729M |
| Interest Expense | 110M | 13.5M |
| Net Income | 1.09B | 546M |
| EPS | 7.97 | 3.86 |
| Fiscal Year | 2025 | 2025 |
Income Statement Analysis: The Bottom-Line Duel
This income statement comparison reveals which company runs a more efficient and profitable business engine from 2021 to 2025.
Dover Corporation Analysis
Dover’s revenue rose modestly to 8.1B in 2025, yet net income slipped to 1.09B, reflecting margin pressures. Its gross margin stays healthy near 40%, but net margin dropped sharply to 13.5%. The latest year saw weakened EBIT and net income growth, signaling rising costs outpacing top-line gains.
A. O. Smith Corporation Analysis
A. O. Smith maintained steady revenues around 3.8B with net income at 546M in 2025, showing robust margin resilience. Gross margin held near 39%, while net margin improved to 14.3%. The company posted positive EPS growth and modest EBIT gains, reflecting disciplined cost control and improved profitability momentum.
Margin Sustainability vs. Growth Discipline
Dover offers higher absolute revenues and scale, but suffers recent margin erosion and declining net income. A. O. Smith delivers consistent margin expansion and steady EPS growth despite smaller revenues. For investors prioritizing sustained profitability and margin discipline, A. O. Smith’s profile appears more attractive.
Financial Ratios Comparison
These vital ratios act as a diagnostic tool to expose the underlying fiscal health, valuation premiums, and capital efficiency of the companies analyzed:
| Ratios | Dover Corporation (DOV) | A. O. Smith Corporation (AOS) |
|---|---|---|
| ROE | 14.77% | 29.40% |
| ROIC | 9.45% | 23.94% |
| P/E | 24.49 | 17.13 |
| P/B | 3.62 | 5.04 |
| Current Ratio | 1.79 | 1.50 |
| Quick Ratio | 1.28 | 0.94 |
| D/E | 0.45 | 0.10 |
| Debt-to-Assets | 24.79% | 6.11% |
| Interest Coverage | 12.51 | 53.93 |
| Asset Turnover | 0.60 | 1.22 |
| Fixed Asset Turnover | 7.23 | 5.62 |
| Payout Ratio | 25.87% | 35.83% |
| Dividend Yield | 1.06% | 2.09% |
| Fiscal Year | 2025 | 2025 |
Efficiency & Valuation Duel: The Vital Signs
Financial ratios act as the company’s DNA, revealing hidden risks and operational excellence that shape investment decisions.
Dover Corporation
Dover shows a solid net margin of 13.52% and a neutral ROE of 14.77%, indicating decent profitability. Its P/E ratio of 24.49 suggests a fairly valued stock, though a high P/B at 3.62 signals some premium on assets. Dover pays a modest 1.06% dividend, balancing shareholder returns with reinvestment.
A. O. Smith Corporation
A. O. Smith impresses with a strong ROE of 29.4% and a favorable net margin of 14.26%, reflecting efficient operations. The P/E of 17.13 points to a more attractive valuation relative to earnings. Its 2.09% dividend yield and low debt levels underline disciplined capital allocation and shareholder reward.
Premium Valuation vs. Operational Efficiency
A. O. Smith offers a better blend of profitability and valuation metrics, with higher returns and more favorable leverage. Dover’s stable but less aggressive profile suits investors prioritizing steady dividends and moderate risk. The choice depends on appetite for growth versus income stability.
Which one offers the Superior Shareholder Reward?
I compare Dover Corporation (DOV) and A. O. Smith Corporation (AOS) on dividends, payout ratios, and buybacks. DOV yields about 1.06% with a 26% payout ratio, supported by strong free cash flow coverage (2.66x). AOS offers a higher yield near 2.09%, but with a 36% payout ratio, slightly more aggressive. Both companies maintain buyback programs, yet DOV’s larger free cash flow per share ($8.14 vs. $3.90) suggests more sustainable capital return. AOS’s lower leverage (debt to assets 6% vs. DOV’s 25%) supports flexibility. I see DOV’s conservative distribution and robust cash flow as more reliable for long-term total return in 2026. Thus, Dover edges ahead as the superior shareholder reward.
Comparative Score Analysis: The Strategic Profile
The radar chart reveals the fundamental DNA and trade-offs of Dover Corporation and A. O. Smith Corporation, highlighting their core financial strengths and vulnerabilities:
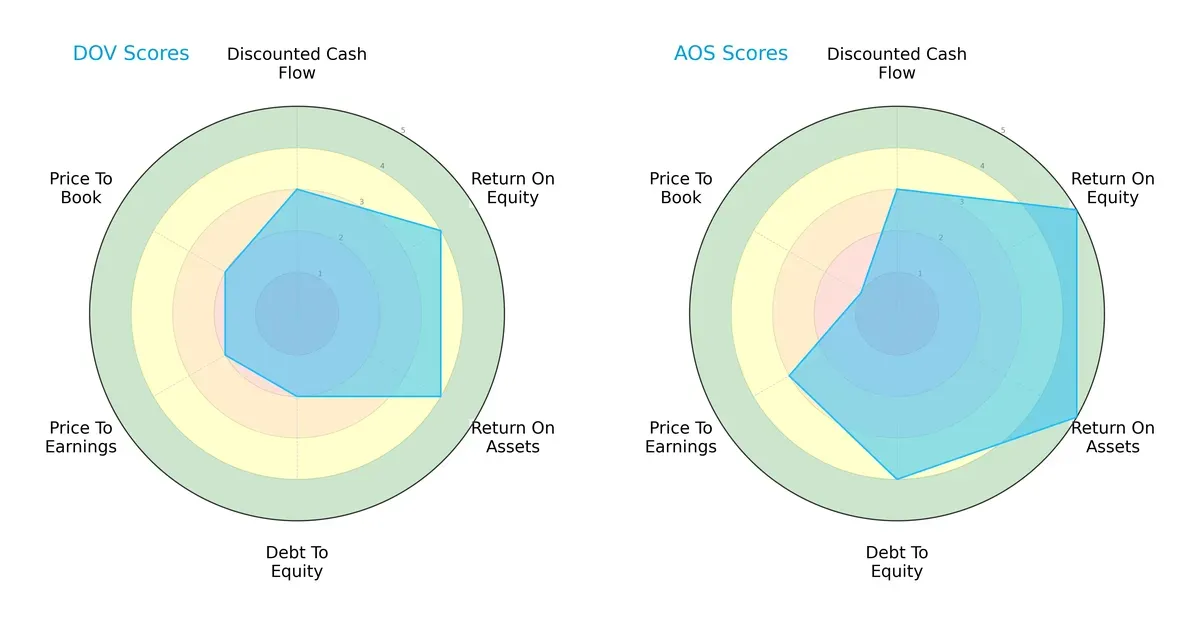
Dover shows solid profitability with ROE and ROA scores of 4 each but struggles on leverage and valuation, scoring 2 on debt-to-equity, P/E, and P/B. In contrast, A. O. Smith dominates profitability (ROE 5, ROA 5) and maintains a stronger balance sheet (debt-to-equity 4). However, it faces valuation challenges, particularly in price-to-book (score 1). A. O. Smith presents a more balanced financial profile, while Dover relies heavily on operational efficiency but carries higher balance sheet risk.
Bankruptcy Risk: Solvency Showdown
The Altman Z-Score gap illustrates A. O. Smith’s superior financial safety margin over Dover, signaling stronger long-term survival prospects in this market cycle:
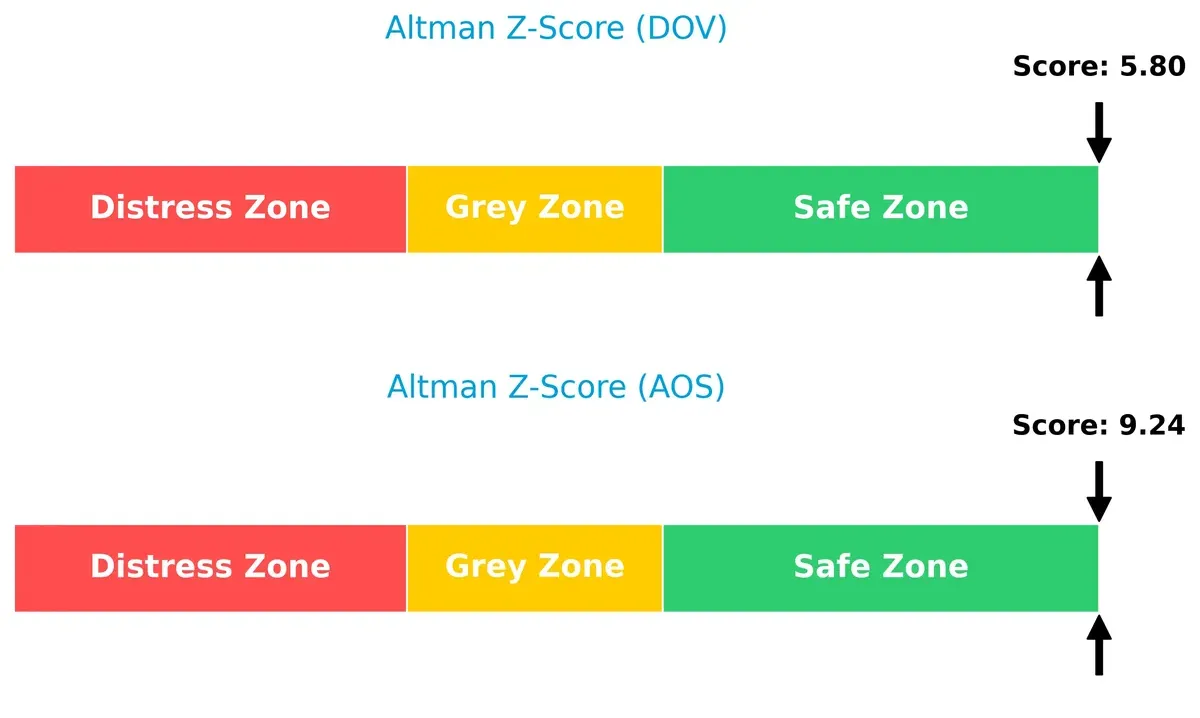
A. O. Smith scores 9.24, placing it well within the safe zone, while Dover’s 5.80, though safe, is notably lower. This suggests Dover is more vulnerable to economic shocks despite current stability.
Financial Health: Quality of Operations
Piotroski F-Scores confirm A. O. Smith’s operational robustness surpasses Dover’s, indicating stronger internal financial quality and fewer red flags:
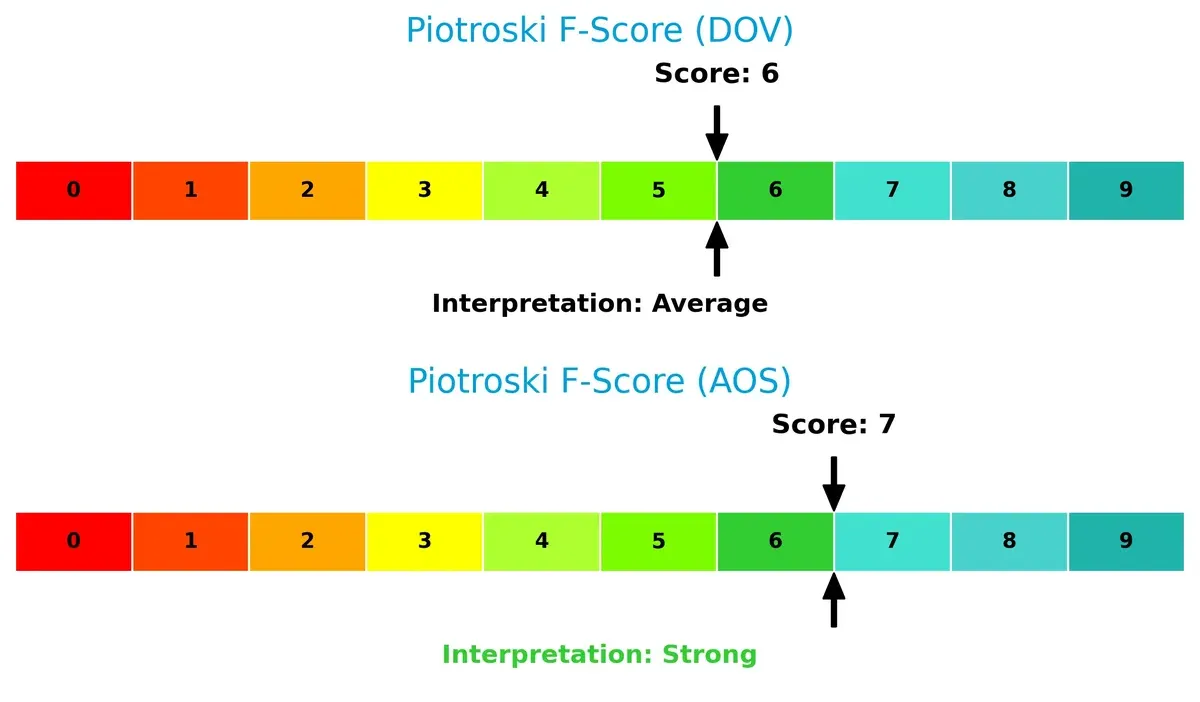
A. O. Smith’s score of 7 signals strong financial health, whereas Dover’s 6 is average, hinting at some operational areas needing attention. This difference underscores A. O. Smith’s superior quality in earnings, leverage, and liquidity management.
How are the two companies positioned?
This section dissects the operational DNA of Dover and A. O. Smith by comparing their revenue distribution by segment and internal strengths and weaknesses. The goal is to confront their economic moats and identify which offers the most resilient, sustainable competitive advantage today.
Revenue Segmentation: The Strategic Mix
This visual comparison dissects how Dover Corporation and A. O. Smith Corporation diversify their income streams and where their primary sector bets lie:
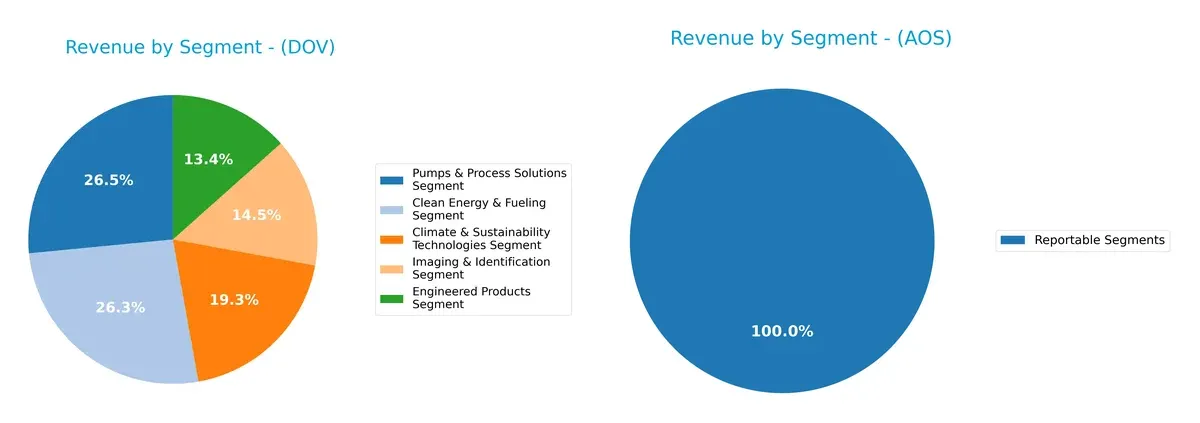
Dover Corporation demonstrates a well-diversified revenue base with five key segments ranging from $1.1B to $2.1B, anchoring its strategy across clean energy, climate tech, and pumps. In contrast, A. O. Smith relies solely on a single reported segment totaling $3.8B, signaling concentration risk but also focused expertise. Dover’s multi-segment approach reduces dependency and enhances ecosystem lock-in, while A. O. Smith pivots on infrastructure dominance within its niche.
Strengths and Weaknesses Comparison
This table compares the Strengths and Weaknesses of Dover Corporation and A. O. Smith Corporation:
Dover Corporation Strengths
- Diversified revenue across five segments totaling over 8B USD
- Favorable net margin at 13.52%
- Strong liquidity ratios with current ratio 1.79 and quick ratio 1.28
- Low debt-to-assets at 24.79% and solid interest coverage of 13.52
- Global presence with significant revenue from Americas, Asia, and Europe
A. O. Smith Corporation Strengths
- Favorable profitability metrics including net margin 14.26%, ROE 29.4%, and ROIC 23.94%
- Low debt-to-assets at 6.11% with very high interest coverage of 54.03
- Strong asset turnover at 1.22 and fixed asset turnover of 5.62
- Higher dividend yield at 2.09%
- Concentrated geographic presence focused on North America and Rest of World segments
Dover Corporation Weaknesses
- Price-to-book ratio elevated at 3.62, marked unfavorable
- Neutral ROE and ROIC close to WACC, limiting value creation signal
- Moderate asset turnover of 0.6 may indicate less efficient asset use
- Geographic revenue heavily weighted toward United States, limiting diversification
A. O. Smith Corporation Weaknesses
- Elevated price-to-book ratio at 5.04 signals possible overvaluation
- Quick ratio of 0.94 suggests less liquidity buffer compared to peers
- Geographic concentration in North America risks market dependency despite diversification in Rest of World
Both companies show solid profitability and manageable debt levels, but Dover benefits from broader segment diversification and global reach. A. O. Smith excels in capital efficiency and returns but faces risks from geographic concentration and valuation metrics. These factors shape each company’s strategic positioning in competitive markets.
The Moat Duel: Analyzing Competitive Defensibility
A structural moat protects long-term profits from competition’s relentless erosion. Without it, sustainable returns vanish quickly. Let’s examine the moat dynamics of two industrial machinery leaders:
Dover Corporation: Diversified Engineering & Aftermarket Integration
Dover’s moat hinges on a broad portfolio of engineered products and aftermarket services, creating switching costs and recurring revenue. Its financials show solid margins but declining ROIC signals weakening value creation. Expansion into clean energy may deepen its moat but requires careful execution in 2026.
A. O. Smith Corporation: Water Heating & Treatment Efficiency
A. O. Smith’s moat rests on strong brand loyalty and cost advantages in water heating technology. Unlike Dover, it consistently grows ROIC well above WACC, reflecting superior capital allocation and operational efficiency. Its global footprint and product innovation support expanding market disruption in 2026.
ROIC Resilience vs. Portfolio Breadth: The Moat Face-off
A. O. Smith possesses the deeper, more sustainable moat, driven by rising ROIC and efficient capital use. Dover’s broad product base offers scale but struggles to convert it into value. A. O. Smith stands better poised to defend and grow market share amid intensifying competition.
Which stock offers better returns?
The past year shows divergent dynamics: Dover Corporation’s stock surged with accelerating gains, while A. O. Smith Corporation faced an overall decline despite recent recovery signs.
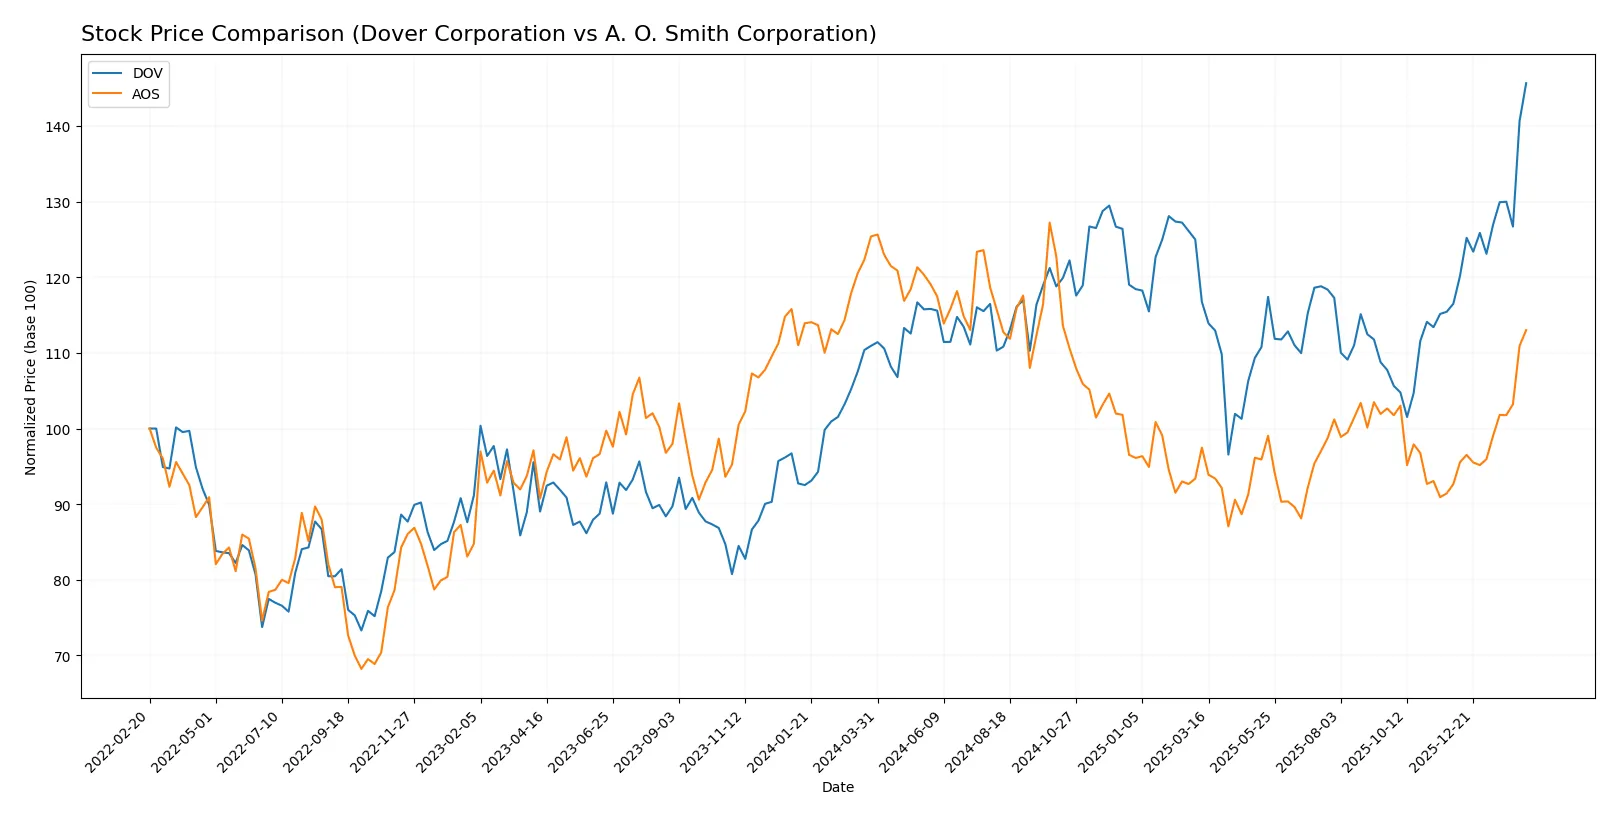
Trend Comparison
Dover Corporation’s stock rose 31.3% over the past 12 months, marking a bullish trend with accelerating momentum. It reached a high of 231.63 and a low of 153.55, showing significant volatility with a 12.76 standard deviation.
A. O. Smith Corporation’s stock declined 9.88% over the same period, confirming a bearish trend despite acceleration. The price ranged between 61.99 and 90.59, with lower volatility at a 7.71 standard deviation.
Comparing both, Dover Corporation delivered the highest market performance, outperforming A. O. Smith by a wide margin in overall returns and trend strength.
Target Prices
Analysts provide a clear target range for both Dover Corporation and A. O. Smith Corporation, reflecting moderate upside potential.
| Company | Target Low | Target High | Consensus |
|---|---|---|---|
| Dover Corporation | 195 | 256 | 223.7 |
| A. O. Smith Corporation | 69 | 85 | 76.2 |
The consensus target for Dover at 223.7 is slightly below its current price of 231.63, suggesting limited upside or potential overvaluation. A. O. Smith’s consensus target of 76.2 remains below its current price of 80.46, implying cautious analyst expectations despite recent strength.

Don’t Let Luck Decide Your Entry Point
Optimize your entry points with our advanced ProRealTime indicators. You’ll get efficient buy signals with precise price targets for maximum performance. Start outperforming now!
How do institutions grade them?
The following tables summarize recent institutional grades for Dover Corporation and A. O. Smith Corporation:
Dover Corporation Grades
Below are the latest grades assigned to Dover Corporation by various institutions.
| Grading Company | Action | New Grade | Date |
|---|---|---|---|
| JP Morgan | maintain | Overweight | 2026-01-30 |
| Wells Fargo | maintain | Equal Weight | 2026-01-30 |
| RBC Capital | maintain | Sector Perform | 2026-01-30 |
| Oppenheimer | maintain | Outperform | 2026-01-26 |
| JP Morgan | maintain | Overweight | 2026-01-16 |
| Barclays | maintain | Equal Weight | 2026-01-07 |
| Wells Fargo | maintain | Equal Weight | 2026-01-07 |
| UBS | upgrade | Buy | 2026-01-05 |
| Wells Fargo | maintain | Equal Weight | 2025-12-15 |
| Oppenheimer | maintain | Outperform | 2025-11-14 |
A. O. Smith Corporation Grades
This table lists recent grades issued for A. O. Smith Corporation by different firms.
| Grading Company | Action | New Grade | Date |
|---|---|---|---|
| DA Davidson | maintain | Neutral | 2026-02-02 |
| Stifel | maintain | Buy | 2026-01-30 |
| Citigroup | maintain | Neutral | 2026-01-30 |
| DA Davidson | maintain | Neutral | 2025-11-13 |
| Citigroup | maintain | Neutral | 2025-10-29 |
| Stifel | maintain | Buy | 2025-10-29 |
| UBS | maintain | Neutral | 2025-07-28 |
| Oppenheimer | maintain | Outperform | 2025-07-28 |
| Stifel | maintain | Buy | 2025-07-25 |
| Baird | maintain | Neutral | 2025-07-25 |
Which company has the best grades?
Dover Corporation holds more consistent “Overweight” and “Outperform” ratings, including a recent upgrade to “Buy.” In contrast, A. O. Smith’s grades lean toward “Neutral” with some “Buy” ratings. Investors may interpret Dover’s stronger consensus as higher institutional confidence.
Risks specific to each company
The following categories identify critical pressure points and systemic threats facing both firms in the 2026 market environment:
1. Market & Competition
Dover Corporation
- Faces diversified industrial machinery competition with pressure on innovation and pricing.
A. O. Smith Corporation
- Competes in residential and commercial water heating with strong brand presence but sensitive to construction cycles.
2. Capital Structure & Debt
Dover Corporation
- Maintains moderate leverage with debt-to-assets at 24.8%, manageable interest coverage of 13.5x.
A. O. Smith Corporation
- Exhibits low leverage, debt-to-assets at 6.1%, and very strong interest coverage of 54x, indicating financial strength.
3. Stock Volatility
Dover Corporation
- Beta of 1.29 suggests moderate sensitivity to market swings; stock trading near its 52-week high.
A. O. Smith Corporation
- Slightly higher beta at 1.34 indicates marginally higher volatility; also trading near all-time highs.
4. Regulatory & Legal
Dover Corporation
- Subject to industrial safety and environmental regulations impacting manufacturing and clean energy segments.
A. O. Smith Corporation
- Faces water quality and environmental regulations in multiple jurisdictions, increasing compliance costs.
5. Supply Chain & Operations
Dover Corporation
- Complex global supply chain with exposure to raw material price fluctuations and logistics constraints.
A. O. Smith Corporation
- Supply chain risks from reliance on international manufacturing and raw materials for water treatment products.
6. ESG & Climate Transition
Dover Corporation
- Invests in clean energy technologies but faces transition risks in industrial automation and fuel segments.
A. O. Smith Corporation
- Strong push in energy-efficient water heating, but must address water scarcity and sustainability concerns.
7. Geopolitical Exposure
Dover Corporation
- Exposure to US and global industrial markets; vulnerable to trade tensions and tariffs.
A. O. Smith Corporation
- Significant sales in China and India increase geopolitical risk from regulatory shifts and trade policies.
Which company shows a better risk-adjusted profile?
A. O. Smith’s low leverage and strong profitability reduce financial risk significantly. Dover’s higher debt and industrial exposure raise caution. Dover’s supply chain complexity contrasts with A. O. Smith’s geopolitical risks from emerging markets. Overall, A. O. Smith presents a cleaner risk-adjusted profile with a strong Altman Z-Score of 9.24 versus Dover’s 5.80. The most impactful risk for Dover is its capital structure amid industrial cyclicality. For A. O. Smith, geopolitical exposure in growth markets demands vigilance as trade tensions persist in 2026.
Final Verdict: Which stock to choose?
Dover Corporation’s superpower lies in its resilient cash flow generation and solid operational efficiency, which can fuel steady value creation. However, its declining return on invested capital signals a point of vigilance. It fits portfolios targeting stable income with moderate growth prospects.
A. O. Smith Corporation benefits from a robust strategic moat, demonstrated by its strong and growing ROIC well above its cost of capital. Its lower leverage and higher profitability offer better financial safety compared to Dover. This makes it suitable for investors favoring growth at a reasonable price.
If you prioritize a stable cash machine with consistent operational performance, Dover Corporation is the compelling choice due to its strong cash conversion cycle and favorable liquidity. However, if you seek superior long-term value creation with a sustainable competitive advantage, A. O. Smith offers better stability and growth potential despite a higher valuation premium.
Disclaimer: Investment carries a risk of loss of initial capital. The past performance is not a reliable indicator of future results. Be sure to understand risks before making an investment decision.
Go Further
I encourage you to read the complete analyses of Dover Corporation and A. O. Smith Corporation to enhance your investment decisions: