Home > Comparison > Industrials > CMI vs AOS
The strategic rivalry between Cummins Inc. and A. O. Smith Corporation shapes the Industrials sector’s machinery landscape. Cummins operates as a diversified industrial powerhouse focused on engines and power systems. In contrast, A. O. Smith specializes in water heating and treatment solutions with a consumer-centric model. This analysis probes which company’s operational strategy offers superior risk-adjusted returns amid evolving industrial demands for any diversified portfolio.
Table of contents
Companies Overview
Cummins Inc. and A. O. Smith Corporation are pivotal players in industrial machinery, shaping power and water solutions globally.
Cummins Inc.: Powerhouse of Engine Innovation
Cummins Inc. dominates as a global designer and manufacturer of diesel and natural gas engines. Its revenue stems from five segments including Engine, Power Systems, and New Power, serving heavy-duty trucks, construction, and energy sectors. In 2026, Cummins deepened its focus on electrified powertrains and hydrogen technologies, reflecting a strategic pivot to cleaner energy solutions.
A. O. Smith Corporation: Leader in Water Heating and Treatment
A. O. Smith Corporation commands the market for residential and commercial water heaters and treatment products. It generates revenue through North American and international segments, offering boilers, softeners, and filters under multiple brands. The company’s 2026 strategy emphasizes expanding e-commerce channels and innovation in water filtration to capture diverse end markets.
Strategic Collision: Similarities & Divergences
Both companies operate in industrial machinery but diverge sharply in focus: Cummins invests heavily in powertrain electrification, while A. O. Smith pursues water heating and treatment innovation. Their primary battleground is the industrial equipment space, with Cummins targeting transportation and energy, A. O. Smith focusing on building infrastructure. This contrast defines distinct investment profiles—Cummins as a tech-driven engine innovator, A. O. Smith as a steady water solutions provider.
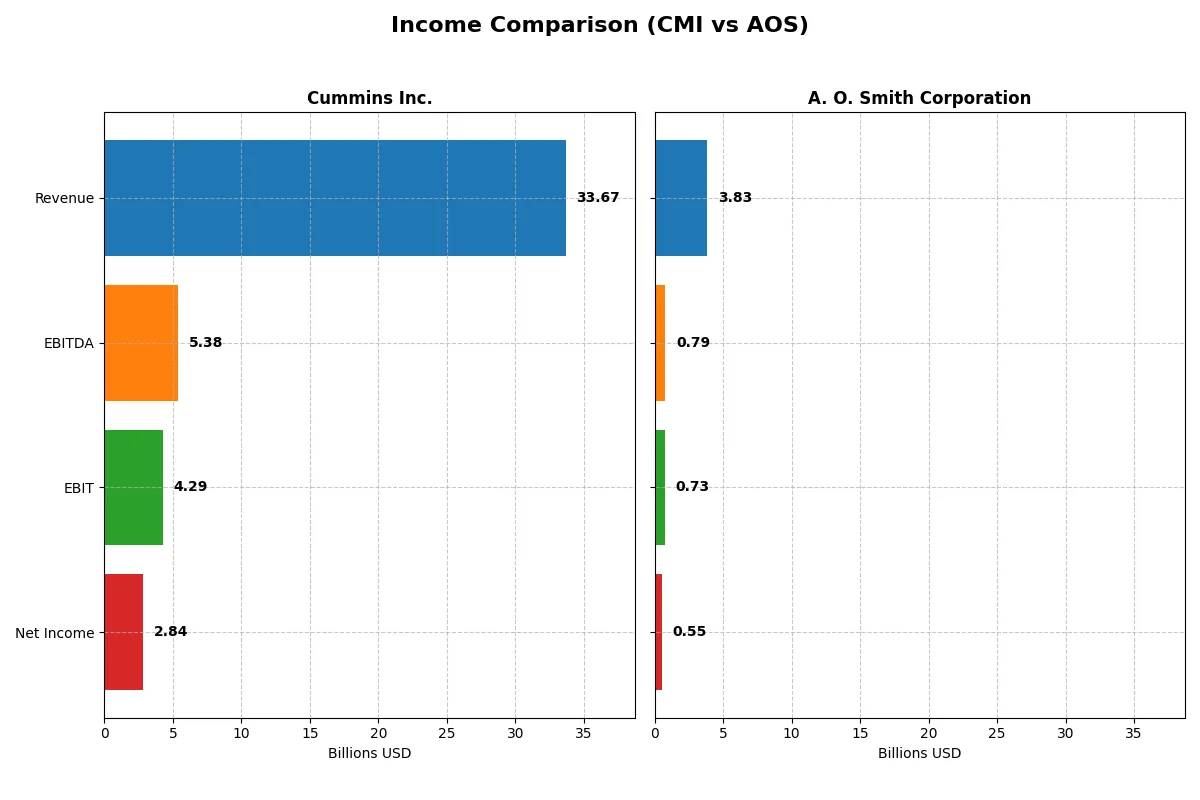
Income Statement Comparison
This data dissects the core profitability and scalability of both corporate engines to reveal who dominates the bottom line:
| Metric | Cummins Inc. (CMI) | A. O. Smith Corporation (AOS) |
|---|---|---|
| Revenue | 33.7B | 3.83B |
| Cost of Revenue | 25.2B | 2.34B |
| Operating Expenses | 4.52B | 759M |
| Gross Profit | 8.52B | 1.49B |
| EBITDA | 5.39B | 792M |
| EBIT | 4.29B | 729M |
| Interest Expense | 329M | 13.5M |
| Net Income | 2.84B | 546M |
| EPS | 20.62 | 3.86 |
| Fiscal Year | 2025 | 2025 |
Income Statement Analysis: The Bottom-Line Duel
The income statement comparison reveals which company runs a more efficient and profitable corporate engine in 2025.
Cummins Inc. Analysis
Cummins’s revenue grew 40% from 2021 to 2025, reaching $33.7B in 2025, but dipped 1.3% from 2024. Net income rose 33%, hitting $2.84B despite a 27% one-year decline. Gross and net margins remain healthy at 25.3% and 8.4%. However, recent margin compression signals efficiency challenges amid solid scale.
A. O. Smith Corporation Analysis
A. O. Smith’s revenue expanded 8.2% over five years, reaching $3.83B in 2025 with a slight 0.3% increase from 2024. Net income climbed 12% overall to $546M, showing steady margin improvement. Gross margin is strong at 38.8%, with net margin at 14.3%, reflecting efficient cost control and consistent earnings momentum.
Margin Strength vs. Scale Advantage
Cummins dominates in scale and absolute profit, but A. O. Smith leads in margin efficiency and steadier growth. Cummins’s recent margin declines contrast with A. O. Smith’s stable improvement. For investors, A. O. Smith’s leaner cost structure offers attractive profitability, while Cummins’s size delivers volume-driven earnings power.
Financial Ratios Comparison
These vital ratios act as a diagnostic tool to expose the underlying fiscal health, valuation premiums, and capital efficiency of these companies:
| Ratios | Cummins Inc. (CMI) | A. O. Smith Corporation (AOS) |
|---|---|---|
| ROE | 23.0% | 29.4% |
| ROIC | 12.0% | 23.9% |
| P/E | 24.8 | 17.1 |
| P/B | 5.7 | 5.0 |
| Current Ratio | 1.76 | 1.50 |
| Quick Ratio | 1.16 | 0.94 |
| D/E | 0.59 | 0.10 |
| Debt-to-Assets | 21.3% | 6.1% |
| Interest Coverage | 12.1 | 53.9 |
| Asset Turnover | 0.99 | 1.22 |
| Fixed Asset Turnover | 4.84 | 5.62 |
| Payout ratio | 37.1% | 35.8% |
| Dividend yield | 1.50% | 2.09% |
| Fiscal Year | 2025 | 2025 |
Efficiency & Valuation Duel: The Vital Signs
Financial ratios serve as a company’s DNA, unveiling hidden risks and operational strengths that raw figures alone cannot expose.
Cummins Inc.
Cummins posts a solid 23.02% ROE and a 12.01% ROIC, signaling efficient capital use. Its P/E of 24.76 suggests a fairly valued stock, though a high P/B of 5.7 appears stretched. The company delivers a modest 1.5% dividend yield, balancing shareholder returns with ongoing investment in R&D at 4.15% of revenue.
A. O. Smith Corporation
A. O. Smith shines with a robust 29.4% ROE and an impressive 23.94% ROIC, indicating superior profitability and capital efficiency. The P/E ratio at 17.13 reflects reasonable valuation. It rewards shareholders with a 2.09% dividend yield, supported by strong free cash flow, while maintaining conservative leverage and stable reinvestment.
Balanced Profitability vs. Attractive Yield
A. O. Smith offers higher profitability and a stronger dividend yield while maintaining solid valuation metrics. Cummins delivers respectable returns but carries a stretched price-to-book ratio. Investors prioritizing income and capital efficiency may favor A. O. Smith, while those valuing steady R&D-driven growth might lean toward Cummins.
Which one offers the Superior Shareholder Reward?
I compare Cummins Inc. (CMI) and A. O. Smith Corporation (AOS) on dividend yield, payout ratios, and buybacks. CMI yields about 1.5–2.7% with a payout ratio near 37%, supported by strong FCF coverage (around 65–70%). It aggressively repurchases shares, boosting total return sustainably. AOS offers a 1.2–2.1% yield with payout near 35%, also backed by robust FCF conversion (~80–90%), but its buyback intensity is moderate. CMI’s higher leverage and capital deployment in buybacks create a more attractive, sustainable shareholder reward in 2026.
Comparative Score Analysis: The Strategic Profile
The radar chart reveals the fundamental DNA and trade-offs of Cummins Inc. and A. O. Smith Corporation, highlighting their financial strengths and valuation nuances:
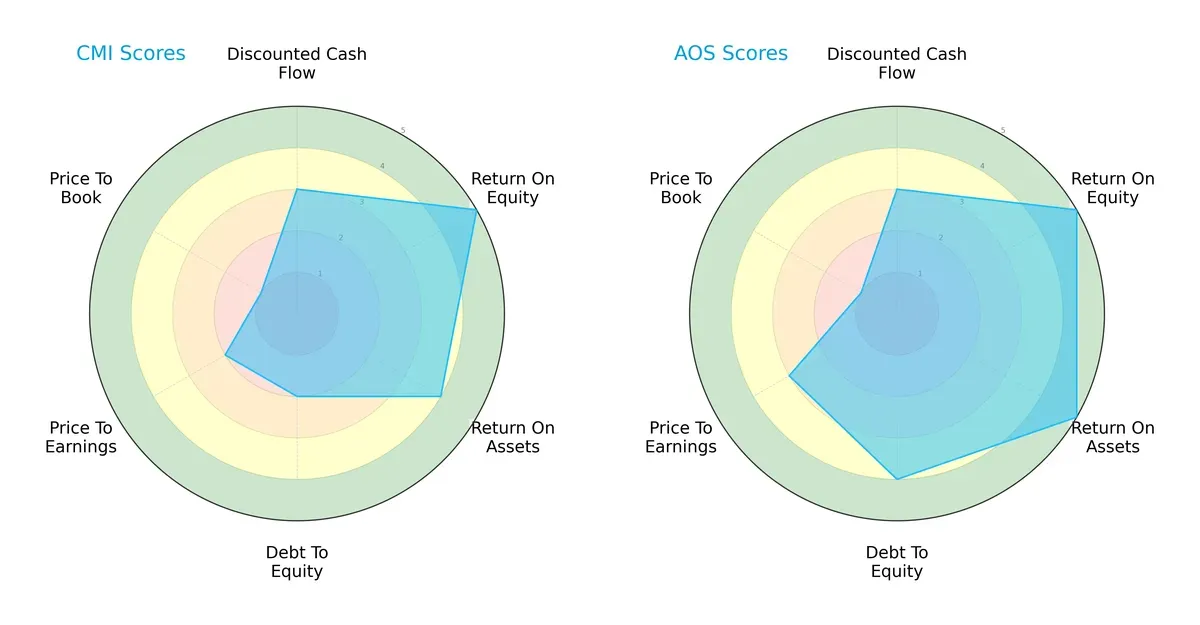
Cummins Inc. shows strength in ROE (5) and ROA (4) but struggles with debt (2) and valuation metrics (P/E 2, P/B 1). A. O. Smith balances high ROE (5), superior ROA (5), and healthier debt (4) with moderate valuation scores. AOS offers a more balanced profile, while CMI leans on operational efficiency but faces leverage and valuation challenges.
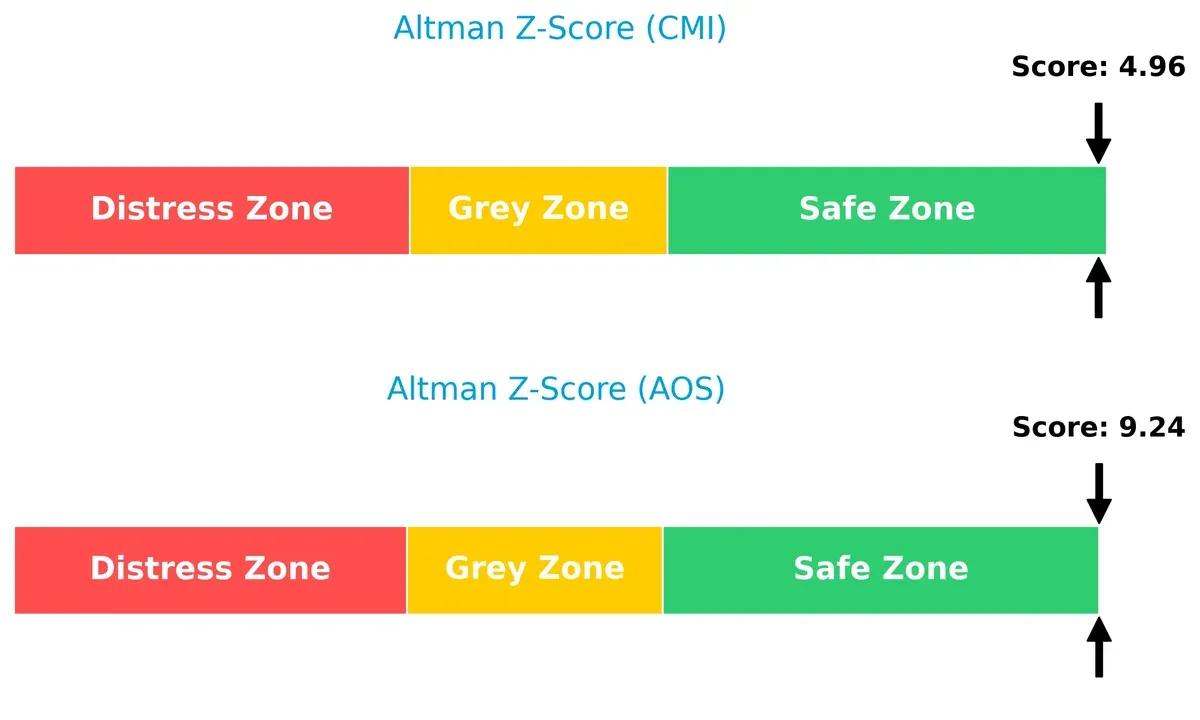
Bankruptcy Risk: Solvency Showdown
The Altman Z-Score difference is stark: AOS’s 9.24 versus CMI’s 4.96 implies both are safe, but AOS has a stronger margin for long-term survival in volatile markets:
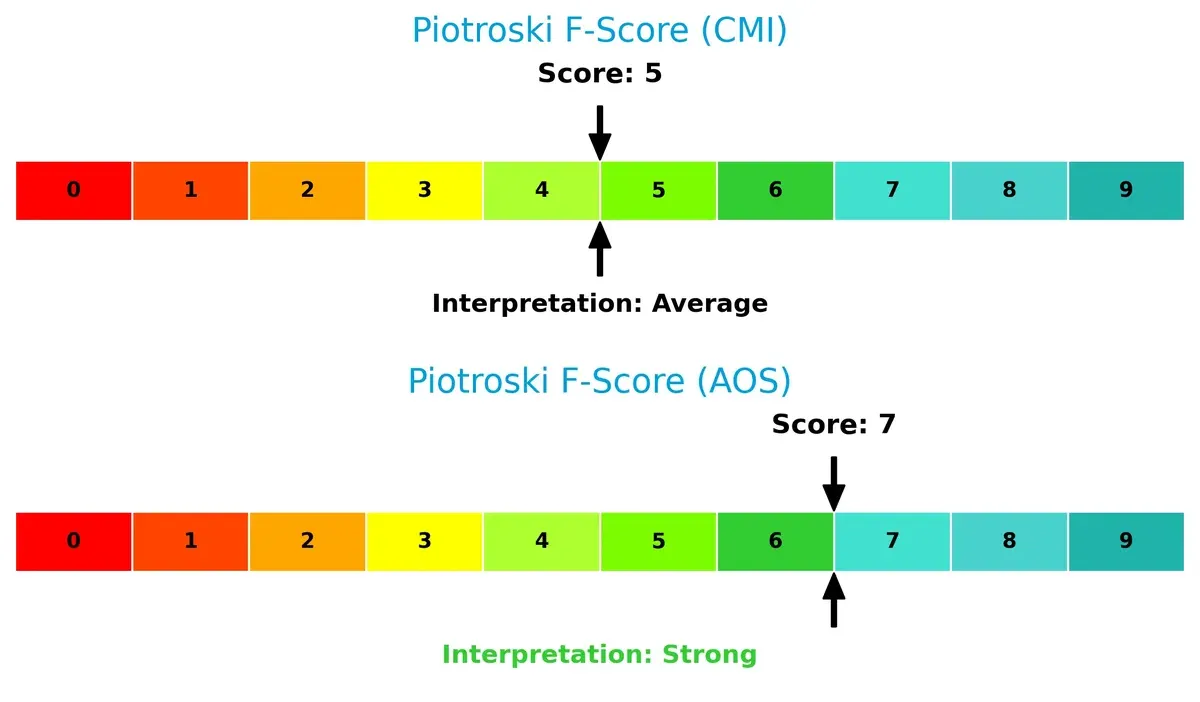
Financial Health: Quality of Operations
AOS leads with a Piotroski score of 7, indicating strong financial health, while CMI’s 5 suggests average stability, with potential red flags in internal metrics:
How are the two companies positioned?
This section dissects the operational DNA of Cummins and A. O. Smith by comparing their revenue distribution and internal strengths and weaknesses. The goal is to confront their economic moats to identify which model offers the most resilient, sustainable advantage today.
Revenue Segmentation: The Strategic Mix
This visual comparison dissects how Cummins Inc. and A. O. Smith Corporation diversify their income streams and where their primary sector bets lie:
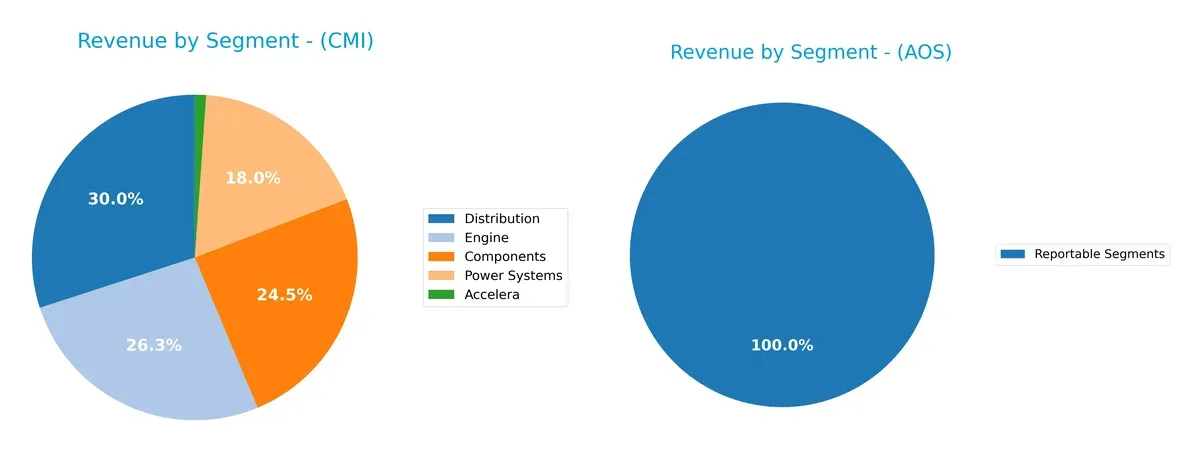
Cummins Inc. displays a robust, diversified mix anchored by Components ($10.1B), Distribution ($12.4B), and Engine ($10.9B) segments. This balance reduces concentration risk and supports ecosystem lock-in through multiple industrial channels. In contrast, A. O. Smith reveals only a single aggregated segment ($3.8B), limiting insight into diversification and suggesting reliance on a narrower revenue base. Cummins’ multi-segment strength signals superior strategic flexibility and infrastructure dominance.
Strengths and Weaknesses Comparison
This table compares the Strengths and Weaknesses of Cummins Inc. and A. O. Smith Corporation:
Cummins Inc. Strengths
- Diversified segments including Engine, Components, Distribution, Power Systems
- Favorable ROE (23%) and ROIC (12%) indicating efficient capital use
- Strong liquidity ratios (current 1.76, quick 1.16)
- Significant US and Non-US geographic presence with nearly 28B revenue
- Favorable interest coverage (13x) and debt-to-assets (21%)
A. O. Smith Corporation Strengths
- Higher profitability with net margin 14% and ROE 29%
- Superior ROIC (24%) well above WACC (10%)
- Strong global ratios overall, favorable debt-to-assets (6%)
- Higher dividend yield (2.1%) and interest coverage (54x)
- Solid asset turnover (1.22) and fixed asset turnover (5.62)
Cummins Inc. Weaknesses
- Unfavorable price-to-book ratio (5.7) indicating potential overvaluation
- Neutral net margin (8.4%) below AOS
- Moderate debt-to-equity ratio (0.59) could limit financial flexibility
- Neutral PE of 24.7 higher than AOS
- Asset turnover under 1 limits revenue generation from assets
A. O. Smith Corporation Weaknesses
- Unfavorable price-to-book ratio (5.0) similar to CMI
- Neutral liquidity ratios (current 1.5, quick 0.94) weaker than CMI
- Slightly higher WACC (9.9%) than CMI
- Less diversified revenue concentrated in fewer segments and smaller geographic scale
Both companies show financial strength with favorable returns on invested capital and manageable debt levels. Cummins excels in diversification and liquidity, while A. O. Smith demonstrates stronger profitability and operational efficiency. Each must address valuation concerns and leverage their unique market positions in strategy execution.
The Moat Duel: Analyzing Competitive Defensibility
A durable structural moat protects long-term profits from relentless competitive pressures. Here’s how Cummins Inc. and A. O. Smith Corporation defend their turf:
Cummins Inc.: Engineering Power with Intangible Assets
Cummins leverages proprietary engine technology and a global service network, reflected in steady ROIC above WACC but declining. Emerging electrification markets pose both opportunity and risk in 2026.
A. O. Smith Corporation: Water Heater Efficiency and Scale
A. O. Smith’s cost advantage and brand reputation drive a widening ROIC gap over WACC with positive momentum. Expansion in water treatment and global markets supports stronger moat growth than Cummins.
Verdict: Technological Edge vs. Operational Excellence
A. O. Smith’s growing ROIC and cost leadership signal a deeper, more sustainable moat than Cummins’ eroding profitability. A. O. Smith appears better equipped to defend and expand its market share.
Which stock offers better returns?
The past year shows stark contrasts: Cummins Inc. surged over 100%, while A. O. Smith Corporation declined nearly 10%, reflecting divergent trading momentum and investor confidence.
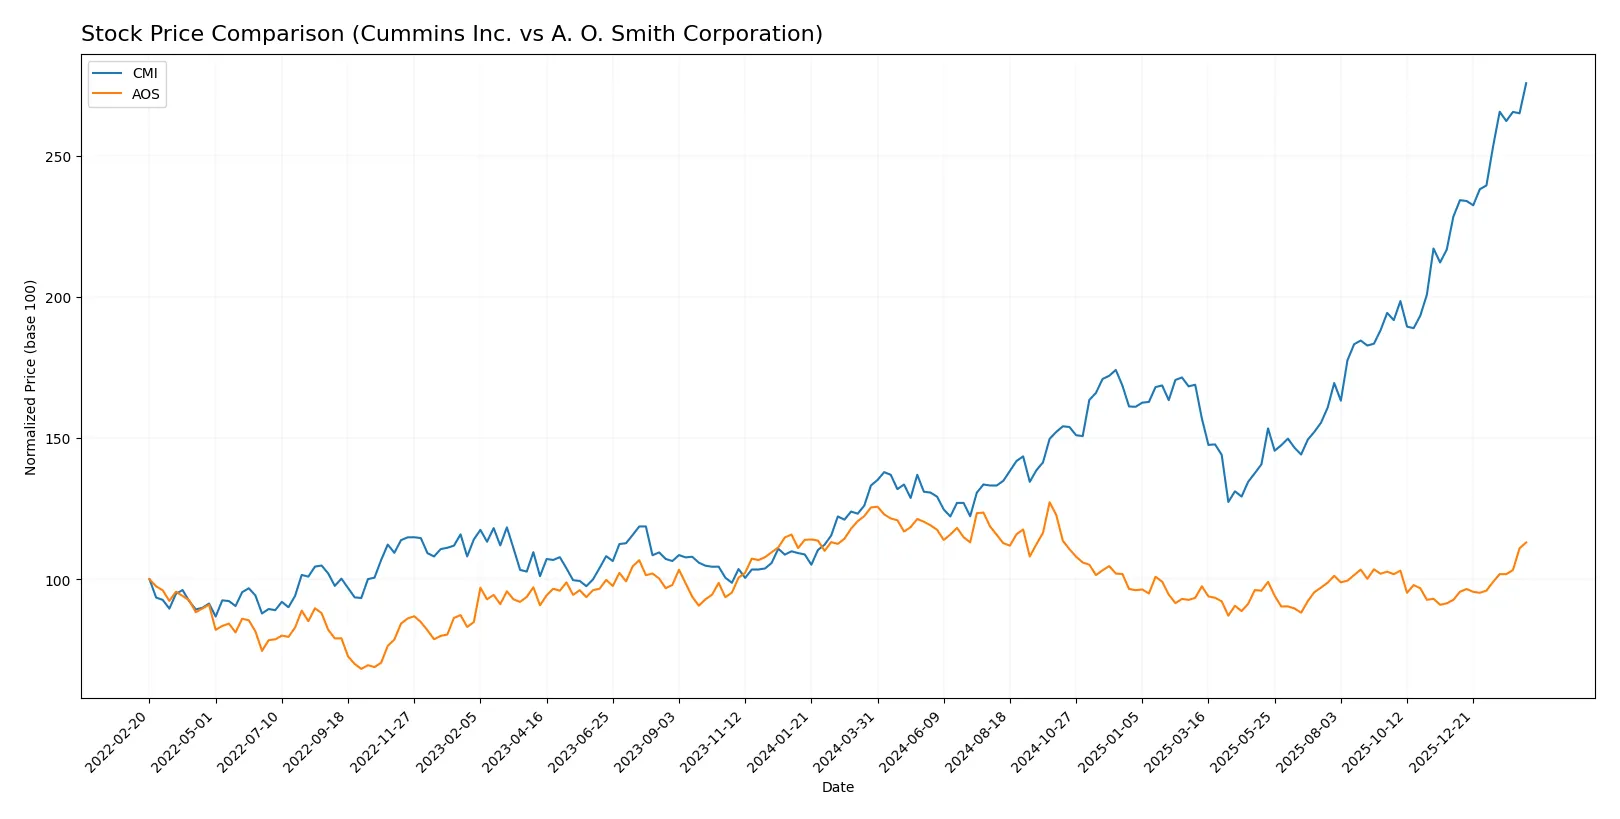
Trend Comparison
Cummins Inc. shows a strong bullish trend with a 107% price gain over 12 months. The stock exhibits accelerating growth, a high volatility of 82.55, and a peak price of 601.01.
A. O. Smith Corporation experiences a bearish trend, dropping 9.88% over the same period. Despite accelerating decline, its volatility remains low at 7.71, with a highest price near 90.59.
Cummins outperforms A. O. Smith by a wide margin, delivering significantly higher returns and greater price momentum over the past year.
Target Prices
Analysts show a moderately bullish consensus for Cummins Inc. and A. O. Smith Corporation, reflecting confidence in their industrial machinery segments.
| Company | Target Low | Target High | Consensus |
|---|---|---|---|
| Cummins Inc. | 540 | 703 | 618.4 |
| A. O. Smith Corporation | 69 | 85 | 76.2 |
The target consensus for Cummins is slightly above its current price of 601, suggesting upside potential. A. O. Smith’s consensus target also exceeds its current price of 80.46, indicating moderate growth expectations.

Don’t Let Luck Decide Your Entry Point
Optimize your entry points with our advanced ProRealTime indicators. You’ll get efficient buy signals with precise price targets for maximum performance. Start outperforming now!
How do institutions grade them?
The following tables summarize recent institutional grades for Cummins Inc. and A. O. Smith Corporation:
Cummins Inc. Grades
The table below shows the latest grades and rating actions from key analysts for Cummins Inc.
| Grading Company | Action | New Grade | Date |
|---|---|---|---|
| Raymond James | Maintain | Outperform | 2026-02-09 |
| Truist Securities | Maintain | Buy | 2026-02-06 |
| Wolfe Research | Downgrade | Peer Perform | 2026-01-26 |
| Barclays | Maintain | Overweight | 2026-01-23 |
| Wells Fargo | Maintain | Overweight | 2026-01-23 |
| JP Morgan | Maintain | Neutral | 2026-01-14 |
| Citigroup | Maintain | Buy | 2026-01-13 |
| Raymond James | Upgrade | Outperform | 2025-12-22 |
| Barclays | Upgrade | Overweight | 2025-12-19 |
| Truist Securities | Maintain | Buy | 2025-12-18 |
A. O. Smith Corporation Grades
Below is a summary of recent analyst grades and recommendations for A. O. Smith Corporation.
| Grading Company | Action | New Grade | Date |
|---|---|---|---|
| DA Davidson | Maintain | Neutral | 2026-02-02 |
| Stifel | Maintain | Buy | 2026-01-30 |
| Citigroup | Maintain | Neutral | 2026-01-30 |
| DA Davidson | Maintain | Neutral | 2025-11-13 |
| Citigroup | Maintain | Neutral | 2025-10-29 |
| Stifel | Maintain | Buy | 2025-10-29 |
| UBS | Maintain | Neutral | 2025-07-28 |
| Oppenheimer | Maintain | Outperform | 2025-07-28 |
| Stifel | Maintain | Buy | 2025-07-25 |
| Baird | Maintain | Neutral | 2025-07-25 |
Which company has the best grades?
Cummins Inc. generally receives stronger grades, with multiple Outperform and Buy ratings. A. O. Smith mostly holds Neutral and Buy ratings. Superior grades for Cummins could signal higher analyst confidence, influencing investor perception.
Risks specific to each company
The following categories identify critical pressure points and systemic threats facing Cummins Inc. and A. O. Smith Corporation in the 2026 market environment:
1. Market & Competition
Cummins Inc.
- Faces intense competition in heavy-duty engine and power system markets with increasing electrification demands.
A. O. Smith Corporation
- Operates in residential and commercial water heaters with rising competition from energy-efficient and smart home solutions.
2. Capital Structure & Debt
Cummins Inc.
- Moderate leverage with debt-to-equity of 0.59; interest coverage strong at 13.05 but debt levels require monitoring.
A. O. Smith Corporation
- Low leverage with debt-to-equity of 0.1 and excellent interest coverage at 54.03, signaling robust financial stability.
3. Stock Volatility
Cummins Inc.
- Beta at 1.12 indicates slightly higher market sensitivity and moderate price swings.
A. O. Smith Corporation
- Beta at 1.34 suggests higher volatility and greater sensitivity to market fluctuations.
4. Regulatory & Legal
Cummins Inc.
- Exposure to stringent emissions regulations globally, especially for diesel engines, poses compliance costs and risks.
A. O. Smith Corporation
- Subject to water quality standards and energy efficiency regulations, with evolving rules in multiple jurisdictions.
5. Supply Chain & Operations
Cummins Inc.
- Complex global supply chain for components and raw materials vulnerable to disruptions and rising costs.
A. O. Smith Corporation
- Reliance on international manufacturing and distribution channels could be affected by trade tensions and supply delays.
6. ESG & Climate Transition
Cummins Inc.
- Transitioning to electrified powertrains and hydrogen tech; faces pressure to reduce carbon footprint rapidly.
A. O. Smith Corporation
- Focused on energy-efficient water heaters and sustainability; must innovate to meet stricter climate targets.
7. Geopolitical Exposure
Cummins Inc.
- Significant exposure to global markets including emerging economies, vulnerable to geopolitical tensions and tariffs.
A. O. Smith Corporation
- Operations concentrated in North America and Asia; geopolitical risks mainly from trade policies impacting supply chains.
Which company shows a better risk-adjusted profile?
A. O. Smith Corporation shows a better risk-adjusted profile. Cummins faces greater risks from regulatory pressures and higher leverage. A. O. Smith’s low debt and superior interest coverage underpin financial resilience. Its higher Piotroski score reflects stronger operational efficiency. However, A. O. Smith’s higher stock volatility warrants caution. Recent data confirm Cummins’ regulatory compliance costs as a key concern, emphasizing the need to monitor its capital structure closely.
Final Verdict: Which stock to choose?
Cummins Inc. excels as a cash-generating industrial powerhouse with a solid capital return track record. Its superpower lies in operational efficiency and value creation despite a slightly declining ROIC trend. A point of vigilance is its weaker recent earnings momentum. It suits an Aggressive Growth portfolio targeting industrial innovation.
A. O. Smith Corporation boasts a robust moat with growing ROIC and superior profitability metrics. Its strategic edge is built on stable recurring revenue and a conservative balance sheet, offering better financial safety than Cummins. This stability and margin strength fit well within a GARP (Growth at a Reasonable Price) portfolio.
If you prioritize operational efficiency and industrial growth, Cummins offers a compelling scenario due to its strong cash flow and value creation despite cyclical headwinds. However, if you seek growing profitability combined with financial stability, A. O. Smith outshines as the safer, more consistent performer commanding a premium for its defensive qualities.
Disclaimer: Investment carries a risk of loss of initial capital. The past performance is not a reliable indicator of future results. Be sure to understand risks before making an investment decision.
Go Further
I encourage you to read the complete analyses of Cummins Inc. and A. O. Smith Corporation to enhance your investment decisions: