Home > Comparison > Industrials > AOS vs ATS
The strategic rivalry between A. O. Smith Corporation and ATS Corporation shapes the trajectory of the industrial machinery sector. A. O. Smith, a capital-intensive manufacturer of water heaters and boilers, contrasts with ATS, a high-tech provider of automated manufacturing systems and digital solutions. This analysis pits traditional industrial manufacturing against advanced automation services, aiming to reveal which business model offers a superior risk-adjusted return for a diversified portfolio in today’s evolving industrial landscape.
Table of contents
Companies Overview
A. O. Smith Corporation and ATS Corporation stand as key players in the industrial machinery sector, each commanding unique market niches.
A. O. Smith Corporation: Global Water Heating Leader
A. O. Smith Corporation dominates as a manufacturer of residential and commercial water heating solutions. It generates revenue through diverse product lines including gas, electric, and solar water heaters, boilers, and water treatment systems. In 2026, its strategic focus emphasized expanding global presence across North America, China, Europe, and India while innovating energy-efficient water heating technologies.
ATS Corporation: Automation Innovator
ATS Corporation specializes in delivering automation solutions and services worldwide. Revenue stems from designing, building, and servicing automated manufacturing and assembly systems across multiple industries. Their 2026 strategy centers on integrating digital solutions like connected factory floor management to enhance operational efficiency and minimize downtime for clients globally.
Strategic Collision: Similarities & Divergences
Both companies thrive in industrial machinery but diverge sharply: A. O. Smith focuses on tangible equipment for water and heating markets, while ATS champions software-driven automation systems. Their competition unfolds around industrial process optimization, with A. O. Smith’s physical product expertise contrasting ATS’s digital integration approach. Investors face distinct profiles—A. O. Smith offers stable global manufacturing exposure, whereas ATS delivers growth potential through advanced automation technologies.
Income Statement Comparison
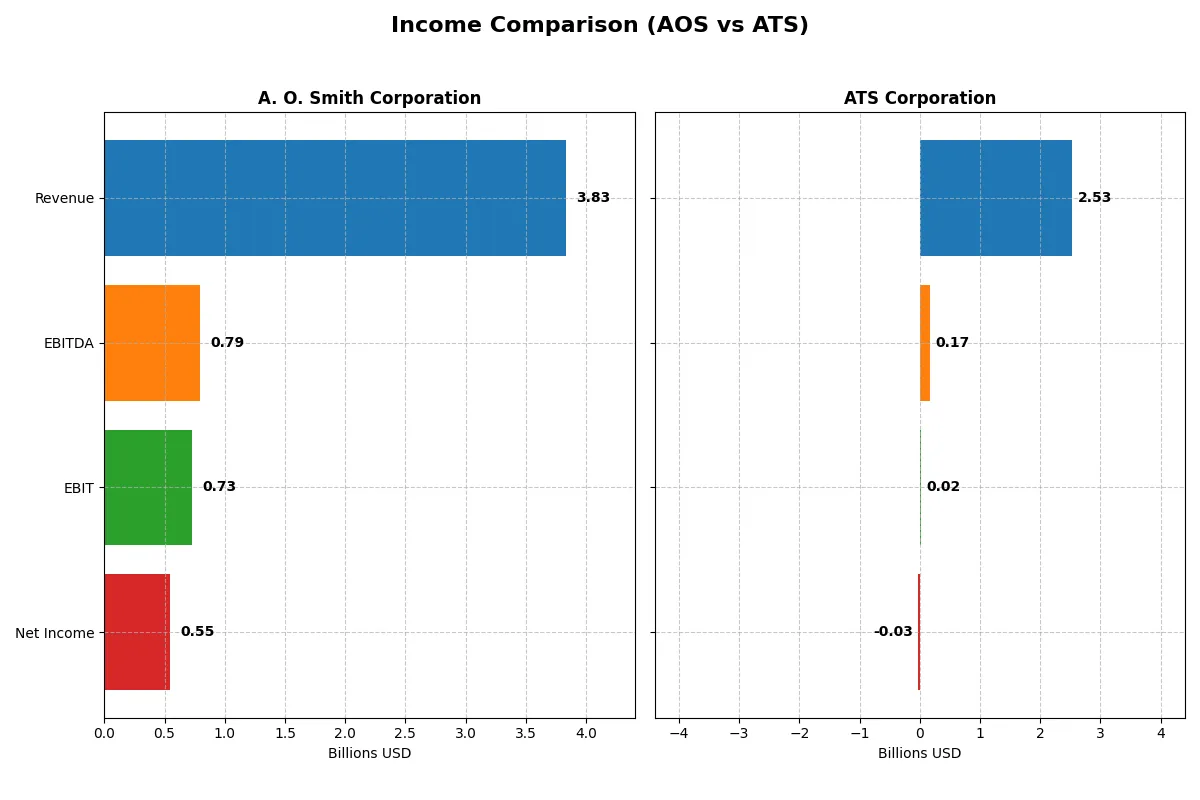
This data dissects the core profitability and scalability of both corporate engines to reveal who dominates the bottom line:
| Metric | A. O. Smith Corporation (AOS) | ATS Corporation (ATS) |
|---|---|---|
| Revenue | 3.83B | 2.53B |
| Cost of Revenue | 2.34B | 1.89B |
| Operating Expenses | 759M | 637M |
| Gross Profit | 1.49B | 647M |
| EBITDA | 792M | 168M |
| EBIT | 729M | 15M |
| Interest Expense | 13.5M | 98.2M |
| Net Income | 546M | -28M |
| EPS | 3.86 | -0.29 |
| Fiscal Year | 2025 | 2025 |
Income Statement Analysis: The Bottom-Line Duel
This income statement comparison exposes each company’s core efficiency and profitability in a competitive landscape.
A. O. Smith Corporation Analysis
AOS sustains steady revenue near $3.83B in 2025, with net income growing to $546M. Its gross margin holds strong at 38.8%, while net margin remains healthy at 14.3%. Despite marginal revenue growth of 0.3%, AOS advances earnings per share by 6.3%, signaling solid operational momentum and efficient cost control.
ATS Corporation Analysis
ATS posted $2.53B revenue for 2025, down 16.5% year-over-year, with a net loss of $28M. Its gross margin contracts to 25.5%, and net margin turns negative at -1.1%. EBIT margin collapses to 0.6%, reflecting significant margin pressure and deteriorating profitability amid falling revenues and rising expenses.
Margin Strength vs. Revenue Volatility
AOS emerges as the fundamental winner with superior margin profiles and positive net income growth, exemplifying operational resilience. ATS’s steep revenue decline and persistent losses highlight structural challenges. For investors prioritizing sustainable profits, AOS’s consistent margins and earnings growth present a clearer, lower-risk profile.
Financial Ratios Comparison
These vital ratios act as a diagnostic tool to expose the underlying fiscal health, valuation premiums, and capital efficiency of the companies analyzed:
| Ratios | A. O. Smith Corporation (AOS) | ATS Corporation (ATS) |
|---|---|---|
| ROE | 25.6% | -1.6% |
| ROIC | 23.9% | 0.09% |
| P/E | 17.1 | -125.3 |
| P/B | 4.39 | 2.06 |
| Current Ratio | 1.50 | 1.69 |
| Quick Ratio | 0.94 | 1.41 |
| D/E | 0.09 | 1.00 |
| Debt-to-Assets | 6.1% | 36.8% |
| Interest Coverage | 53.9 | 0.09 |
| Asset Turnover | 1.22 | 0.55 |
| Fixed Asset Turnover | 5.62 | 5.66 |
| Payout Ratio | 35.8% | 0% |
| Dividend Yield | 2.09% | 0% |
| Fiscal Year | 2025 | 2025 |
Efficiency & Valuation Duel: The Vital Signs
Financial ratios act as a company’s DNA, revealing hidden risks and operational excellence beyond surface-level data.
A. O. Smith Corporation
AOS demonstrates robust profitability with a 25.64% ROE and a strong 14.26% net margin, signaling efficient earnings generation. Its P/E of 17.13 suggests a fairly valued stock, balanced by a solid 2.09% dividend yield rewarding shareholders. The firm’s capital structure is conservative, with low debt and high interest coverage, supporting operational stability.
ATS Corporation
ATS faces profitability challenges, reflected in negative ROE of -1.64% and a -1.11% net margin, indicating operational headwinds. Despite a favorable negative P/E, this is due to losses, not value. ATS maintains a strong liquidity position with a 1.69 current ratio but shows weak interest coverage and no dividend, highlighting financial stress and limited shareholder returns.
Premium Valuation vs. Operational Safety
AOS offers a superior balance of profitability and shareholder return, underpinned by conservative leverage and sustainable dividends. ATS’s ratios flag significant risk, with poor profitability and financial strain. Investors prioritizing operational safety and steady income will find AOS’s profile more fitting.
Which one offers the Superior Shareholder Reward?
I see A. O. Smith Corporation (AOS) delivers a balanced distribution strategy with a 2.1% dividend yield and about 36% payout ratio, covered comfortably by strong free cash flow (FCF). Its steady buybacks amplify shareholder returns. ATS Corporation (ATS) pays no dividend and shows negative free cash flow, relying on reinvestment to fuel growth. ATS’s high debt and weak margins impair buyback potential and raise sustainability concerns. Historically in industrial sectors, consistent dividends combined with buybacks often outperform pure growth plays in volatile markets. I conclude AOS offers the superior total return profile in 2026 due to its sustainable, shareholder-friendly capital allocation and robust cash generation.
Comparative Score Analysis: The Strategic Profile
The radar chart reveals the fundamental DNA and trade-offs of both firms, highlighting strengths and vulnerabilities across key financial metrics:
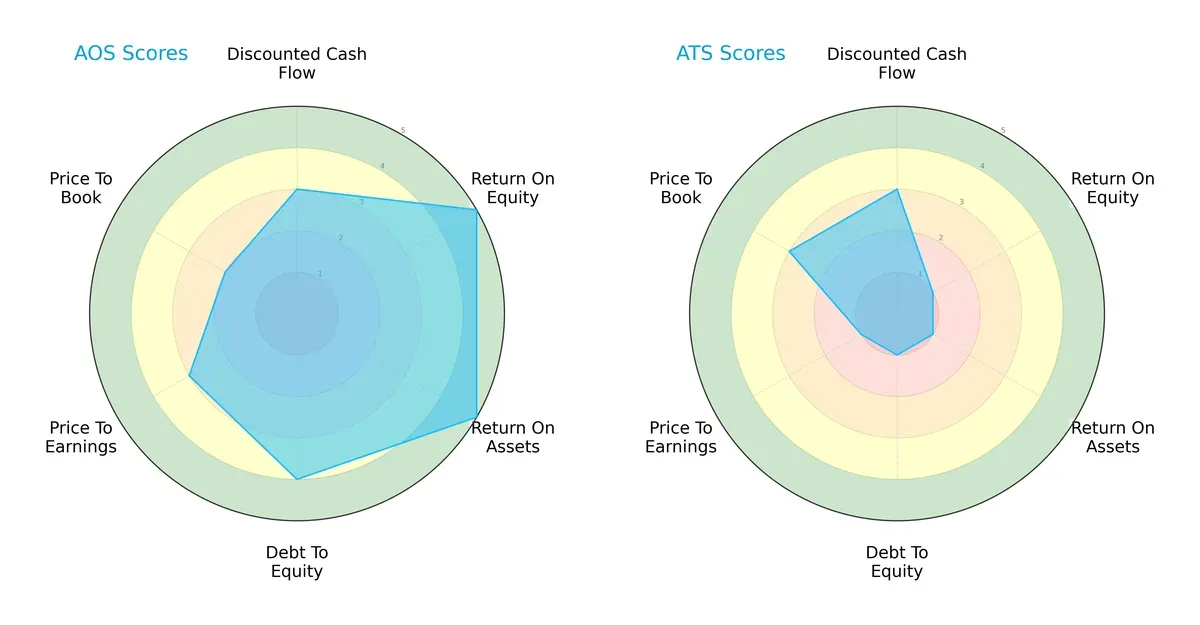
A. O. Smith Corporation (AOS) delivers a balanced profile with very favorable ROE and ROA scores, indicating efficient profit generation and asset use. Its debt-to-equity is also healthy, supporting financial stability. ATS Corporation (ATS) shows moderate DCF but suffers from very unfavorable profitability and leverage scores, signaling reliance on a weak operational base. AOS clearly maintains superior financial discipline and valuation balance.
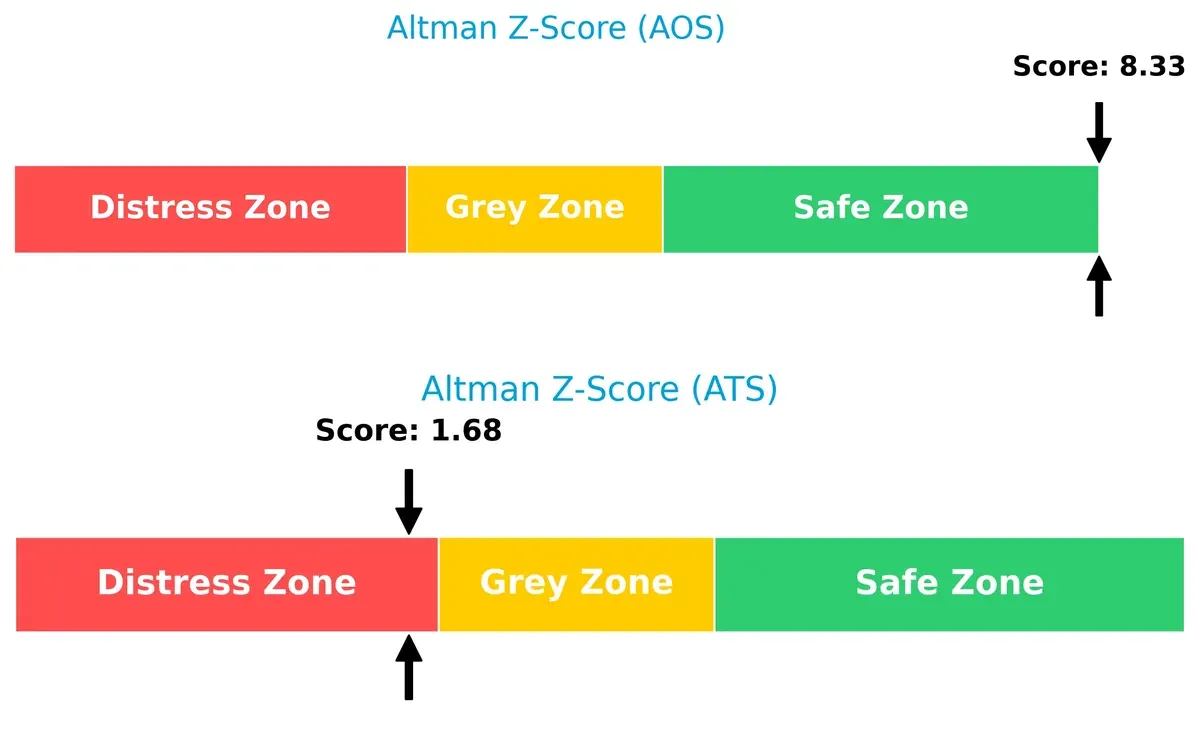
Bankruptcy Risk: Solvency Showdown
The Altman Z-Score gap signals vastly different survival prospects: AOS scores 8.3 in the safe zone, underscoring robust solvency, while ATS’s 1.7 places it in the distress zone, indicating high bankruptcy risk in this cycle:
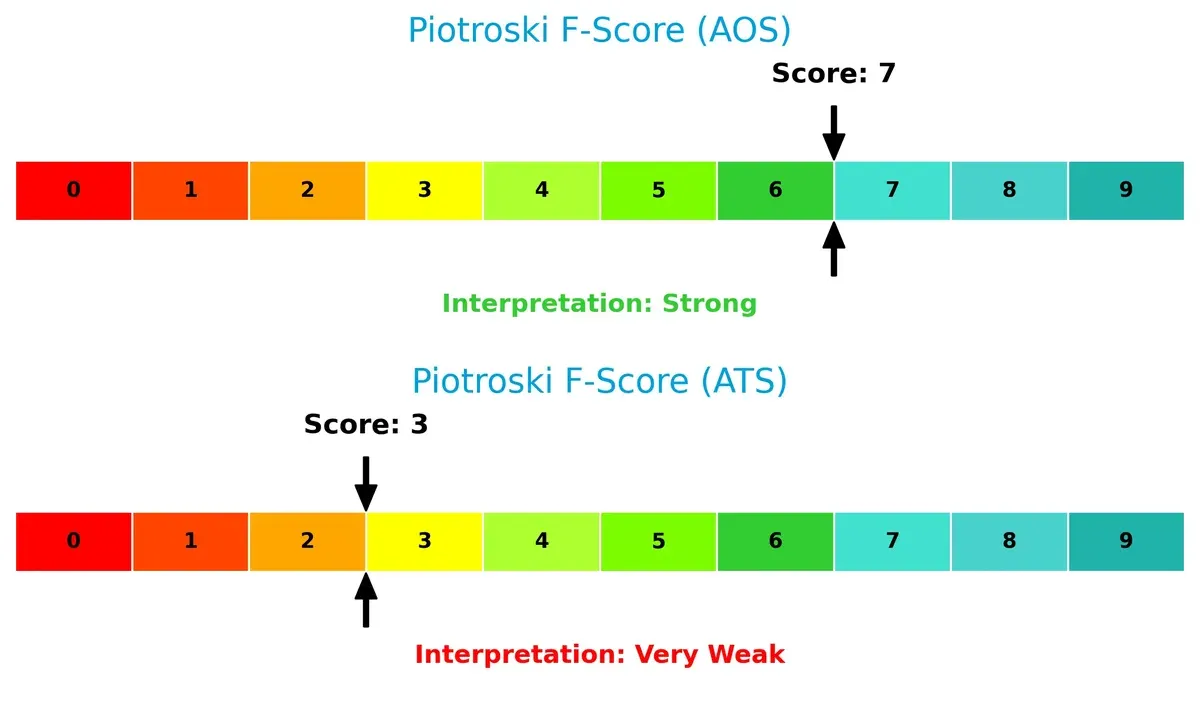
Financial Health: Quality of Operations
AOS’s Piotroski F-Score of 7 reflects strong operational quality and sound internal metrics. ATS’s score of 3 raises red flags, suggesting weaker financial health and operational challenges compared to its peer:
How are the two companies positioned?
This section dissects AOS and ATS’s operational DNA by comparing revenue distribution and internal strengths and weaknesses. The goal is to confront their economic moats and identify the more resilient, sustainable competitive advantage today.
Strengths and Weaknesses Comparison
This table compares the Strengths and Weaknesses of A. O. Smith Corporation and ATS Corporation:
A. O. Smith Corporation Strengths
- High profitability with 14.26% net margin and 25.64% ROE
- Strong return on invested capital at 23.94%
- Low debt-to-assets at 6.11% indicating conservative financial leverage
- Solid global presence with over 3.8B USD revenue across North America and Rest of World
ATS Corporation Strengths
- Favorable price-to-earnings ratio despite negative earnings
- Strong liquidity with current ratio of 1.69 and quick ratio of 1.41
- Diverse geographic revenue including significant US and European markets
- Efficient fixed asset turnover at 5.66
A. O. Smith Corporation Weaknesses
- Unfavorable weighted average cost of capital at 10.08% above ROIC
- Elevated price-to-book ratio at 4.39 may signal overvaluation
- Neutral liquidity ratios could indicate moderate working capital management
- Limited data on product diversification
ATS Corporation Weaknesses
- Negative profitability metrics with net margin at -1.11% and ROE at -1.64%
- Weak return on invested capital at 0.09% below cost of capital
- High debt-to-equity at 1.0 and low interest coverage of 0.16 raise solvency concerns
- No dividend yield reduces income appeal
A. O. Smith shows robust profitability and conservative financial management with a broad global footprint. ATS struggles with profitability and solvency but maintains liquidity and geographic diversity. These contrasts imply differing strategic priorities and risk profiles.
The Moat Duel: Analyzing Competitive Defensibility
A structural moat is the only thing protecting long-term profits from competition erosion. Let’s dissect the moats of A. O. Smith Corporation and ATS Corporation:
A. O. Smith Corporation: Durable Cost Advantage and Brand Equity
A. O. Smith leverages cost advantage and established brands in water heating. Its strong ROIC above WACC signals efficient capital use. Expansion in global water treatment markets could deepen its moat in 2026.
ATS Corporation: Specialized Automation Services with Narrower Moat
ATS depends on specialized automation solutions, but its declining ROIC versus WACC indicates weakening capital efficiency. Market disruptions and digital upgrades pose opportunities yet threaten its competitive edge.
Verdict: Cost Leadership vs. Specialized Automation Efficiency
A. O. Smith’s wide moat, driven by strong cost control and brand presence, outmatches ATS’s eroding profitability and narrowing moat. AOS is better positioned to defend and grow market share in 2026.
Which stock offers better returns?
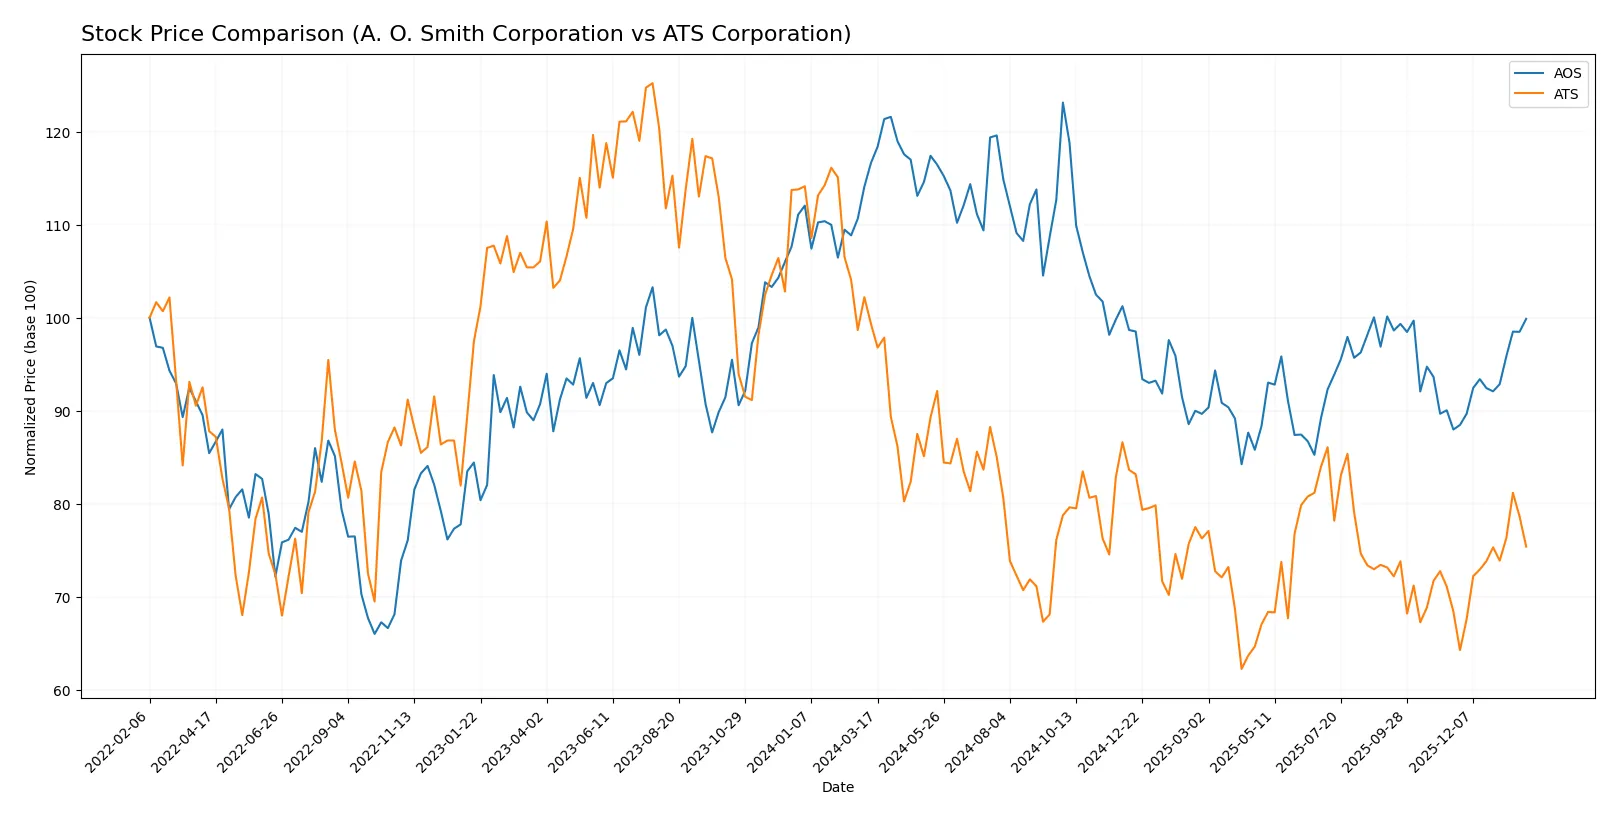
Over the past year, both stocks exhibit notable downward trends with recent rebounds. A. O. Smith shows higher volatility and stronger buyer dominance than ATS.
Trend Comparison
A. O. Smith’s stock fell 14.37% over the last 12 months, marking a bearish trend with accelerating decline. It hit a high of 90.59 and a low of 61.99, showing volatility at 7.87%.
ATS Corporation’s stock declined 24.09% in the same period, also bearish with accelerating losses. It ranged between 37.49 and 23.5, with lower volatility at 2.83%.
Comparing recent trends, A. O. Smith achieved a stronger 13.52% rebound versus ATS’s 10.18%. A. O. Smith delivered higher overall market performance despite both facing bearish pressure.
Target Prices
Analysts present a cautiously optimistic target consensus for both companies, reflecting measured growth expectations.
| Company | Target Low | Target High | Consensus |
|---|---|---|---|
| A. O. Smith Corporation | 75 | 85 | 79 |
| ATS Corporation | 34 | 34 | 34 |
The target consensus for A. O. Smith exceeds its current price of 73.49, indicating upside potential. ATS’s target price of 34 stands notably above its current price of 28.46, signaling analyst confidence despite recent share weakness.
How do institutions grade them?
Here is a summary of recent institutional grades for A. O. Smith Corporation and ATS Corporation:
A. O. Smith Corporation Grades
This table shows recent grades from reputable financial institutions for A. O. Smith Corporation.
| Grading Company | Action | New Grade | Date |
|---|---|---|---|
| Stifel | Maintain | Buy | 2026-01-30 |
| Citigroup | Maintain | Neutral | 2026-01-30 |
| DA Davidson | Maintain | Neutral | 2025-11-13 |
| Stifel | Maintain | Buy | 2025-10-29 |
| Citigroup | Maintain | Neutral | 2025-10-29 |
| Oppenheimer | Maintain | Outperform | 2025-07-28 |
| UBS | Maintain | Neutral | 2025-07-28 |
| Baird | Maintain | Neutral | 2025-07-25 |
| Stifel | Maintain | Buy | 2025-07-25 |
| Stifel | Maintain | Buy | 2025-07-21 |
ATS Corporation Grades
This table presents recent institutional grades for ATS Corporation from established firms.
| Grading Company | Action | New Grade | Date |
|---|---|---|---|
| JP Morgan | Maintain | Neutral | 2026-01-16 |
| JP Morgan | Maintain | Neutral | 2024-08-13 |
| Goldman Sachs | Maintain | Sell | 2024-08-13 |
| JP Morgan | Maintain | Neutral | 2024-05-24 |
Which company has the best grades?
A. O. Smith Corporation consistently receives Buy and Outperform ratings. ATS Corporation mainly holds Neutral grades with a recent Sell from Goldman Sachs. Investors may view A. O. Smith’s stronger grades as a sign of higher institutional confidence.

Don’t Let Luck Decide Your Entry Point
Optimize your entry points with our advanced ProRealTime indicators. You’ll get efficient buy signals with precise price targets for maximum performance. Start outperforming now!
Risks specific to each company
The following categories identify critical pressure points and systemic threats facing both firms in the 2026 market environment:
1. Market & Competition
A. O. Smith Corporation
- Strong market position in water heating and treatment, benefiting from diversified global footprint.
ATS Corporation
- Faces pressure from automation sector peers with thin margins and limited profitability.
2. Capital Structure & Debt
A. O. Smith Corporation
- Low debt-to-equity (0.09) and strong interest coverage (54x) indicate conservative leverage.
ATS Corporation
- High debt-to-equity (1.0) and poor interest coverage (0.16x) signal elevated financial risk.
3. Stock Volatility
A. O. Smith Corporation
- Beta of 1.35 suggests moderately higher volatility than market average.
ATS Corporation
- Beta of 1.27 also shows above-market volatility but slightly lower than AOS.
4. Regulatory & Legal
A. O. Smith Corporation
- Operates in regulated industrial sectors with compliance risks mainly related to environmental standards.
ATS Corporation
- Exposed to complex regulatory environments in automation and manufacturing, increasing compliance costs.
5. Supply Chain & Operations
A. O. Smith Corporation
- Global supply chain diversified but sensitive to raw material cost fluctuations.
ATS Corporation
- Relies on specialized components and just-in-time manufacturing, vulnerable to supply disruptions.
6. ESG & Climate Transition
A. O. Smith Corporation
- Strong focus on energy-efficient products and sustainability initiatives aligns with climate goals.
ATS Corporation
- ESG efforts less mature, with potential reputational risks amid increasing climate scrutiny.
7. Geopolitical Exposure
A. O. Smith Corporation
- Significant exposure to China and India markets, sensitive to trade tensions.
ATS Corporation
- Canadian base with global clients, exposed to North American trade policies and global supply chain risks.
Which company shows a better risk-adjusted profile?
A. O. Smith Corporation’s strongest risk is geopolitical exposure due to its China and India operations. ATS Corporation’s critical risk is its capital structure, marked by high leverage and weak coverage. Judging by financial health and risk control, A. O. Smith delivers a far superior risk-adjusted profile. Its Altman Z-score of 8.3 confirms financial safety, while ATS’s 1.7 warns of distress. This gap underscores ATS’s urgent need to improve profitability and reduce debt burden.
Final Verdict: Which stock to choose?
A. O. Smith Corporation impresses with its superpower of durable value creation, consistently earning returns well above its cost of capital. Its robust cash flow generation supports growth and dividends. A point of vigilance lies in its moderate valuation multiples, which could limit near-term upside. Ideal for portfolios seeking steady, aggressive growth.
ATS Corporation’s strategic moat is its niche in specialized manufacturing with some asset turnover efficiency, yet it struggles with declining profitability and heavy debt. Relative to AOS, it offers a more speculative profile with higher financial risk. It might suit investors looking for turnaround potential or high-risk, high-reward plays.
If you prioritize proven economic moats and capital efficiency, AOS outshines as the compelling choice due to its strong profitability and financial stability. However, if you seek speculative growth with potential recovery upside, ATS offers a different risk-reward profile but commands caution given its deteriorating fundamentals and balance sheet stress.
Disclaimer: Investment carries a risk of loss of initial capital. The past performance is not a reliable indicator of future results. Be sure to understand risks before making an investment decision.
Go Further
I encourage you to read the complete analyses of A. O. Smith Corporation and ATS Corporation to enhance your investment decisions: