Home > Comparison > Industrials > AME vs AOS
The strategic rivalry between AMETEK, Inc. and A. O. Smith Corporation shapes the industrial machinery sector’s evolution. AMETEK operates as a diversified electronic instruments and electromechanical devices manufacturer, while A. O. Smith focuses on residential and commercial water heating and treatment solutions. This analysis pits AMETEK’s broad industrial reach against A. O. Smith’s specialized market leadership, seeking to identify which trajectory offers superior risk-adjusted returns for a diversified portfolio.
Table of contents
Companies Overview
AMETEK and A. O. Smith are pivotal players in the industrial machinery sector, shaping global markets with distinct specialties.
AMETEK, Inc.: Industrial Instrumentation Powerhouse
AMETEK dominates as a manufacturer of electronic instruments and electromechanical devices worldwide. Its core revenue stems from two segments: Electronic Instruments serving aerospace and industrial markets, and Electromechanical products including precision motion controls and power systems. In 2026, AMETEK focuses strategically on expanding instrumentation applications in aerospace and industrial automation, reinforcing its competitive edge in high-precision technology.
A. O. Smith Corporation: Water Heating and Treatment Leader
A. O. Smith specializes in residential and commercial water heaters, boilers, and water treatment products across North America, China, Europe, and India. Its revenue engine relies on diversified product lines such as gas and electric water heaters and filtration systems. The 2026 strategic focus centers on broadening water treatment offerings and enhancing distribution through wholesale and direct-to-consumer e-commerce channels.
Strategic Collision: Similarities & Divergences
Both companies operate within industrial machinery but pursue contrasting business models: AMETEK emphasizes high-tech instrumentation and electromechanical innovation, while A. O. Smith centers on essential water heating and treatment solutions. Their primary battleground lies in industrial and commercial infrastructure markets. Investors encounter distinct profiles—AMETEK as a precision technology growth play and A. O. Smith as a steady, consumer-driven industrial supplier.
Income Statement Comparison
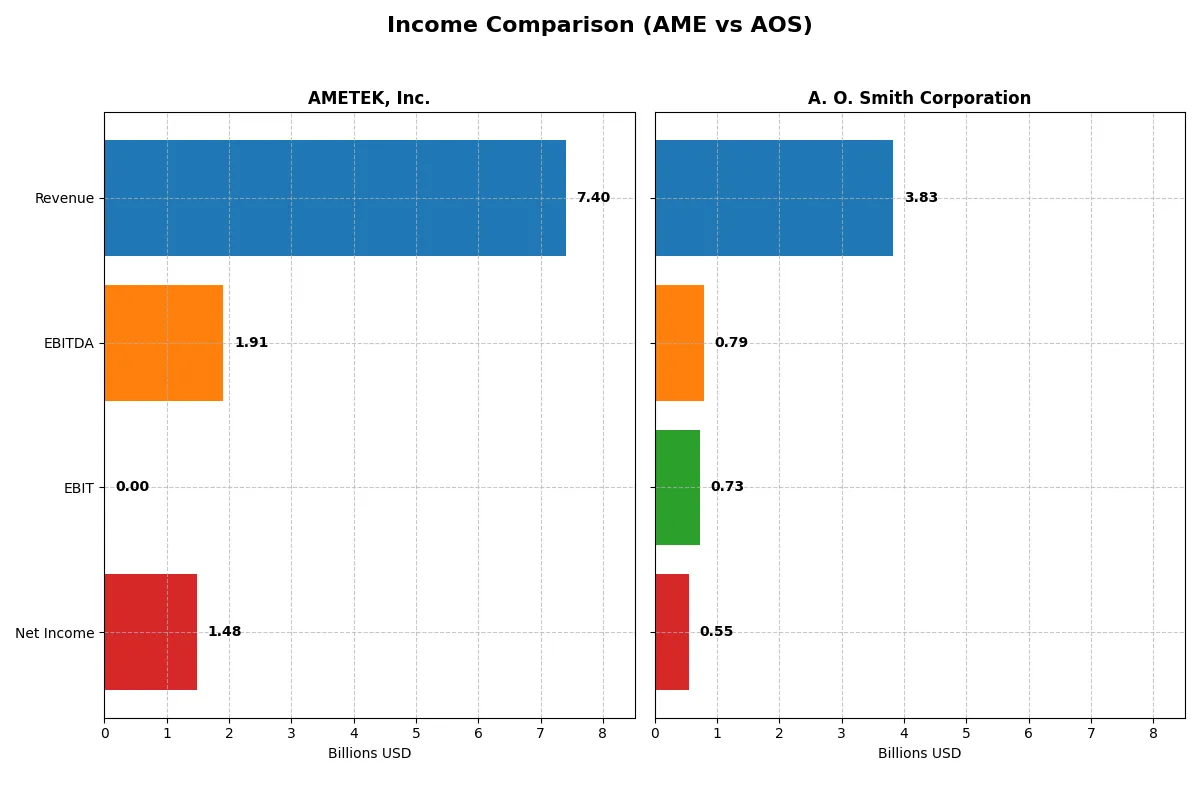
This data dissects the core profitability and scalability of both corporate engines to reveal who dominates the bottom line:
| Metric | AMETEK, Inc. (AME) | A. O. Smith Corporation (AOS) |
|---|---|---|
| Revenue | 7.4B | 3.8B |
| Cost of Revenue | 0 | 2.3B |
| Operating Expenses | 5.5B | 759M |
| Gross Profit | 0 | 1.5B |
| EBITDA | 1.9B | 792M |
| EBIT | 0 | 729M |
| Interest Expense | -81M | 13.5M |
| Net Income | 1.5B | 546M |
| EPS | 6.42 | 3.86 |
| Fiscal Year | 2025 | 2025 |
Income Statement Analysis: The Bottom-Line Duel
This income statement comparison unveils the true operational efficiency and profitability dynamics of two industrial leaders.
AMETEK, Inc. Analysis
AMETEK’s revenue climbed steadily from 5.5B in 2021 to 7.4B in 2025, with net income rising 49.5% over this period. Despite a lack of reported gross profit in 2025, net margin remains strong at 20%, signaling solid bottom-line control. The latest year shows EPS growth of 7.9%, reflecting improved capital efficiency.
A. O. Smith Corporation Analysis
A. O. Smith’s revenue grew modestly from 3.5B in 2021 to 3.8B in 2025, with net income up 12.1%. Gross margin holds at a healthy 38.8%, and net margin stands at 14.3%. The company posted a 6.3% EPS increase in 2025, indicating steady, if unspectacular, operational momentum.
Margin Power vs. Revenue Scale
AMETEK outpaces A. O. Smith in revenue growth and net income expansion, delivering nearly double the net margin. A. O. Smith shows consistent gross margin strength but slower top-line growth. For investors prioritizing scale and margin improvement, AMETEK’s profile offers a more compelling income statement trajectory.
Financial Ratios Comparison
These vital ratios act as a diagnostic tool to expose the underlying fiscal health, valuation premiums, and capital efficiency of the companies compared:
| Ratios | AMETEK, Inc. (AME) | A. O. Smith Corporation (AOS) |
|---|---|---|
| ROE | 14.3% | 25.6% |
| ROIC | 11.1% | 23.9% |
| P/E | 30.3 | 17.1 |
| P/B | 4.3 | 4.4 |
| Current Ratio | 1.24 | 1.50 |
| Quick Ratio | 0.75 | 0.94 |
| D/E | 0.24 | 0.09 |
| Debt-to-Assets | 15.9% | 6.1% |
| Interest Coverage | 15.8 | 53.9 |
| Asset Turnover | 0.47 | 1.22 |
| Fixed Asset Turnover | 6.58 | 5.62 |
| Payout ratio | 18.8% | 35.8% |
| Dividend yield | 0.62% | 2.09% |
| Fiscal Year | 2024 | 2025 |
Efficiency & Valuation Duel: The Vital Signs
Financial ratios act as a company’s DNA, revealing hidden risks and operational excellence beneath surface-level numbers.
AMETEK, Inc.
AMETEK posts a solid 14.25% ROE and a strong net margin near 20%, signaling operational efficiency. However, the stock trades at a stretched P/E of 30.3, suggesting overvaluation. Dividend yield sits low at 0.62%, indicating limited shareholder cash returns, with reinvestment focused on R&D and growth.
A. O. Smith Corporation
A. O. Smith impresses with a 25.6% ROE and a favorable net margin of 14.3%, reflecting robust profitability. The P/E ratio at 17.1 appears reasonable, balancing value and growth. Dividend yield of 2.09% provides steady income, supported by efficient capital allocation and solid returns on invested capital (23.9%).
Premium Valuation vs. Operational Safety
A. O. Smith offers a superior balance of profitability, valuation, and shareholder returns compared to AMETEK’s stretched multiples and lower yield. Investors seeking a blend of operational strength and income may find A. O. Smith’s profile more attractive, while AMETEK suits those prioritizing growth reinvestment despite valuation risks.
Which one offers the Superior Shareholder Reward?
I see AMETEK, Inc. (AME) pays a modest 0.62% dividend yield with a conservative 19% payout ratio, supporting sustainable growth. Its buyback programs are consistent, enhancing shareholder value through capital return and valuation support. A. O. Smith Corporation (AOS) offers a higher 2.1% dividend yield but with a hefty 36% payout ratio, raising sustainability concerns. AOS’s buyback activity is robust but less efficient given its lower free cash flow per share. I conclude AME delivers a more balanced and sustainable total return profile in 2026, blending dividends with disciplined buybacks and strong cash flow.
Comparative Score Analysis: The Strategic Profile
The radar chart reveals the fundamental DNA and trade-offs of AMETEK, Inc. and A. O. Smith Corporation:
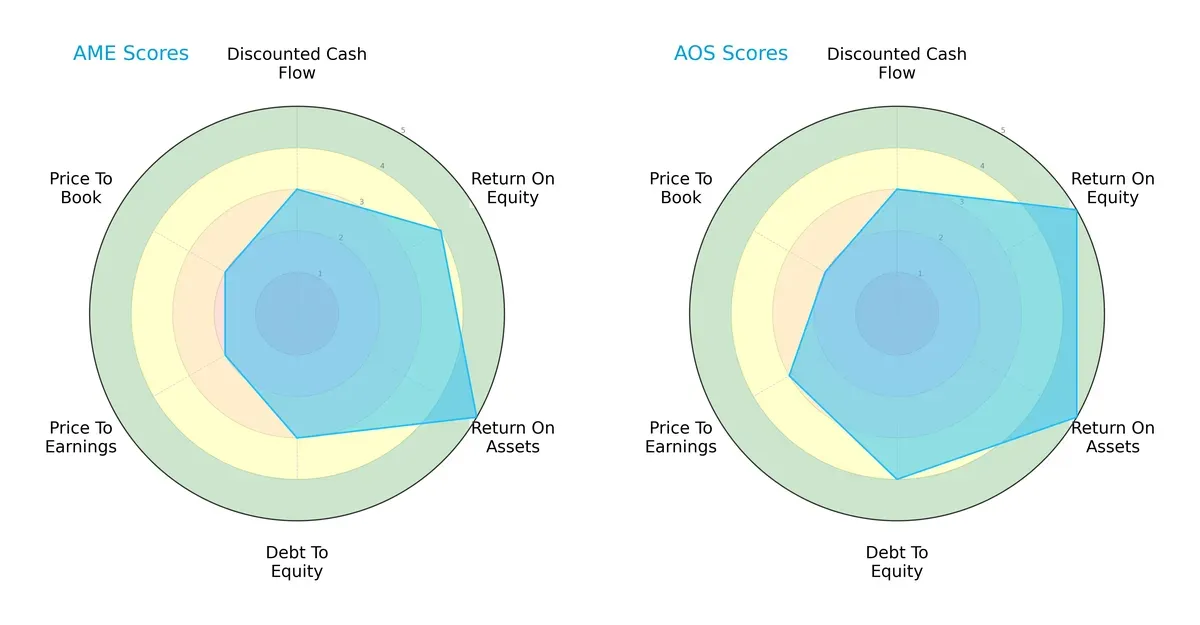
I observe that A. O. Smith Corporation leads with a more balanced profile, scoring higher in ROE (5 vs. 4) and debt-to-equity (4 vs. 3), signaling efficient profitability and stronger financial stability. AMETEK shines in ROA (5) but lags on valuation metrics with lower P/E scores (2 vs. 3). The latter relies more on asset efficiency, while A. O. Smith combines profitability and prudent leverage effectively.
Bankruptcy Risk: Solvency Showdown
A. O. Smith’s Altman Z-Score of 8.33 slightly outpaces AMETEK’s 7.46, both comfortably in the safe zone:
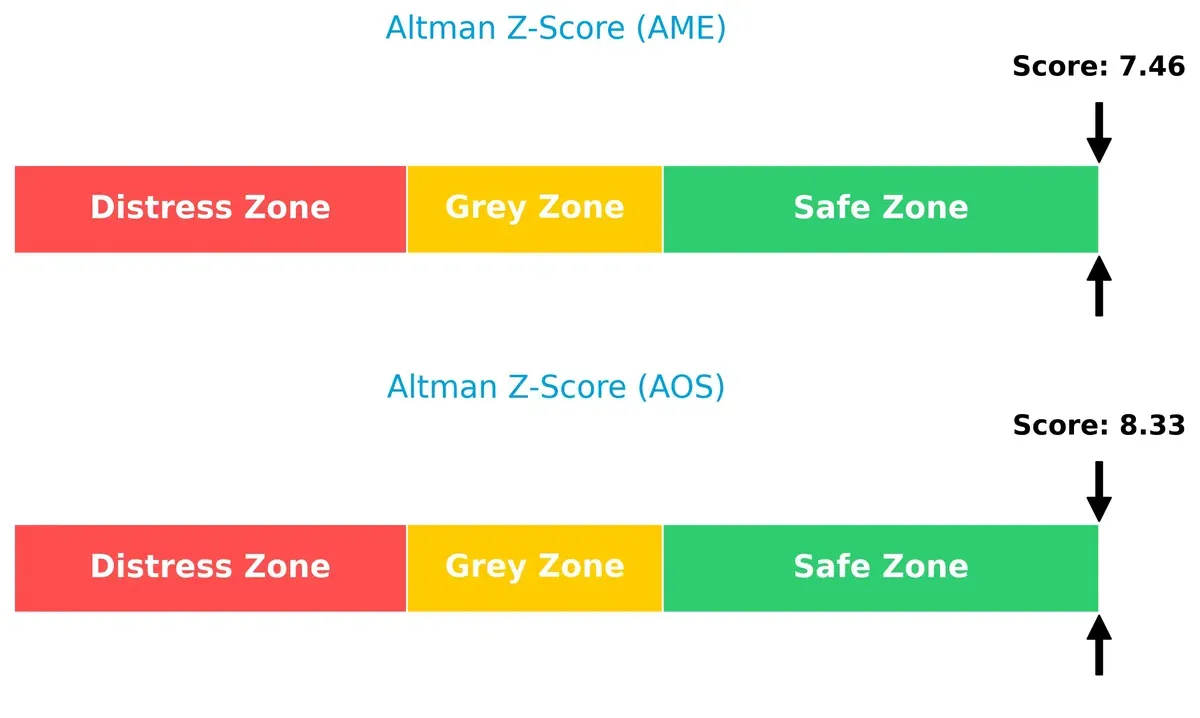
This indicates both firms possess robust financial health with minimal bankruptcy risk. However, A. O. Smith’s marginally higher score suggests a stronger buffer against cyclical downturns and credit stresses.
Financial Health: Quality of Operations
AMETEK scores an 8 on the Piotroski F-Score, outperforming A. O. Smith’s 7, reflecting very strong operational quality:
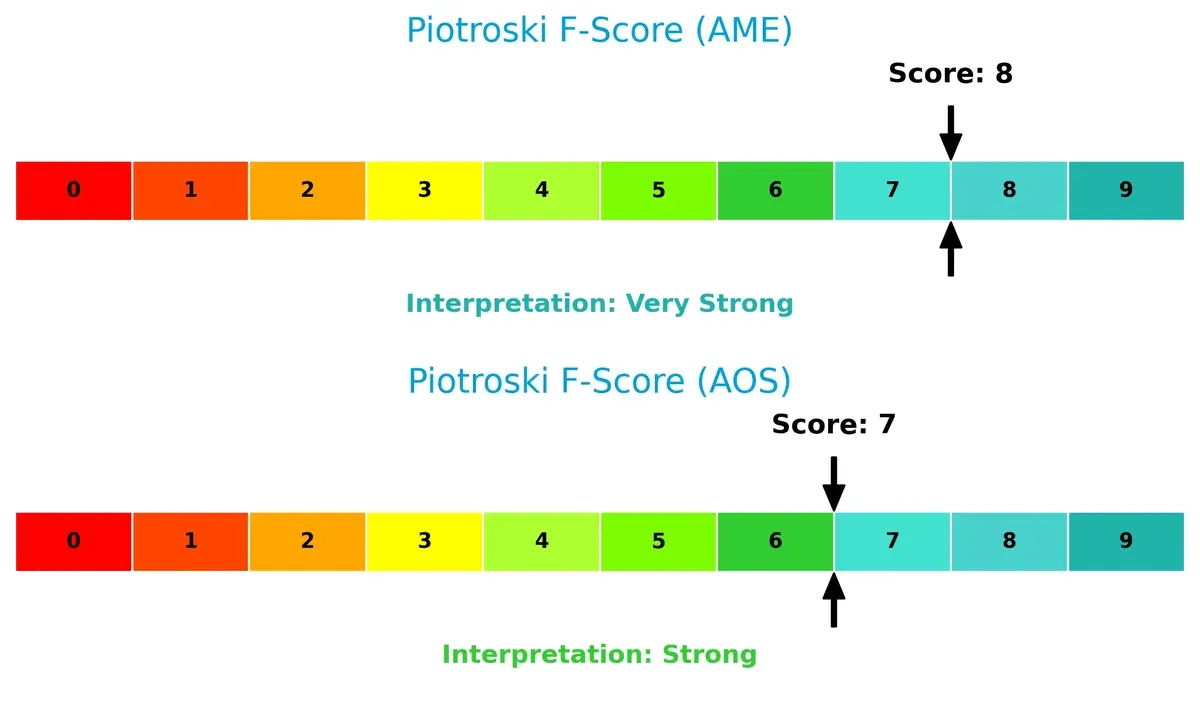
This suggests AMETEK maintains superior internal financial discipline and profitability metrics. A. O. Smith, while strong, shows slightly less operational robustness, warranting closer monitoring of internal efficiency trends.
How are the two companies positioned?
This section dissects AMETEK and A. O. Smith’s operational DNA by comparing revenue distribution and internal dynamics. The goal is to confront their economic moats and identify which model offers the most resilient competitive advantage today.
Revenue Segmentation: The Strategic Mix
The following visual comparison dissects how AMETEK, Inc. and A. O. Smith Corporation diversify their income streams and where their primary sector bets lie:
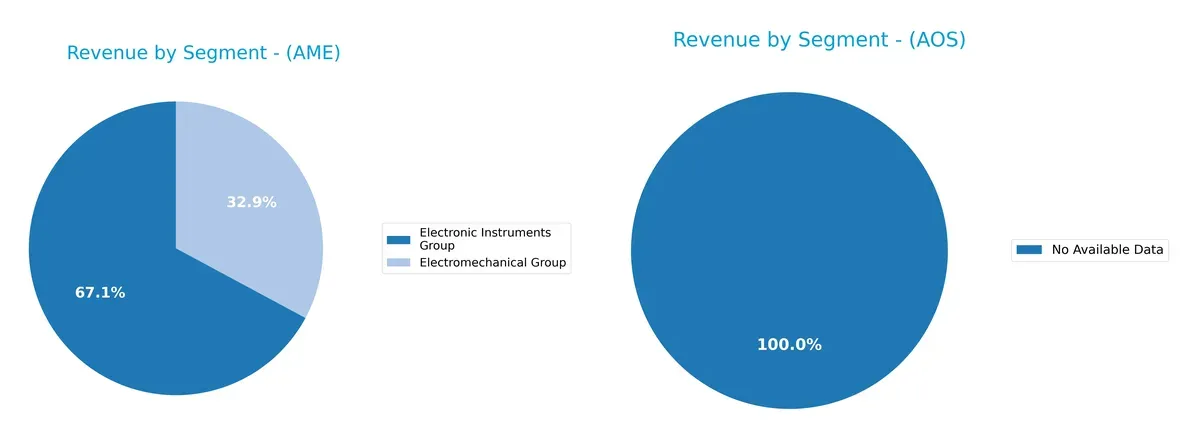
AMETEK, Inc. anchors its revenue in two main segments: Electronic Instruments Group (~4.65B in 2024) and Electromechanical Group (~2.28B). This split shows a balanced but slightly Electronics-heavy portfolio, reducing dependency risk. A. O. Smith Corporation lacks segment data here, so I cannot assess its diversification. AMETEK’s dual-segment strength suggests robust ecosystem lock-in, leveraging both instrumentation and electromechanical infrastructure.
Strengths and Weaknesses Comparison
This table compares the Strengths and Weaknesses of AMETEK, Inc. and A. O. Smith Corporation:
AMETEK, Inc. Strengths
- Strong diversification with Electromechanical and Electronic Instruments segments
- Favorable net margin of 19.83%
- Low debt-to-assets ratio at 15.89%
- Favorable fixed asset turnover at 6.58
- Solid global presence including US, EU, UK, Asia
- Growing revenues in product and geographic segments
A. O. Smith Corporation Strengths
- Favorable profitability metrics: 14.26% net margin, 25.64% ROE, 23.94% ROIC
- Low debt-to-assets ratio at 6.11%
- High interest coverage at 54.03
- Strong asset turnover at 1.22
- Global revenue split between North America and Rest of World
- Higher dividend yield at 2.09%
AMETEK, Inc. Weaknesses
- Unfavorable P/E (30.29) and P/B (4.32) ratios
- Unfavorable quick ratio at 0.75
- Negative interest coverage
- Unfavorable asset turnover at 0.47
- Dividend yield low at 0.62%
- Slightly unfavorable overall ratio profile
A. O. Smith Corporation Weaknesses
- Unfavorable WACC at 10.06%
- P/B ratio unfavorable at 4.39
- Neutral current and quick ratios (1.5 and 0.94)
- Slight exposure to valuation risk with P/E neutral at 17.13
Both companies show robust strengths in profitability and global presence, but AMETEK faces challenges in liquidity and valuation metrics. A. O. Smith’s superior profitability and financial stability contrast with its slightly higher cost of capital and valuation concerns. These insights highlight each company’s strategic focus areas.
The Moat Duel: Analyzing Competitive Defensibility
A structural moat alone shields long-term profits from relentless competition erosion. Let’s dissect each firm’s moat and future prospects:
AMETEK, Inc.: Diversified Industrial Innovation
AMETEK’s moat stems from a diverse portfolio of specialized electronic instruments and electromechanical devices. This manifests in steady revenue growth (+33% over five years) and a rising ROIC trend (+27%), signaling efficient capital use. Expansion into aerospace and precision manufacturing markets in 2026 could strengthen this advantage, though margin volatility remains a caution.
A. O. Smith Corporation: Market-Leading Water Technology
A. O. Smith leverages strong brand recognition and cost advantages in residential and commercial water heating. Its ROIC outpaces WACC by 14%, with a solid 19% ROIC growth trend, reflecting robust value creation. While revenue growth lags slightly, new product lines and geographic expansion offer growth vectors to deepen its moat going forward.
Moat Strength Showdown: Diversification vs. Cost Leadership
AMETEK’s diverse innovation-driven moat contrasts with A. O. Smith’s focused cost and brand moat. A. O. Smith’s wider economic moat, evidenced by clear ROIC superiority and value creation, positions it better to defend market share. AMETEK’s growth trajectory is promising but requires margin stability to close the gap.
Which stock offers better returns?
The past year shows AMETEK, Inc. with a strong upward trajectory, while A. O. Smith Corporation experiences a declining overall trend despite recent gains.
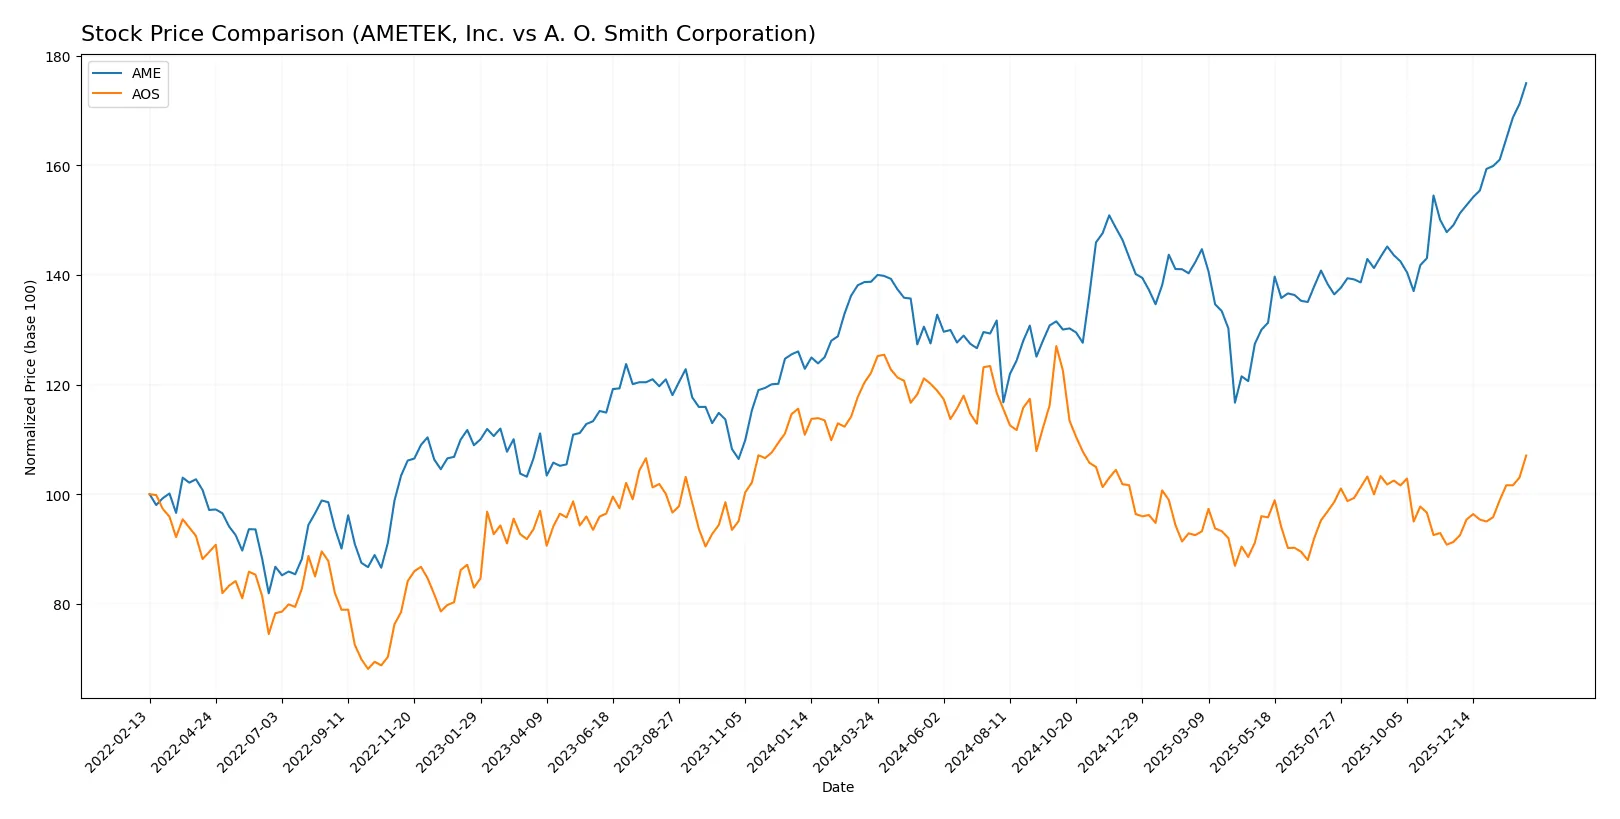
Trend Comparison
AMETEK, Inc. posted a 26.11% price increase over the last 12 months, marking a bullish trend with accelerating momentum and a high of 228.92. The stock shows notable volatility with a 14.45 standard deviation.
A. O. Smith Corporation declined 12.34% over the same period, indicating a bearish trend despite recent price gains of 17.27%. It has lower volatility, with a 7.79 standard deviation, and its lowest price hit 61.99.
AMETEK, Inc. outperformed A. O. Smith Corporation over the past year, delivering the highest market returns supported by accelerating price appreciation and stronger buyer dominance.
Target Prices
Analysts present a cautiously optimistic target consensus for both AMETEK, Inc. and A. O. Smith Corporation.
| Company | Target Low | Target High | Consensus |
|---|---|---|---|
| AMETEK, Inc. | 204 | 271 | 231.64 |
| A. O. Smith Corporation | 75 | 85 | 78 |
The consensus price for AMETEK slightly exceeds its current 229 price, signaling moderate upside. A. O. Smith’s consensus aligns closely with its 76 current price, suggesting limited near-term appreciation.

Don’t Let Luck Decide Your Entry Point
Optimize your entry points with our advanced ProRealTime indicators. You’ll get efficient buy signals with precise price targets for maximum performance. Start outperforming now!
How do institutions grade them?
The following tables summarize recent institutional grades for AMETEK, Inc. and A. O. Smith Corporation:
AMETEK, Inc. Grades
This table presents recent grade updates from notable financial institutions for AMETEK, Inc.
| Grading Company | Action | New Grade | Date |
|---|---|---|---|
| Oppenheimer | Downgrade | Perform | 2026-01-27 |
| Morgan Stanley | Maintain | Equal Weight | 2026-01-12 |
| Keybanc | Maintain | Overweight | 2026-01-07 |
| Barclays | Maintain | Equal Weight | 2026-01-07 |
| Keybanc | Maintain | Overweight | 2026-01-06 |
| Mizuho | Maintain | Outperform | 2026-01-05 |
| TD Cowen | Upgrade | Buy | 2025-12-23 |
| DA Davidson | Maintain | Buy | 2025-12-08 |
| Baird | Maintain | Neutral | 2025-11-03 |
| Keybanc | Maintain | Overweight | 2025-10-31 |
A. O. Smith Corporation Grades
This table presents recent grade updates from notable financial institutions for A. O. Smith Corporation.
| Grading Company | Action | New Grade | Date |
|---|---|---|---|
| DA Davidson | Maintain | Neutral | 2026-02-02 |
| Citigroup | Maintain | Neutral | 2026-01-30 |
| Stifel | Maintain | Buy | 2026-01-30 |
| DA Davidson | Maintain | Neutral | 2025-11-13 |
| Citigroup | Maintain | Neutral | 2025-10-29 |
| Stifel | Maintain | Buy | 2025-10-29 |
| Oppenheimer | Maintain | Outperform | 2025-07-28 |
| UBS | Maintain | Neutral | 2025-07-28 |
| Baird | Maintain | Neutral | 2025-07-25 |
| Stifel | Maintain | Buy | 2025-07-25 |
Which company has the best grades?
A. O. Smith Corporation holds steadier Buy and Outperform ratings, signaling stronger analyst conviction. AMETEK’s recent downgrade to Perform introduces caution. Investors may interpret A. O. Smith’s grades as more favorable for growth prospects.
Risks specific to each company
The following categories identify the critical pressure points and systemic threats facing both firms in the 2026 market environment:
1. Market & Competition
AMETEK, Inc.
- Faces intense competition in industrial instrumentation and aerospace sectors, requiring constant innovation.
A. O. Smith Corporation
- Competes in water heating and treatment markets with pressure from global and regional players.
2. Capital Structure & Debt
AMETEK, Inc.
- Maintains moderate debt levels with debt-to-assets at 15.9%, but interest coverage is weak, signaling risk.
A. O. Smith Corporation
- Low leverage with 6.1% debt-to-assets and strong interest coverage of 54x, reflecting solid financial health.
3. Stock Volatility
AMETEK, Inc.
- Beta near 1.04 indicates market-level volatility, with stock price ranging widely from $145 to $233.
A. O. Smith Corporation
- Higher beta at 1.34 shows greater sensitivity to market swings, with a narrower price range near $59 to $77.
4. Regulatory & Legal
AMETEK, Inc.
- Exposure to aerospace and industrial regulations demands compliance and risk management.
A. O. Smith Corporation
- Faces environmental and safety regulations across global water treatment and heating markets.
5. Supply Chain & Operations
AMETEK, Inc.
- Complexity from diverse product lines and global operations may cause supply disruptions.
A. O. Smith Corporation
- Relies on multiple geographic regions, including China and India, risking supply chain volatility.
6. ESG & Climate Transition
AMETEK, Inc.
- Increasing pressure to innovate sustainable products and reduce carbon footprint in manufacturing.
A. O. Smith Corporation
- Product portfolio includes energy-efficient water heaters, positioning well for climate transition.
7. Geopolitical Exposure
AMETEK, Inc.
- Global aerospace and industrial footprint exposes it to geopolitical tensions and trade risks.
A. O. Smith Corporation
- Significant operations in China and India increase vulnerability to geopolitical disruptions.
Which company shows a better risk-adjusted profile?
AMETEK’s biggest risk is weak interest coverage, threatening financial flexibility despite moderate debt. A. O. Smith faces geopolitical risks but boasts stronger capital structure and profitability metrics. A. O. Smith’s favorable debt ratios and high interest coverage create a superior risk-adjusted profile. Their 54x interest coverage contrasts sharply with AMETEK’s near zero, justifying heightened caution for AMETEK investors.
Final Verdict: Which stock to choose?
AMETEK, Inc. excels as a cash-generating powerhouse with a steadily growing return on invested capital, signaling efficient capital use. Its point of vigilance lies in a stretched valuation and some liquidity concerns. This stock suits aggressive growth portfolios willing to endure valuation risk for operational excellence.
A. O. Smith Corporation boasts a robust strategic moat, underpinned by superior returns on equity and capital, paired with a very favorable safety profile. It offers more stability than AMETEK, with a reasonable valuation supporting sustainable growth. This stock fits well within GARP portfolios seeking steady appreciation and income.
If you prioritize aggressive expansion and capital efficiency, AMETEK commands attention for its operational strength despite valuation headwinds. However, if you seek a durable competitive advantage with better balance sheet stability and a more moderate price, A. O. Smith outshines as the prudent choice for balanced growth investors.
Disclaimer: Investment carries a risk of loss of initial capital. The past performance is not a reliable indicator of future results. Be sure to understand risks before making an investment decision.
Go Further
I encourage you to read the complete analyses of AMETEK, Inc. and A. O. Smith Corporation to enhance your investment decisions: