Home > Comparison > Industrials > HON vs MMM
The strategic rivalry between Honeywell International Inc. and 3M Company shapes the industrial conglomerates sector’s evolution. Honeywell operates a diversified technology and manufacturing model focused on aerospace, building technologies, and performance materials. In contrast, 3M emphasizes a diversified technology approach spanning safety, transportation, healthcare, and consumer products. This analysis will weigh their distinct operational trajectories to identify the superior risk-adjusted investment opportunity for a diversified portfolio.
Table of contents
Companies Overview
Honeywell International Inc. and 3M Company stand as titans in the global industrial conglomerate landscape.
Honeywell International Inc.: Diversified Technology Powerhouse
Honeywell International dominates as a diversified technology and manufacturing leader. It generates revenue through aerospace systems, building technologies, performance materials, and safety solutions. In 2026, Honeywell focuses strategically on integrating advanced software and automation to enhance productivity and sustainability across industries.
3M Company: Innovation-Driven Conglomerate
3M Company excels as a global diversified technology firm spanning safety, transportation, healthcare, and consumer segments. Its core revenue comes from industrial abrasives, adhesives, healthcare products, and consumer goods. The 2026 strategy emphasizes expanding its healthcare and electronics solutions to capture emerging market opportunities.
Strategic Collision: Similarities & Divergences
Both companies embrace diversification across industrial sectors but differ in innovation focus: Honeywell leans on automation software, while 3M prioritizes healthcare and electronics innovation. Their primary battleground lies in industrial technology and safety solutions. Investors see Honeywell as a tech-forward conglomerate and 3M as an innovation-driven classic, each with distinct risk-reward profiles.
Income Statement Comparison
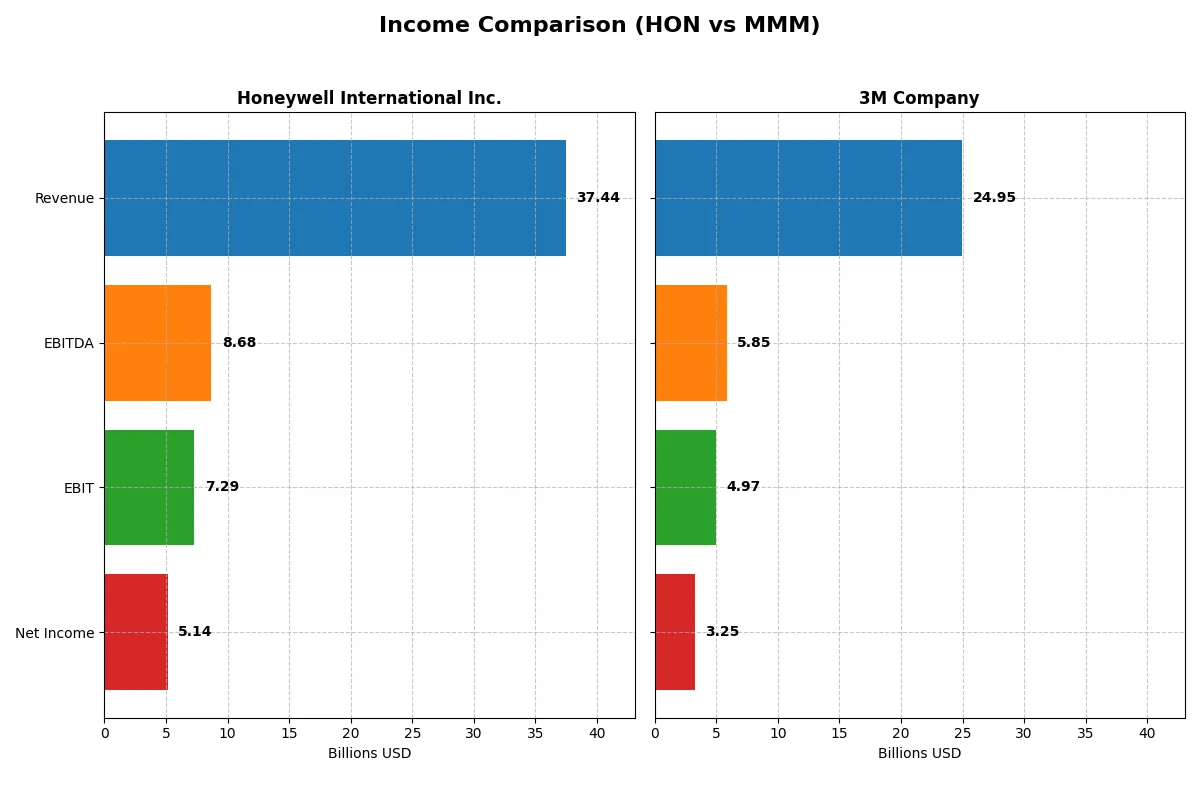
This data dissects the core profitability and scalability of both corporate engines to reveal who dominates the bottom line:
| Metric | Honeywell International Inc. (HON) | 3M Company (MMM) |
|---|---|---|
| Revenue | 37.4B | 24.9B |
| Cost of Revenue | 23.6B | 15.1B |
| Operating Expenses | 7.2B | 5.3B |
| Gross Profit | 13.8B | 9.9B |
| EBITDA | 8.7B | 5.9B |
| EBIT | 7.3B | 5.0B |
| Interest Expense | 1.3B | 0.7B |
| Net Income | 5.1B | 3.3B |
| EPS | 8.03 | 6.04 |
| Fiscal Year | 2025 | 2025 |
Income Statement Analysis: The Bottom-Line Duel
This income statement comparison reveals which company runs its operations with superior efficiency and profitability.
Honeywell International Inc. Analysis
Honeywell’s revenue grew 8.9% over five years but declined 2.7% in 2025, ending at $37.4B. Net income slid 7.3% overall and dropped 7.4% last year to $5.1B. Its gross margin steadies near 37%, while net margin holds a solid 13.7%, reflecting consistent cost control despite recent pressure on profits.
3M Company Analysis
3M’s revenue fell 29% over five years, yet slightly increased 1.5% in 2025 to $24.9B. Net income plunged 45% over the period and dropped 23% last year, hitting $3.25B. Its gross margin exceeds Honeywell’s at 39.6%, and net margin remains close at 13%, but earnings momentum lags significantly, signaling operational challenges.
Margin Stability vs. Earnings Momentum
Honeywell shows better revenue growth and steadier margins, despite last year’s slight declines. 3M boasts higher gross margins but suffers from steep declines in both revenue and net income. For investors prioritizing stable profitability with moderate growth, Honeywell’s profile appears more attractive.
Financial Ratios Comparison
These vital ratios act as a diagnostic tool to expose underlying fiscal health, valuation premiums, and capital efficiency across companies for informed comparison:
| Ratios | Honeywell International Inc. (HON) | 3M Company (MMM) |
|---|---|---|
| ROE | 33.3% | 68.5% |
| ROIC | 9.4% | 11.5% |
| P/E | 24.1 | 26.3 |
| P/B | 8.03 | 18.0 |
| Current Ratio | 1.32 | 1.71 |
| Quick Ratio | 1.05 | 1.33 |
| D/E | 2.14 | 2.73 |
| Debt-to-Assets | 44.6% | 34.3% |
| Interest Coverage | 5.16 | 6.34 |
| Asset Turnover | 0.54 | 0.66 |
| Fixed Asset Turnover | 8.71 | 3.28 |
| Payout ratio | 57.9% | 36.2% |
| Dividend yield | 2.40% | 1.37% |
| Fiscal Year | 2025 | 2025 |
Efficiency & Valuation Duel: The Vital Signs
Financial ratios act as a company’s DNA, uncovering hidden risks and revealing operational efficiency and valuation nuances.
Honeywell International Inc.
Honeywell delivers strong profitability with a 33.3% ROE and a favorable 12.7% net margin. Its P/E of 24.1 stands neutral, reflecting a fair valuation, though an 8.0 PB ratio is stretched. The company rewards shareholders with a 2.4% dividend yield, balancing returns with reinvestment in R&D for growth.
3M Company
3M boasts an exceptional 68.5% ROE and a solid 13.0% net margin, signaling high profitability. Its valuation is stretched, with a 26.3 P/E and an 18.0 PB ratio. Shareholder returns rely more on capital appreciation; the 1.4% dividend yield is modest, complemented by steady reinvestment in innovation.
Premium Valuation vs. Operational Safety
3M’s high ROE and margin come at a premium valuation and higher debt levels, while Honeywell offers robust profitability with more moderate valuation and stronger dividend yield. Investors seeking growth may prefer 3M’s aggressive profile, whereas those favoring stability might lean toward Honeywell’s balanced risk-reward.
Which one offers the Superior Shareholder Reward?
Honeywell International (HON) offers a more sustainable and attractive shareholder reward than 3M Company (MMM) in 2026. HON yields 2.4% dividends with a 58% payout ratio, fully covered by free cash flow of 8.5B, and runs a steady buyback program enhancing total returns. MMM delivers lower dividend yield (~1.4%-2.8%) with a volatile payout ratio and weaker free cash flow coverage (2.6B FCF vs. higher capex), relying heavily on debt-financed buybacks amid elevated leverage (debt/equity >2.7). HON’s balanced distribution, stronger cash flow, and conservative capital allocation underpin long-term value creation. I conclude HON offers superior total shareholder return potential with better risk management and distribution sustainability.
Comparative Score Analysis: The Strategic Profile
The radar chart reveals the fundamental DNA and trade-offs of Honeywell International Inc. and 3M Company, highlighting their financial strengths and vulnerabilities:
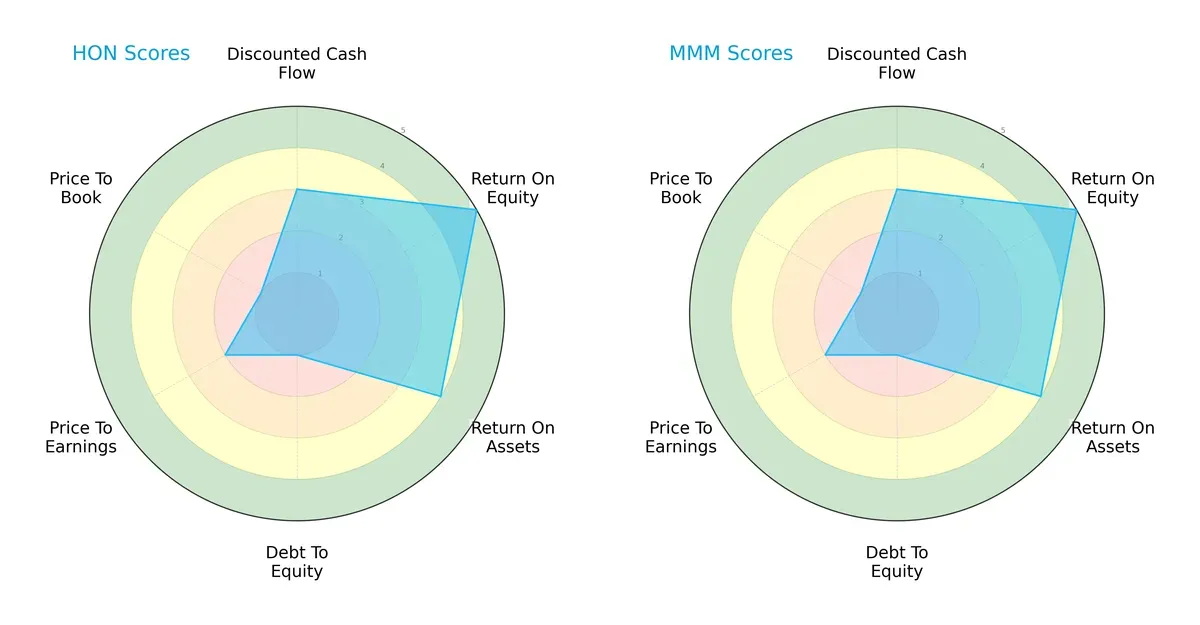
Both firms share identical profiles across DCF, ROE, ROA, Debt/Equity, and valuation scores. They excel with very favorable ROE and favorable ROA, showing efficient profit generation and asset use. However, both suffer from very unfavorable debt-to-equity and price-to-book scores, indicating high leverage and potentially overvalued book values. Neither company displays a clearly more balanced profile; they rely heavily on operational efficiency but carry significant financial risk from leverage.
Bankruptcy Risk: Solvency Showdown
The Altman Z-Scores place Honeywell at 2.66 and 3M at 2.81, both in the grey zone, signaling moderate bankruptcy risk in this economic cycle:
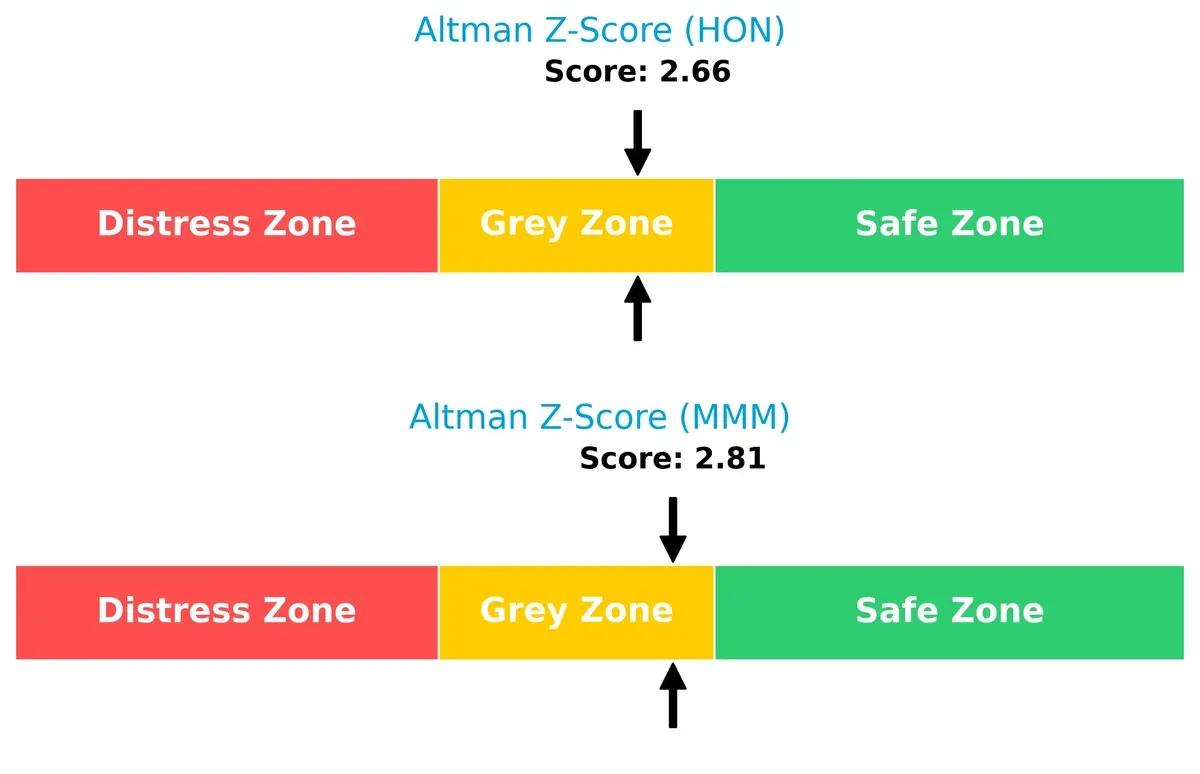
Both companies face a cautionary outlook. Their scores suggest neither is in immediate danger, but financial distress could arise if market conditions worsen. This grey zone status demands vigilant monitoring of liquidity and leverage as the cycle evolves.
Financial Health: Quality of Operations
Honeywell scores a 6 on the Piotroski scale, while 3M posts a stronger 7, indicating better overall financial health for 3M:
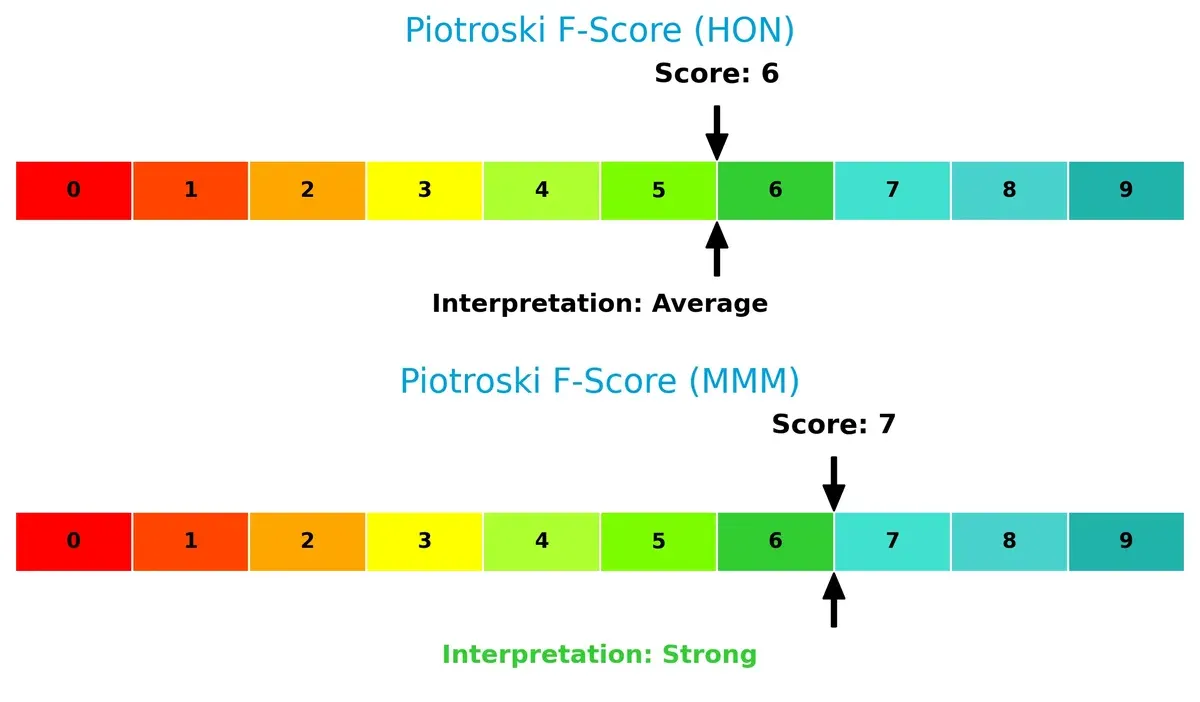
3M’s slightly higher Piotroski score reveals stronger internal operations and fewer red flags. Honeywell’s average score suggests some areas need attention, particularly in profitability or efficiency metrics. Investors should weigh 3M’s superior operational quality against both firms’ shared leverage concerns.
How are the two companies positioned?
This section dissects Honeywell and 3M’s operational DNA by comparing their revenue distribution and internal dynamics. The goal is to confront their economic moats and identify which model delivers the most resilient competitive advantage today.
Revenue Segmentation: The Strategic Mix
This visual comparison dissects how Honeywell International Inc. and 3M Company diversify their income streams and highlights their primary sector bets:
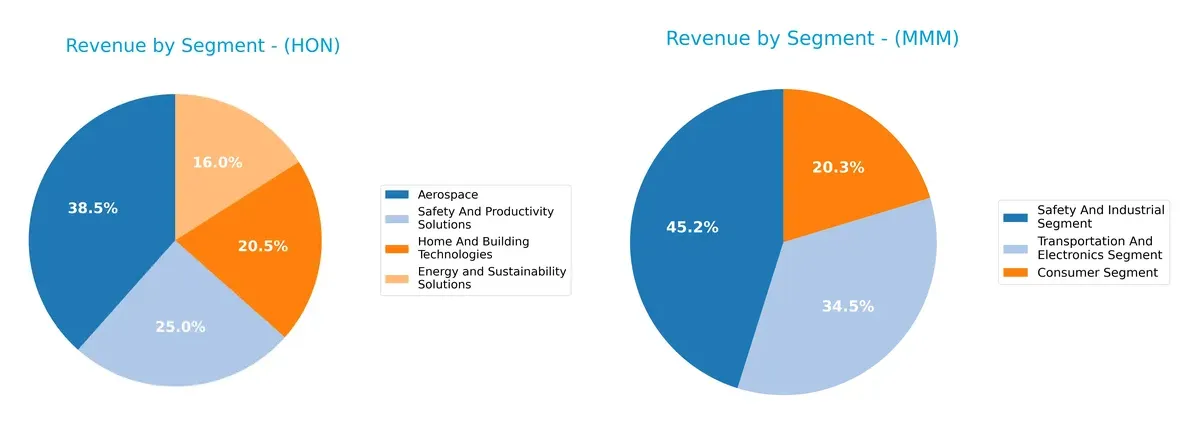
Honeywell anchors its revenue heavily in Aerospace at $15.5B, with three other strong segments each above $6.4B, reflecting a balanced industrial and technology portfolio. In contrast, 3M leans on its Safety and Industrial segment at $11B but spreads revenue more evenly across Transportation & Electronics ($8.4B) and Consumer ($4.9B) segments. Honeywell’s concentration in Aerospace signals exposure to cyclical aerospace demand, while 3M’s broader spread reduces single-sector risk but may dilute focus.
Strengths and Weaknesses Comparison
This table compares the strengths and weaknesses of Honeywell International Inc. (HON) and 3M Company (MMM) based on diversification, profitability, financials, innovation, global presence, and market share:
HON Strengths
- Diverse revenue streams across Aerospace, Safety, Home Tech, and Energy
- Favorable net margin (12.74%) and ROE (33.28%)
- Strong interest coverage (5.42) and fixed asset turnover (8.71)
- Solid quick ratio (1.05) indicating liquidity
MMM Strengths
- Balanced revenue across Safety, Transportation, Consumer, and Health Care
- Superior profitability with higher net margin (13.03%), ROE (68.46%), and ROIC (11.53%)
- Strong liquidity ratios (current 1.71, quick 1.33)
- Higher interest coverage (6.91) supports debt servicing
HON Weaknesses
- Higher debt-to-equity (2.14) and unfavorable PB ratio (8.03) reflect leverage concerns
- Neutral ROIC (9.41%) just above WACC (7.25%) limits value creation
- Moderate current ratio (1.32) less robust than MMM
- Slightly lower asset turnover (0.54)
MMM Weaknesses
- Elevated debt-to-equity (2.73) and unfavorable PE (26.32) and PB (18.02) suggest valuation and leverage risks
- Higher WACC (8.61%) impacts capital efficiency
- Dividend yield lower (1.37%) compared to HON
- Asset turnover moderate (0.66) but fixed asset turnover lower (3.28)
Both companies exhibit solid profitability and a diversified product mix supporting global operations. HON’s strengths lie in asset efficiency and dividend yield, while MMM excels in return metrics and liquidity. Each faces leverage and valuation challenges that may influence strategic financial decisions going forward.
The Moat Duel: Analyzing Competitive Defensibility
A structural moat protects a company’s long-term profits from relentless competition erosion. Here’s how Honeywell and 3M stack up:
Honeywell International Inc.: Diversified Technology Moat
Honeywell’s moat stems from its intangible assets and diversified technology platforms. This drives a stable 19.5% EBIT margin and 13.7% net margin. However, 2026 risks include declining ROIC trends and modest revenue contraction.
3M Company: Innovation and Brand Moat
3M’s moat relies on strong intangible assets and cost advantages, evident in a 19.9% EBIT margin and 39.6% gross margin. Despite deeper ROIC value creation than Honeywell, 3M faces sharper profit declines and a steeper ROIC erosion.
Intangible Assets vs. Diversified Technology: Which Moat Holds Stronger?
Both firms create value with ROIC exceeding WACC by 2%+, but Honeywell’s broader technology base cushions profit swings better. I see Honeywell’s moat as wider and more resilient, better positioned to defend market share in 2026.
Which stock offers better returns?
Over the past year, Honeywell International Inc. and 3M Company both showed strong price movements. Honeywell gained steadily with accelerating momentum, while 3M posted a substantial annual rise but slowed recently.
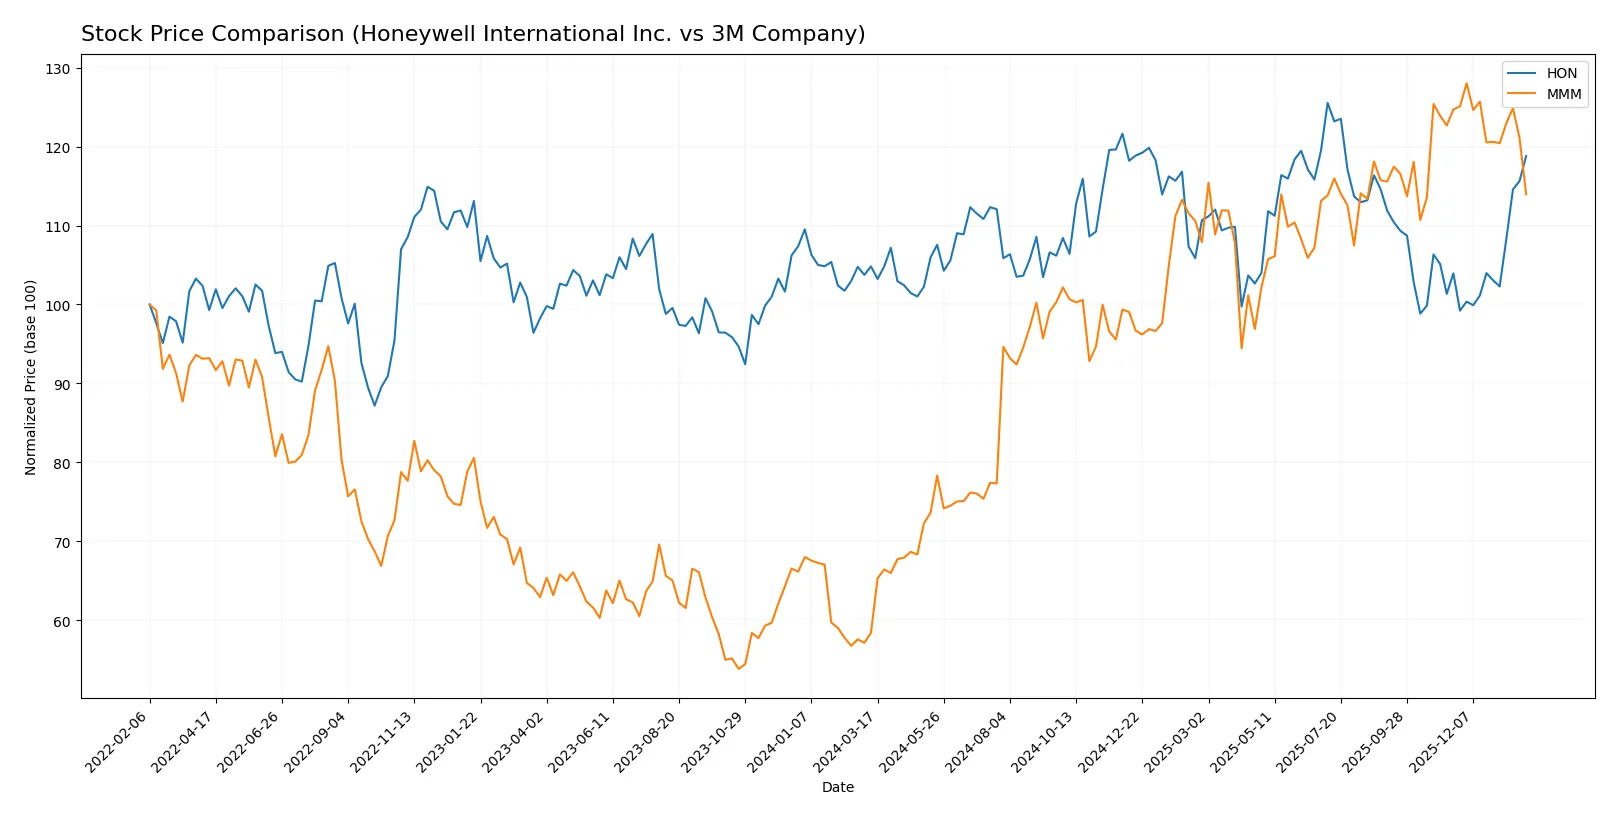
Trend Comparison
Honeywell’s stock rose 13.33% over the last 12 months, showing a bullish trend with accelerating price gains and a high of 240.4. Volumes increased, signaling strong buyer dominance recently.
3M’s stock surged 95.08% over the same period, marking a clear bullish trend but with deceleration. Recent months reversed, dropping 8.6%, alongside falling volumes and neutral buyer behavior.
3M outperformed Honeywell overall, despite recent weakness. Honeywell’s steady acceleration contrasts with 3M’s sharp gains followed by a pullback.
Target Prices
Analysts present a moderately bullish consensus for Honeywell International and 3M Company.
| Company | Target Low | Target High | Consensus |
|---|---|---|---|
| Honeywell International Inc. | 195 | 268 | 242.08 |
| 3M Company | 136 | 190 | 169.5 |
Honeywell’s consensus target sits about 6% above its current 227.52 price, suggesting modest upside. Meanwhile, 3M’s target consensus exceeds its 153.16 price by roughly 11%, indicating stronger analyst optimism.

Don’t Let Luck Decide Your Entry Point
Optimize your entry points with our advanced ProRealTime indicators. You’ll get efficient buy signals with precise price targets for maximum performance. Start outperforming now!
How do institutions grade them?
This section compares the latest institutional grades for Honeywell International Inc. and 3M Company:
Honeywell International Inc. Grades
Below is a summary of recent grades assigned by major financial institutions to Honeywell International Inc.:
| Grading Company | Action | New Grade | Date |
|---|---|---|---|
| Citigroup | Maintain | Buy | 2026-01-30 |
| RBC Capital | Maintain | Outperform | 2026-01-30 |
| Barclays | Maintain | Overweight | 2026-01-30 |
| Wells Fargo | Maintain | Equal Weight | 2026-01-30 |
| JP Morgan | Maintain | Overweight | 2026-01-30 |
| JP Morgan | Upgrade | Overweight | 2026-01-16 |
| Citigroup | Maintain | Buy | 2026-01-12 |
| Wells Fargo | Maintain | Equal Weight | 2026-01-07 |
| Mizuho | Maintain | Outperform | 2026-01-05 |
| Barclays | Maintain | Overweight | 2025-12-24 |
3M Company Grades
The following table summarizes recent institutional grades for 3M Company from key financial firms:
| Grading Company | Action | New Grade | Date |
|---|---|---|---|
| Wells Fargo | Maintain | Overweight | 2026-01-21 |
| Morgan Stanley | Maintain | Equal Weight | 2026-01-21 |
| RBC Capital | Maintain | Underperform | 2026-01-21 |
| Citigroup | Maintain | Neutral | 2026-01-21 |
| Deutsche Bank | Maintain | Hold | 2026-01-21 |
| JP Morgan | Downgrade | Neutral | 2026-01-16 |
| Deutsche Bank | Downgrade | Hold | 2025-12-08 |
| Barclays | Maintain | Overweight | 2025-12-04 |
| UBS | Maintain | Buy | 2025-10-22 |
| RBC Capital | Maintain | Underperform | 2025-10-22 |
Which company has the best grades?
Honeywell International consistently receives higher grades, such as Buy and Outperform, from top-tier banks. 3M’s ratings show more mixed sentiment, including Underperform and Neutral. Honeywell’s stronger grades may attract more investor confidence.
Risks specific to each company
The following categories identify critical pressure points and systemic threats facing Honeywell International Inc. and 3M Company in the 2026 market environment:
1. Market & Competition
Honeywell International Inc.
- Diversified tech portfolio cushions against volatility but faces intense aerospace and industrial competition.
3M Company
- Broad industrial segments face pressure from innovation shifts and specialized rivals, challenging legacy products.
2. Capital Structure & Debt
Honeywell International Inc.
- Debt-to-equity ratio of 2.14 signals elevated leverage; interest coverage at 5.42 is comfortable but watchful.
3M Company
- Higher debt-to-equity at 2.73 raises financial risk; interest coverage of 6.91 is solid but leverage remains a concern.
3. Stock Volatility
Honeywell International Inc.
- Beta of 0.942 indicates below-market volatility, supporting steadier capital preservation.
3M Company
- Beta of 1.159 suggests above-market swings; investors face higher price fluctuations.
4. Regulatory & Legal
Honeywell International Inc.
- Aerospace and industrial segments exposed to strict safety and environmental regulations; potential compliance costs.
3M Company
- Ongoing litigation risks related to product safety and environmental issues could impact earnings unpredictably.
5. Supply Chain & Operations
Honeywell International Inc.
- Global operations risk supply disruptions but benefit from integrated manufacturing and automation capabilities.
3M Company
- Complex supply chains face raw material cost volatility and operational inefficiencies amid legacy system upgrades.
6. ESG & Climate Transition
Honeywell International Inc.
- Invests in low global-warming-potential materials, positioning well for regulatory shifts and green innovation.
3M Company
- ESG challenges persist with legacy chemical products; transition costs and reputational risks remain significant.
7. Geopolitical Exposure
Honeywell International Inc.
- Significant exposure to U.S. and allied defense markets; geopolitical tensions could disrupt aerospace demand.
3M Company
- Global footprint exposes 3M to trade tariffs and geopolitical instability, especially in emerging markets.
Which company shows a better risk-adjusted profile?
Honeywell’s most impactful risk is its elevated leverage amid a complex regulatory aerospace environment. For 3M, ongoing legal liabilities pose the greatest threat to stability. Despite similar overall financial health, Honeywell’s lower stock volatility and proactive ESG investments give it a superior risk-adjusted profile. Notably, Honeywell’s favorable interest coverage at 5.42 contrasts with 3M’s higher debt-to-equity ratio of 2.73, underscoring my caution about 3M’s financial leverage in a turbulent market.
Final Verdict: Which stock to choose?
Honeywell International Inc. wields unmatched operational efficiency and delivers solid returns on equity, making it a reliable cash generator. Its point of vigilance lies in a declining profitability trend and elevated leverage, which could pressure future growth. This company suits portfolios targeting steady income with moderate growth appetite.
3M Company commands a strategic moat through its diversified industrial footprint and strong return on invested capital above its cost of capital. It exhibits better balance sheet liquidity and a higher Piotroski score, reflecting relative financial resilience. 3M fits portfolios seeking growth at a reasonable price with a preference for stability.
If you prioritize consistent cash flow and operational efficiency, Honeywell International appears the compelling choice due to its robust income generation despite some leverage concerns. However, if you seek stronger financial stability and a wider economic moat, 3M offers better durability and balance sheet strength, commanding a premium in risk-conscious growth strategies.
Disclaimer: Investment carries a risk of loss of initial capital. The past performance is not a reliable indicator of future results. Be sure to understand risks before making an investment decision.
Go Further
I encourage you to read the complete analyses of Honeywell International Inc. and 3M Company to enhance your investment decisions: