Home > Analyses > Industrials > Comfort Systems USA, Inc.
Comfort Systems USA, Inc. powers the backbone of modern buildings by expertly integrating mechanical and electrical systems. As a dominant force in engineering and construction, it delivers HVAC, plumbing, electrical, and fire protection solutions with unmatched precision. Renowned for innovation and reliability, the company shapes how commercial and industrial facilities operate daily. The pressing question: does Comfort Systems’ robust market position and operational excellence justify its premium valuation in 2026?
Table of contents
Business Model & Company Overview
Comfort Systems USA, Inc. is a Houston-based leader in the Engineering & Construction sector, founded in 1917. It dominates the mechanical and electrical services market with a comprehensive ecosystem of HVAC, plumbing, electrical, and fire protection solutions. Its core mission integrates design, installation, renovation, and remote monitoring into a seamless service offering for commercial, industrial, and institutional clients.
The company’s revenue engine balances installation and maintenance services with advanced remote monitoring across Americas, Europe, and Asia. This blend drives stable, recurring cash flow from critical infrastructure projects and ongoing system management. Comfort Systems’ broad service scope and deep client relationships form a robust economic moat, positioning it as a cornerstone in building system innovation and reliability.
Financial Performance & Fundamental Metrics
I will analyze Comfort Systems USA, Inc.’s income statement, key financial ratios, and dividend payout policy to assess its core financial health and shareholder value.
Income Statement
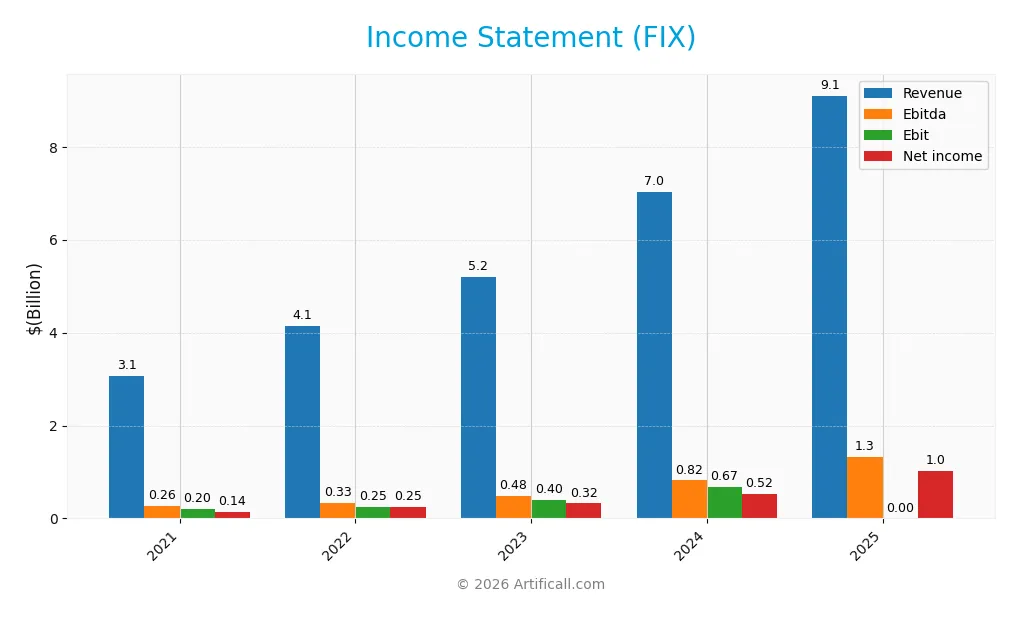
The table below presents Comfort Systems USA, Inc.’s key income statement metrics from 2021 to 2025 in USD, offering a clear view of its financial trajectory.
| 2021 | 2022 | 2023 | 2024 | 2025 | |
|---|---|---|---|---|---|
| Revenue | 3.07B | 4.14B | 5.21B | 7.03B | 9.10B |
| Cost of Revenue | 2.51B | 3.40B | 4.22B | 5.55B | 6.91B |
| Operating Expenses | 375M | 488M | 572M | 727M | 883M |
| Gross Profit | 563M | 742M | 991M | 1.48B | 2.20B |
| EBITDA | 264M | 329M | 479M | 817M | 1.31B |
| EBIT | 195M | 248M | 397M | 672M | N/A |
| Interest Expense | 5.70M | 13.68M | 10.28M | 6.65M | 9.01M |
| Net Income | 143M | 246M | 323M | 522M | 1.02B |
| EPS | 3.95 | 6.84 | 9.03 | 14.64 | 28.93 |
| Filing Date | 2022-02-23 | 2023-02-22 | 2024-02-22 | 2025-02-20 | 2026-02-19 |
Income Statement Evolution
From 2021 to 2025, Comfort Systems USA, Inc. posted strong revenue growth, rising 196% overall. Net income surged even faster, by 613%, reflecting improved operational efficiency. Gross margins expanded to 24.1%, signaling better cost control, while net margins climbed significantly to 11.2%. Despite a zero EBIT margin in 2025, other profitability metrics showed positive momentum.
Is the Income Statement Favorable?
In 2025, the company achieved $9.1B revenue and $1.02B net income, marking a 30% and 51% increase year-over-year respectively. The gross margin at 24.1% and net margin at 11.2% remain favorable. However, EBIT margin dropped to zero, an unfavorable sign. Interest expense is minimal and manageable. Overall, fundamentals appear broadly favorable with notable margin and earnings growth.
Financial Ratios
The following table summarizes key financial ratios for Comfort Systems USA, Inc. over recent fiscal years, providing insight into profitability, liquidity, leverage, and valuation metrics:
| Ratios | 2021 | 2022 | 2023 | 2024 | 2025 |
|---|---|---|---|---|---|
| Net Margin | 4.7% | 5.9% | 6.2% | 7.4% | 11.2% |
| ROE | 17.8% | 24.6% | 25.3% | 30.6% | 41.8% |
| ROIC | 10.2% | 17.4% | 21.6% | 27.2% | 34.0% |
| P/E | 25.0 | 16.8 | 22.8 | 29.0 | 32.3 |
| P/B | 4.5 | 4.1 | 5.8 | 8.9 | 13.5 |
| Current Ratio | 1.23 | 1.12 | 1.11 | 1.08 | 1.21 |
| Quick Ratio | 1.20 | 1.09 | 1.07 | 1.06 | 1.19 |
| D/E | 0.64 | 0.39 | 0.20 | 0.18 | 0.18 |
| Debt-to-Assets | 23.3% | 15.0% | 7.8% | 6.6% | 7.0% |
| Interest Coverage | 33.1 | 18.6 | 40.7 | 112.7 | -145.9 |
| Asset Turnover | 1.39 | 1.59 | 1.58 | 1.49 | 1.41 |
| Fixed Asset Turnover | 12.1 | 15.1 | 12.6 | 13.9 | 12.8 |
| Dividend Yield | 0.48% | 0.49% | 0.41% | 0.28% | 0.21% |
Evolution of Financial Ratios
Comfort Systems USA, Inc. (FIX) exhibits a strong upward trend in Return on Equity, rising from 17.79% in 2021 to 41.76% in 2025. The Current Ratio shows moderate improvement, moving from 1.23 to 1.21, indicating stable liquidity. Meanwhile, the Debt-to-Equity Ratio significantly decreased from 0.64 in 2021 to 0.18 in 2025, reflecting reduced leverage and improved solvency.
Are the Financial Ratios Favorable?
In 2025, FIX demonstrates favorable profitability with an 11.23% net margin and a 34.04% ROIC well above the 11.45% WACC, signaling efficient capital use. Liquidity appears stable with a neutral current ratio at 1.21 and a favorable quick ratio of 1.19. Leverage metrics, including a 0.18 debt-to-equity ratio and 6.95% debt-to-assets, are positive. However, valuation multiples like P/E at 32.26 and P/B at 13.47, and a negative interest coverage ratio pose concerns. Overall, 57.14% of key ratios are favorable.
Shareholder Return Policy
Comfort Systems USA, Inc. maintains a low dividend payout ratio around 6-12%, with a steadily rising dividend per share reaching $1.95 in 2025. The dividend yield remains modest near 0.2%, supported by free cash flow coverage and occasional share buybacks.
This disciplined policy balances shareholder returns with capital expenditure needs. The conservative payout and buybacks suggest sustainable long-term value creation, minimizing risks from over-distribution or excessive leverage.
Score analysis
The following radar chart illustrates Comfort Systems USA, Inc.’s key financial metric scores for a balanced overview:
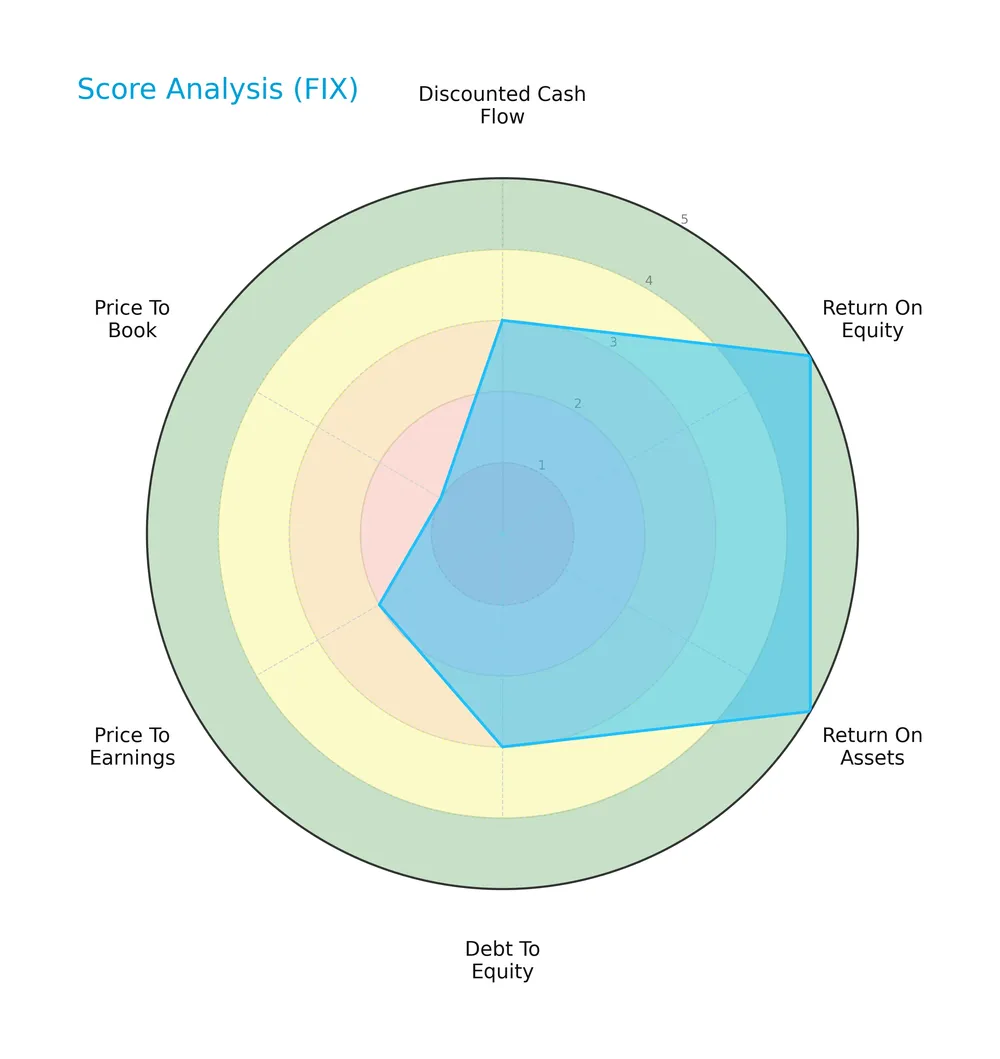
The company scores very favorably on return on equity and assets, indicating efficient profitability. Debt-to-equity and discounted cash flow scores are moderate, suggesting average leverage and valuation. Price-to-earnings and price-to-book ratios are unfavorable, signaling potential valuation concerns.
Analysis of the company’s bankruptcy risk
Comfort Systems USA, Inc. is firmly in the safe zone according to its Altman Z-Score, indicating a very low risk of bankruptcy:

Is the company in good financial health?
The Piotroski Score diagram highlights strong financial health with a high score of 8 out of 9:

This score reflects robust profitability, liquidity, and operational efficiency, signaling the company’s solid fundamentals and financial resilience.
Competitive Landscape & Sector Positioning
This analysis explores Comfort Systems USA, Inc.’s strategic positioning, revenue segments, key products, and main competitors. I will assess whether the company holds a sustainable competitive advantage within the engineering and construction sector.
Strategic Positioning
Comfort Systems USA concentrates on mechanical and electrical services across commercial, industrial, and institutional sectors in the US. Its portfolio focuses on HVAC, plumbing, electrical, and controls, with mechanical services consistently generating nearly triple the revenue of electrical, showing a clear product concentration rather than diversification.
Revenue by Segment
This pie chart depicts Comfort Systems USA, Inc.’s revenue distribution by segment for the fiscal year 2025, highlighting the company’s core business drivers.
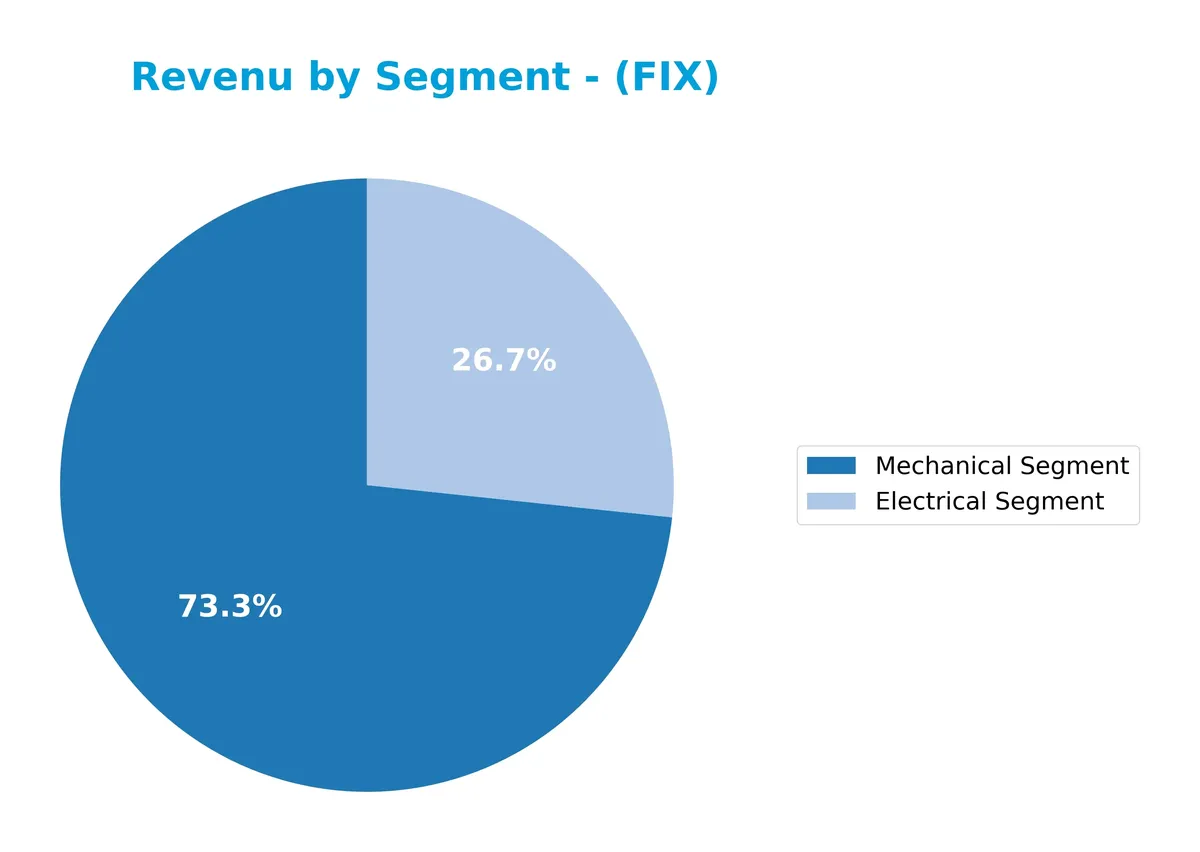
Mechanical Segment dominates with $6.7B revenue in 2025, showing strong growth from $5.5B in 2024. Electrical Segment also accelerated, reaching $2.4B, up from $1.5B last year. The company’s reliance on Mechanical services deepened, signaling concentration risk but also a robust market position. This trend reflects Comfort Systems’ focus on its moat in mechanical infrastructure services, capitalizing on steady demand and scale advantages.
Key Products & Brands
Comfort Systems USA’s key offerings span mechanical and electrical services, supporting diverse building systems and controls:
| Product | Description |
|---|---|
| Mechanical Segment | Installation, renovation, maintenance, repair, and replacement of HVAC, plumbing, piping, and controls. |
| Electrical Segment | Electrical installation, renovation, maintenance, and fire protection services. |
| Heating, Ventilation, and Air Conditioning (HVAC) | Systems design, engineering, and integration for new and existing buildings. |
| Plumbing | Plumbing system installation and maintenance within commercial, industrial, and institutional sectors. |
| Building Automation Control Systems | Remote monitoring and control of power usage, temperature, pressure, humidity, and airflow. |
| Off-site Construction & Monitoring | Prefabrication and remote system monitoring services linked to mechanical and electrical systems. |
Comfort Systems USA focuses on comprehensive MEP (mechanical, electrical, plumbing) solutions. Its services cover new building projects and existing building upgrades, with a growing emphasis on automation and remote monitoring systems.
Main Competitors
There are 3 competitors in the Industrials sector, with the table listing the top 3 leaders by market capitalization:
| Competitor | Market Cap. |
|---|---|
| Quanta Services, Inc. | 65.2B |
| Comfort Systems USA, Inc. | 35.4B |
| EMCOR Group, Inc. | 28.6B |
Comfort Systems USA, Inc. ranks 2nd among its 3 main competitors. It holds roughly 79% of the market cap of leader Quanta Services, Inc. The company is positioned above both the average market cap of the top 10 and the median of its sector. Its market cap exceeds the next competitor below by over 80%, highlighting a significant gap.
Comparisons with competitors
Check out how we compare the company to its competitors:
Does FIX have a competitive advantage?
Comfort Systems USA, Inc. demonstrates a sustainable competitive advantage, evidenced by a very favorable moat rating and an ROIC exceeding WACC by over 22%, signaling consistent value creation. The company’s growing ROIC trend confirms improving capital efficiency and rising profitability over 2021-2025.
Looking ahead, Comfort Systems USA plans to leverage opportunities in mechanical and electrical services, including remote monitoring and off-site construction. Expansion in commercial and institutional markets supports a positive outlook for new product integration and geographic growth.
SWOT Analysis
This SWOT analysis highlights key internal and external factors shaping Comfort Systems USA, Inc.’s strategic position.
Strengths
- Strong ROIC well above WACC
- Robust net margin of 11.23%
- Growing revenue and earnings over 5 years
Weaknesses
- High PE and PB ratios signal premium valuation
- EBIT margin currently zero, pressuring profitability
- Low dividend yield limits income appeal
Opportunities
- Expansion in industrial and commercial MEP markets
- Increasing demand for energy-efficient building systems
- Technological advances in remote monitoring services
Threats
- Competitive pressure in engineering and construction
- Economic cycles impacting construction spending
- Rising costs may squeeze margins further
Overall, Comfort Systems maintains a very favorable moat with strong profitability and growth. However, elevated valuation multiples and thin EBIT margins require cautious monitoring. The company should leverage market demand and innovation while managing cost and competitive risks prudently.
Stock Price Action Analysis
The weekly stock chart of Comfort Systems USA, Inc. (FIX) highlights a strong upward momentum with significant price fluctuations over the past 100 weeks:
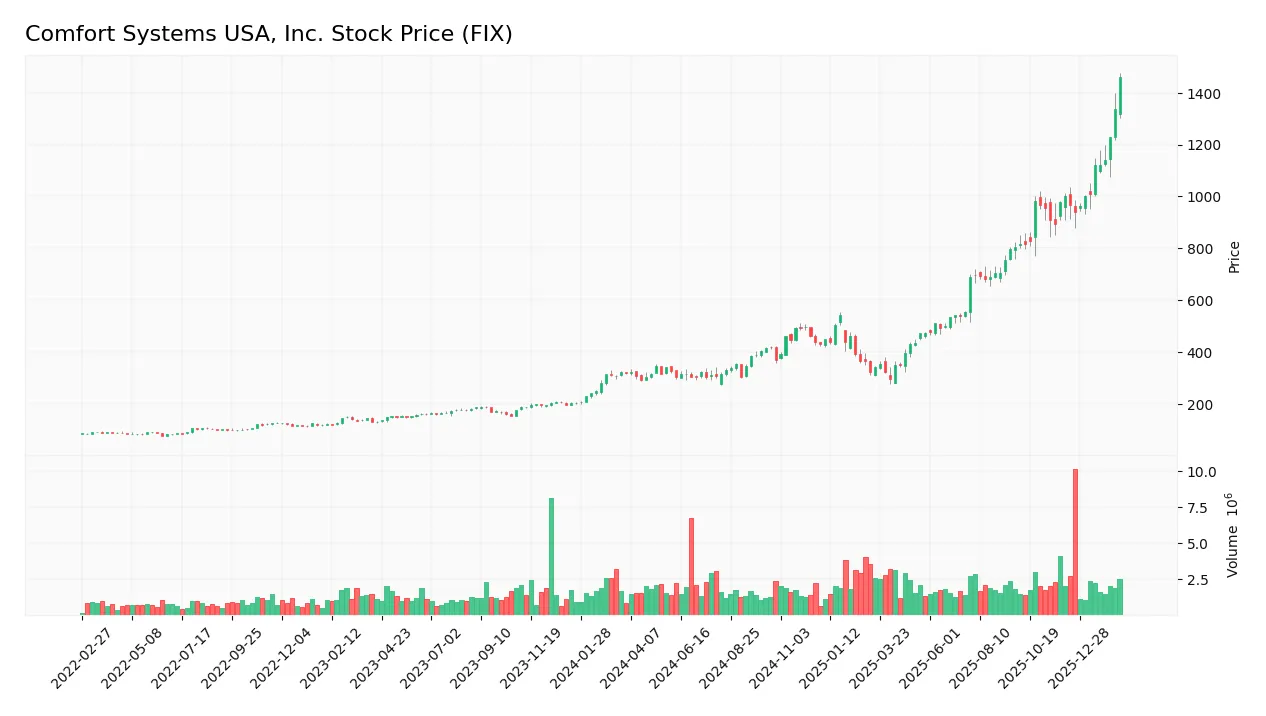
Trend Analysis
Over the past 100 weeks, FIX’s stock price surged by 360.24%, signaling a pronounced bullish trend. The price accelerated with a high volatility level, reflected by a 276.45 standard deviation. The stock’s range spans from a low of 290.73 to a peak of 1462.23, confirming robust upward momentum.
Volume Analysis
Trading volume shows a clear buyer-driven pattern, with buyers accounting for 58.39% of total volume (248.8M shares) and an increasing volume trend. In the recent 11-week period, buyer dominance remains stable at 58.89%, suggesting sustained investor confidence and active market participation.
Target Prices
Analysts show a bullish consensus on Comfort Systems USA, Inc., reflecting strong confidence in its growth potential.
| Target Low | Target High | Consensus |
|---|---|---|
| 1,196 | 1,310 | 1,235.33 |
The target range suggests upside potential of approximately 5-10% from current levels, signaling positive market expectations.

Don’t Let Luck Decide Your Entry Point
Optimize your entry points with our advanced ProRealTime indicators. You’ll get efficient buy signals with precise price targets for maximum performance. Start outperforming now!
Analyst & Consumer Opinions
This section examines Comfort Systems USA, Inc.’s analyst ratings alongside consumer feedback and satisfaction metrics.
Stock Grades
The latest verified analyst grades for Comfort Systems USA, Inc. reveal a consistent outlook across multiple firms:
| Grading Company | Action | New Grade | Date |
|---|---|---|---|
| Stifel | Maintain | Buy | 2026-01-26 |
| DA Davidson | Maintain | Buy | 2025-12-19 |
| Stifel | Maintain | Buy | 2025-12-16 |
| UBS | Maintain | Buy | 2025-10-27 |
| Stifel | Maintain | Buy | 2025-10-13 |
| UBS | Maintain | Buy | 2025-09-15 |
| DA Davidson | Maintain | Buy | 2025-07-28 |
| UBS | Maintain | Buy | 2025-07-25 |
| Stifel | Maintain | Buy | 2025-07-11 |
| DA Davidson | Maintain | Buy | 2025-06-30 |
All grades remain Buy with no downgrades or upgrades. Despite this bullish stance, the consensus leans towards Hold, reflecting some market caution.
Consumer Opinions
Consumer sentiment around Comfort Systems USA, Inc. (FIX) reflects a mix of satisfaction and areas for improvement. Here’s what customers are saying:
| Positive Reviews | Negative Reviews |
|---|---|
| Reliable and timely service delivery. | Occasional delays in customer support. |
| Skilled technicians with professional conduct. | Pricing perceived as slightly high. |
| Strong focus on safety and compliance. | Communication lapses during project updates. |
Overall, consumers praise FIX for professionalism and reliability, especially valuing safety standards. However, recurring concerns about communication and pricing suggest room for enhancing customer experience.
Risk Analysis
The following table outlines key risks facing Comfort Systems USA, Inc., highlighting likelihood and potential impact:
| Category | Description | Probability | Impact |
|---|---|---|---|
| Market Volatility | High beta (1.668) indicates sensitivity to market swings, raising share price risk. | Medium | Medium |
| Valuation Risk | Elevated P/E (32.26) and P/B (13.47) ratios suggest potential overvaluation. | High | High |
| Interest Coverage | Negative interest coverage ratio signals vulnerability to rising interest rates. | Medium | High |
| Dividend Yield | Low dividend yield (0.21%) may disappoint income-focused investors. | Low | Low |
| Operational Risk | Dependence on commercial and industrial MEP markets exposes to economic cycles. | Medium | Medium |
I consider valuation risk the most pressing. The premium multiples exceed typical Industrials benchmarks, signaling stretched investor expectations. The negative interest coverage is a critical red flag, indicating potential difficulties covering debt costs if rates rise. Market volatility also elevates short-term price swings. Prudence demands monitoring these risks closely.
Should You Buy Comfort Systems USA, Inc.?
Comfort Systems USA, Inc. appears to be a robustly profitable company with a very favorable, durable moat supported by a growing ROIC well above WACC. Despite moderate leverage and mixed valuation metrics, its overall B+ rating suggests strong operational efficiency and value creation potential.
Strength & Efficiency Pillars
Comfort Systems USA, Inc. exhibits solid operational efficiency, with a net margin of 11.23% and a robust return on equity of 41.76%. Its return on invested capital stands at 34.04%, well above the weighted average cost of capital at 11.45%, confirming the company as a clear value creator. This favorable moat, combined with growing ROIC trends, signals sustainable competitive advantages and strong profitability expansion over recent years.
Weaknesses and Drawbacks
Despite operational strengths, valuation metrics raise caution. The price-to-earnings ratio at 32.26 and price-to-book ratio at 13.47 indicate a premium market valuation that may limit upside. The current ratio of 1.21 is neutral but suggests modest liquidity buffer. Interest coverage is notably unfavorable at -0.0, signaling potential difficulties in servicing debt costs. Investors should weigh these factors amid rising market expectations.
Our Final Verdict about Comfort Systems USA, Inc.
The company delivers a fundamentally attractive profile with a very strong Piotroski score of 8 and a safe Altman Z-Score of 10.52, indicating low solvency risk. Its bullish long-term trend and buyer dominance of 58.89% support potential appreciation. However, premium valuation ratios counsel a cautious stance, suggesting the stock might appear better suited for investors with a high risk tolerance or as a longer-term opportunity.
Disclaimer: This content is for informational purposes only and does not constitute financial, investment, or other professional advice. Investing in financial markets involves a significant risk of loss, and past performance is not indicative of future results.
Additional Resources
- Comfort Systems USA (FIX) Reports Record Earnings and Backlog Gr – GuruFocus (Feb 21, 2026)
- Comfort Systems USA outlines plans to grow modular capacity to 4M sq. ft. amid strong technology sector demand – MSN (Feb 20, 2026)
- Live: Comfort Systems Reports Earnings Tonight After 65% Rally – 24/7 Wall St. (Feb 19, 2026)
- Why Comfort Systems (FIX) Stock Is Up Today – Finviz (Feb 20, 2026)
- Shareholders get $0.70: Comfort Systems USA boosts dividend $0.10 a share – Stock Titan (Feb 19, 2026)
For more information about Comfort Systems USA, Inc., please visit the official website: comfortsystemsusa.com