Home > Analyses > Communication Services > Comcast Corporation
Comcast powers the entertainment and connectivity of millions daily, weaving technology with storytelling across multiple platforms. It commands the telecommunications and media landscape through its Xfinity broadband services, NBCUniversal’s content empire, and global theme parks. Known for innovation and scale, Comcast shapes how consumers access content and communication worldwide. As competition intensifies, I ask: does Comcast’s robust foundation still support its current valuation and promise for future growth?

Table of contents
Business Model & Company Overview
Comcast Corporation, founded in 1963 and headquartered in Philadelphia, stands as a dominant force in the telecommunications services sector. It operates a vast ecosystem spanning Cable Communications, Media, Studios, Theme Parks, and Sky segments. This integrated portfolio delivers broadband, video, voice, wireless, and entertainment content under brands like Xfinity and NBCUniversal, creating a unified experience for consumers and businesses worldwide.
Comcast’s revenue engine balances recurring subscription services with high-margin advertising and content distribution. Its global footprint extends across the Americas, Europe, and Asia, notably through its Sky segment and Universal theme parks. The company’s ability to blend hardware, software, and media content fuels a competitive advantage that shapes the future of communication and entertainment industries.
Financial Performance & Fundamental Metrics
I will analyze Comcast Corporation’s income statement, key financial ratios, and dividend payout policy to assess its operational efficiency and shareholder returns.
Income Statement
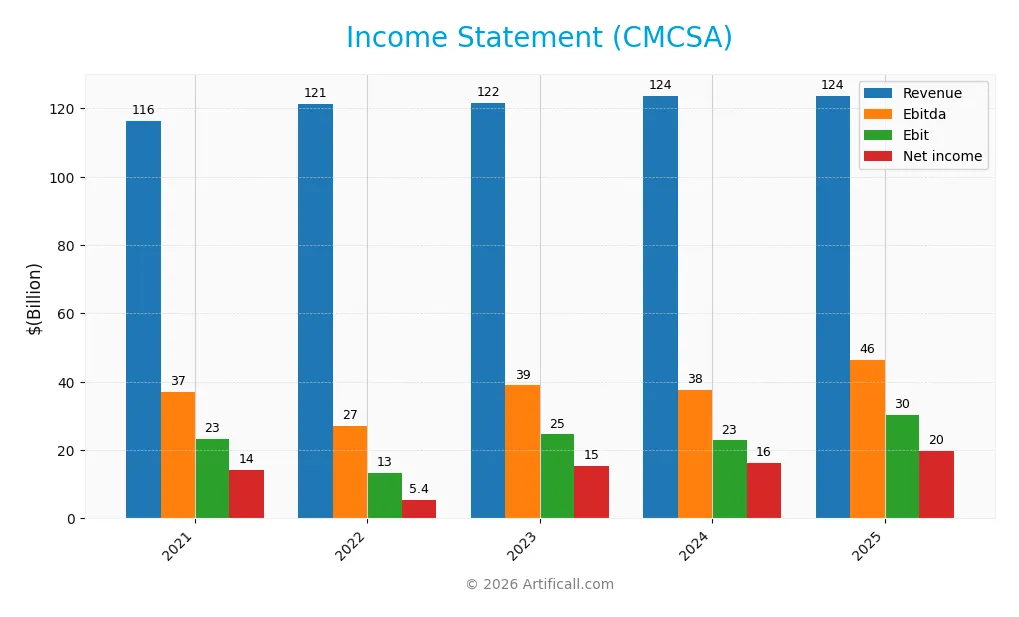
The table below summarizes Comcast Corporation’s key income statement items for fiscal years 2021 through 2025, reflecting revenue, expenses, and profitability metrics.
| 2021 | 2022 | 2023 | 2024 | 2025 | |
|---|---|---|---|---|---|
| Revenue | 116.4B | 121.4B | 121.6B | 123.7B | 123.7B |
| Cost of Revenue | 52.3B | 52.0B | 51.1B | 51.8B | 49.4B |
| Operating Expenses | 43.3B | 46.8B | 47.2B | 48.6B | 53.6B |
| Gross Profit | 64.1B | 69.4B | 70.5B | 71.9B | 74.3B |
| EBITDA | 37.0B | 27.0B | 38.9B | 37.6B | 46.4B |
| EBIT | 23.2B | 13.2B | 24.6B | 22.8B | 30.2B |
| Interest Expense | 4.3B | 3.9B | 4.1B | 4.1B | 4.4B |
| Net Income | 14.2B | 5.4B | 15.4B | 16.2B | 19.8B |
| EPS | 3.09 | 1.22 | 3.73 | 4.17 | 5.41 |
| Filing Date | 2022-02-02 | 2023-02-03 | 2024-01-31 | 2025-01-31 | 2026-02-03 |
Income Statement Evolution
From 2021 to 2025, Comcast’s revenue grew modestly by 6.3%, with a slight 0.02% decline in the latest year. Net income increased strongly by nearly 40% over this period. Gross margin remained stable around 60%, while net margin improved significantly to 16%, reflecting better profitability and margin expansion.
Is the Income Statement Favorable?
In 2025, Comcast reported revenue of $124B, nearly flat year-over-year, but net income surged 22% to $20B. EBIT grew 32%, driving margin improvements. Interest expense stayed low at 3.6% of revenue, supporting solid earnings growth. Overall, fundamentals appear favorable, with strong profitability gains despite stagnant revenue.
Financial Ratios
The following table presents key financial ratios for Comcast Corporation over the last five fiscal years, providing insight into profitability, liquidity, leverage, and market valuation:
| Ratios | 2021 | 2022 | 2023 | 2024 | 2025 |
|---|---|---|---|---|---|
| Net Margin | 12.2% | 4.4% | 12.7% | 13.1% | 16.0% |
| ROE | 14.7% | 6.6% | 18.6% | 18.9% | 20.4% |
| ROIC | 6.1% | 5.2% | 7.6% | 8.6% | 9.9% |
| P/E | 16.3 | 28.7 | 11.7 | 9.1 | 5.1 |
| P/B | 2.40 | 1.90 | 2.19 | 1.71 | 1.05 |
| Current Ratio | 0.85 | 0.78 | 0.60 | 0.68 | 0.88 |
| Quick Ratio | 0.85 | 0.78 | 0.60 | 0.68 | 0.88 |
| D/E | 1.04 | 1.24 | 1.17 | 1.16 | 0.06 |
| Debt-to-Assets | 36.3% | 38.9% | 36.7% | 37.2% | 3.2% |
| Interest Coverage | 4.9x | 5.8x | 5.7x | 5.6x | 4.7x |
| Asset Turnover | 0.42 | 0.47 | 0.46 | 0.46 | 0.66 |
| Fixed Asset Turnover | 2.15 | 2.19 | 2.04 | 1.98 | 1.88 |
| Dividend Yield | 1.96% | 3.08% | 2.64% | 3.28% | 4.81% |
Evolution of Financial Ratios
From 2021 to 2025, Comcast’s Return on Equity (ROE) rose steadily from 14.7% to 20.4%, indicating improving profitability. The Current Ratio increased from 0.60 in 2023 to 0.88 in 2025, signaling modest liquidity gains but remaining below the ideal threshold. The Debt-to-Equity Ratio sharply declined from above 1.1 to 0.06 in 2025, reflecting substantial deleveraging and a stronger balance sheet.
Are the Financial Ratios Fovorable?
In 2025, Comcast’s profitability ratios like net margin (16.0%) and ROE (20.4%) are favorable, surpassing industry norms. The low Debt-to-Equity Ratio (0.06) and interest coverage (6.84) highlight conservative leverage and solid debt servicing capacity. Liquidity ratios present a mixed picture: the Current Ratio (0.88) is unfavorable, yet the Quick Ratio (0.88) is neutral. Overall, 64% of key ratios are favorable, supporting a generally positive financial profile.
Shareholder Return Policy
Comcast maintains a dividend payout ratio near 25%, with dividends per share rising steadily to $1.35 in 2025, supporting a healthy 4.8% yield. The dividend is well covered by free cash flow, with a dividend plus capex coverage ratio above 2, while consistent share buybacks supplement returns.
This disciplined distribution approach balances shareholder income and reinvestment, enhancing sustainable long-term value. The moderate payout and capital allocation reflect prudent risk management amid evolving market dynamics and capital needs.
Score analysis
The radar chart below summarizes Comcast Corporation’s key financial scores across valuation, profitability, and leverage metrics:
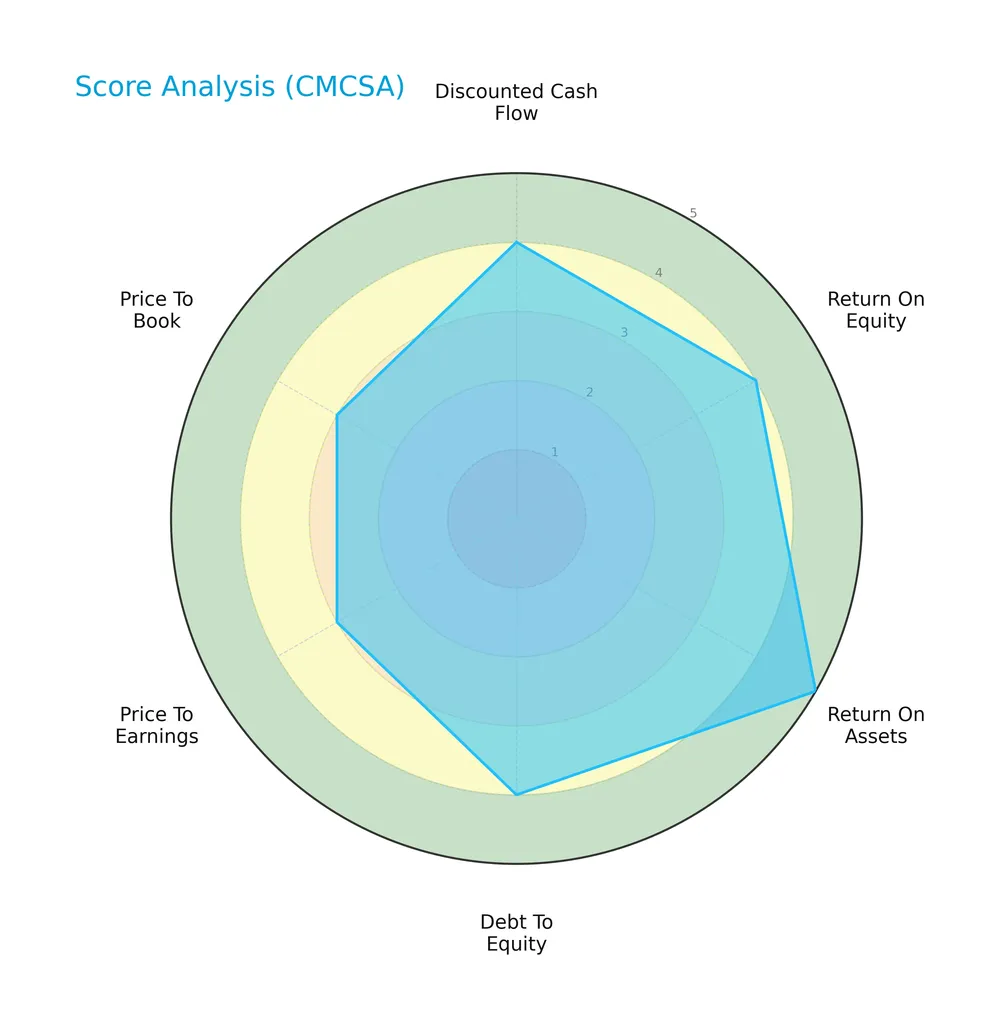
Comcast scores favorably on discounted cash flow, ROE, and debt-to-equity ratios, with a very favorable return on assets. Valuation multiples like P/E and P/B show moderate scores, indicating cautious market pricing.
Analysis of the company’s bankruptcy risk
Comcast’s Altman Z-Score places it in the grey zone, signaling a moderate probability of financial distress and bankruptcy risk:

Is the company in good financial health?
The Piotroski Score diagram illustrates Comcast’s strong financial health based on profitability, leverage, liquidity, and operational efficiency:

A perfect Piotroski score of 9 confirms Comcast’s very strong financial condition, reflecting robust fundamentals and effective management execution.
Competitive Landscape & Sector Positioning
This sector analysis examines Comcast Corporation’s strategic positioning, revenue by segment, key products, and main competitors. I will assess whether Comcast holds a competitive advantage over its industry peers.
Strategic Positioning
Comcast maintains a diversified product portfolio spanning Cable Communications, Media, Studios, Theme Parks, and Sky segments. Its geographic exposure is concentrated primarily in the U.S. with 95B in 2025 revenue, complemented by significant operations in Europe (15B) and other regions (13B), reflecting a balanced global footprint.
Revenue by Segment
This pie chart illustrates Comcast Corporation’s revenue distribution by segment for the fiscal year 2025, highlighting the business’s diverse income sources.
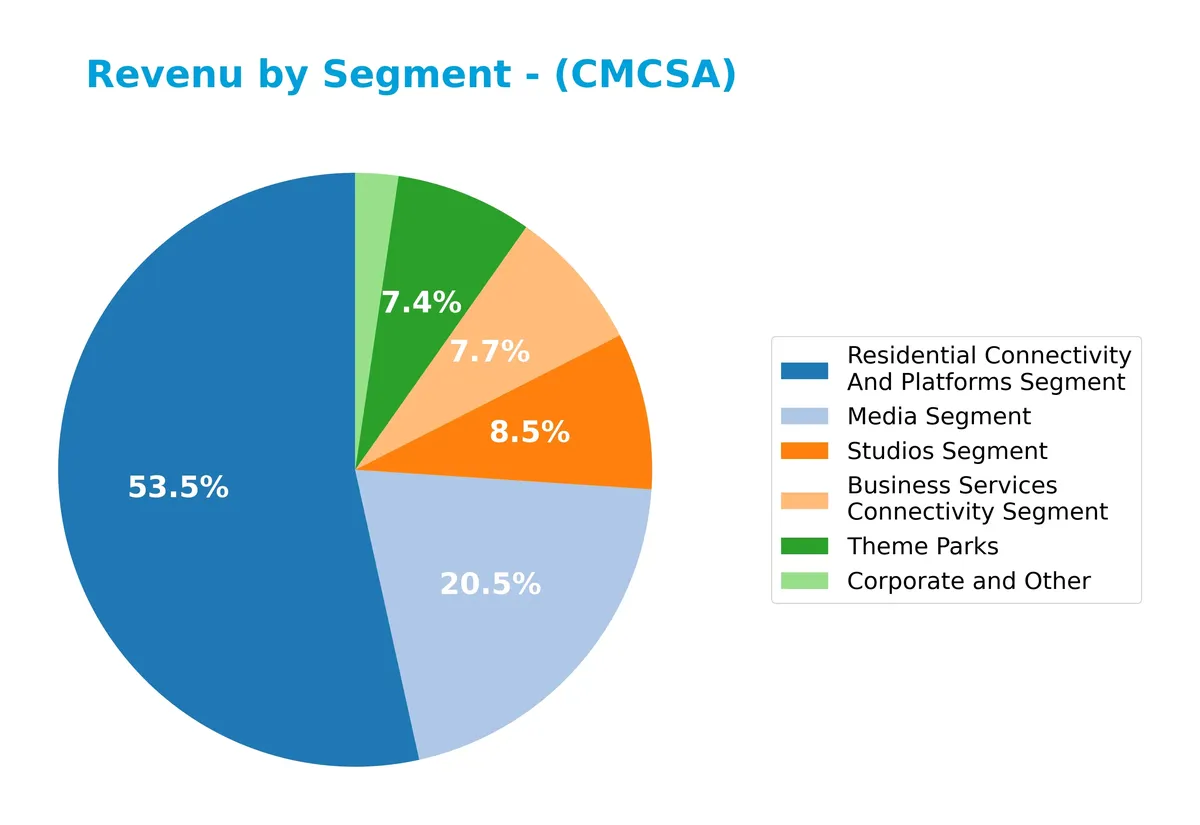
In 2025, Residential Connectivity and Platforms dominate with $70.7B, reflecting steady demand in consumer broadband. Media segment revenue declined slightly to $27.1B, signaling challenges in traditional content. Business Services Connectivity and Studios each contribute over $10B, indicating solid enterprise and content production streams. Theme Parks remain significant at $9.8B, showing resilience post-pandemic. The overall mix suggests Comcast relies on connectivity while diversifying across media and entertainment.
Key Products & Brands
Comcast’s key products and brands span multiple media, connectivity, and entertainment segments:
| Product | Description |
|---|---|
| Xfinity | Offers broadband, video, voice, wireless, and advertising services to residential and business customers. |
| NBCUniversal Media | Operates national, regional, and international cable networks, NBC and Telemundo broadcast, and Peacock streaming. |
| Studios | Produces and distributes film and television content under NBCUniversal. |
| Theme Parks | Runs Universal theme parks in Orlando, Hollywood, Osaka, and Beijing. |
| Sky | Provides direct-to-consumer video, broadband, voice, wireless services, and operates Sky News and Sky Sports. |
| Philadelphia Flyers & Wells Fargo Center | Owns the NHL team and the sports arena in Philadelphia. |
Comcast’s diversified portfolio integrates media content, connectivity, and live entertainment, generating substantial revenue across these distinct but complementary segments.
Main Competitors
There are 5 main competitors in the Telecommunications Services industry; here are the top 10 leaders by market capitalization:
| Competitor | Market Cap. |
|---|---|
| T-Mobile US, Inc. | 223.3B |
| AT&T Inc. | 174.0B |
| Verizon Communications Inc. | 170.8B |
| Comcast Corporation | 107.6B |
| Charter Communications, Inc. | 29.1B |
Comcast Corporation ranks 4th among its competitors with a market cap roughly 50% of the leader, T-Mobile US. Its capitalization sits below both the average market cap of the top 10 (141B) and the median of the sector (171B). Comcast maintains a 53.4% gap below the next competitor above, signaling a significant scale difference within the peer group.
Comparisons with competitors
Check out how we compare the company to its competitors:
Does CMCSA have a competitive advantage?
Comcast Corporation demonstrates a sustainable competitive advantage, with a ROIC exceeding WACC by 4.6% and a strong upward trend in profitability from 2021 to 2025. Its diversified operations in cable, media, studios, theme parks, and international markets contribute to steady value creation.
Looking ahead, Comcast’s broad portfolio, including streaming services like Peacock and expansion in global markets such as Europe and Asia, positions it to capitalize on emerging growth opportunities. Continued investment in technology and content could further strengthen its competitive moat.
SWOT Analysis
This SWOT analysis highlights Comcast’s key internal strengths and weaknesses, alongside external opportunities and threats shaping its strategic outlook.
Strengths
- strong market position in US telecommunications
- diversified revenue streams including media and theme parks
- favorable profitability metrics with 16% net margin
Weaknesses
- current ratio below 1 signals liquidity risk
- modest revenue growth recently
- reliance on mature US market limits rapid expansion
Opportunities
- expansion in international markets, especially Europe
- growth potential in streaming services like Peacock
- leveraging technology upgrades for broadband services
Threats
- intensifying competition in streaming and broadband
- regulatory pressures in communications sector
- economic downturn affecting consumer spending
Comcast’s robust profitability and diversified segments provide a solid foundation. However, liquidity constraints and slow revenue growth require cautious capital management. Strategic focus on international growth and streaming innovation will be critical to offset competitive and regulatory challenges.
Stock Price Action Analysis
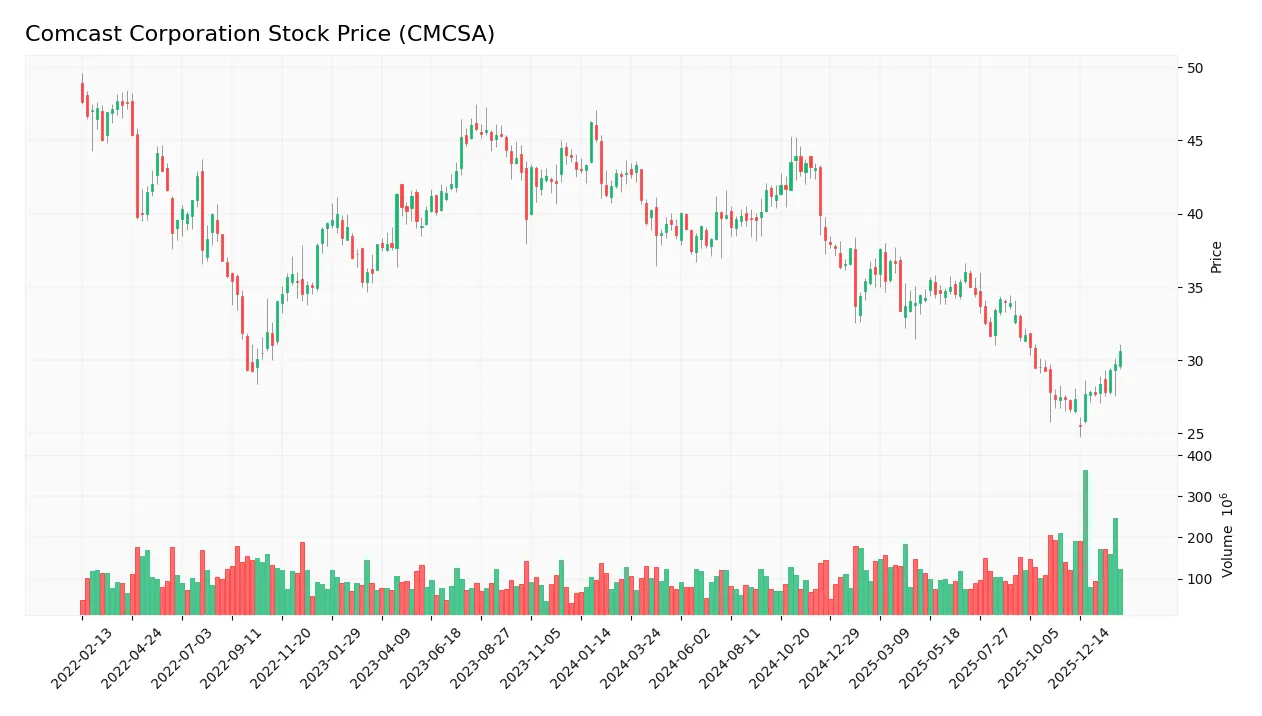
The weekly stock chart below illustrates Comcast Corporation’s price movements over the past 100 weeks, highlighting key volatility and trend shifts:
Trend Analysis
Over the past 12 months, Comcast’s stock price declined by 28.37%, signaling a clear bearish trend. The price dropped from a high of 43.91 to a low of 25.51, with an accelerating downward momentum. The standard deviation of 4.74 indicates notable volatility during this period.
Volume Analysis
Trading volume shows an increasing trend with a slight seller dominance overall (51.09%). However, in the recent three months, buyers dominate with 65.05% volume share, indicating growing bullish participation and heightened market interest in this stock.
Target Prices
Analysts set a consensus target price reflecting moderate upside potential for Comcast Corporation.
| Target Low | Target High | Consensus |
|---|---|---|
| 23 | 40 | 32.71 |
The target range indicates cautious optimism, with a consensus price suggesting a roughly 10-15% appreciation from current levels.

Don’t Let Luck Decide Your Entry Point
Optimize your entry points with our advanced ProRealTime indicators. You’ll get efficient buy signals with precise price targets for maximum performance. Start outperforming now!
Analyst & Consumer Opinions
This section examines Comcast Corporation’s analyst ratings and consumer feedback to gauge market sentiment and user experience.
Stock Grades
Here is the latest comprehensive overview of Comcast Corporation’s stock grades from established financial firms:
| Grading Company | Action | New Grade | Date |
|---|---|---|---|
| Rosenblatt | Maintain | Neutral | 2026-01-30 |
| TD Cowen | Maintain | Buy | 2026-01-30 |
| Citigroup | Maintain | Buy | 2026-01-30 |
| Scotiabank | Maintain | Sector Perform | 2026-01-30 |
| Bernstein | Maintain | Market Perform | 2026-01-16 |
| Barclays | Maintain | Equal Weight | 2026-01-13 |
| B of A Securities | Upgrade | Buy | 2026-01-12 |
| Benchmark | Maintain | Buy | 2026-01-06 |
| Morgan Stanley | Maintain | Equal Weight | 2025-12-10 |
| Rosenblatt | Maintain | Neutral | 2025-12-01 |
The consensus shows a steady bias toward Buy ratings, with key upgrades and no downgrades in recent months. Most firms maintain a neutral to positive stance, reflecting cautious optimism about Comcast’s prospects.
Consumer Opinions
Consumers express mixed emotions about Comcast Corporation, reflecting both satisfaction and frustration.
| Positive Reviews | Negative Reviews |
|---|---|
| Reliable high-speed internet with consistent uptime. | Customer service response times are often slow. |
| Wide variety of channel options and streaming features. | Pricing feels high compared to competitors. |
| Easy-to-use Xfinity app enhances user experience. | Frequent billing errors cause inconvenience. |
Overall, customers appreciate Comcast’s strong network reliability and user-friendly technology. However, complaints about customer support delays and pricing persist as notable pain points.
Risk Analysis
Below is a summary of key risks facing Comcast Corporation, including their likelihood and potential impact on the company’s financial health:
| Category | Description | Probability | Impact |
|---|---|---|---|
| Liquidity Risk | Current ratio at 0.88 signals tight short-term liquidity. | Medium | Medium |
| Market Competition | Intense competition in streaming and broadband markets. | High | High |
| Regulatory Risk | Media and telecom sectors face evolving regulatory scrutiny. | Medium | High |
| Operational Risk | Dependence on cable and theme parks could be disrupted. | Low | Medium |
| Financial Distress | Altman Z-score in grey zone suggests moderate bankruptcy risk. | Medium | High |
I view market competition and regulatory risk as the most pressing. Comcast’s 2026 Altman Z-score of 2.39 places it in the grey zone, indicating moderate financial vulnerability. The low current ratio is a red flag for liquidity tightness, requiring prudent cash management amid sector volatility.
Should You Buy Comcast Corporation?
Comcast appears to be a robust value creator with a very favorable competitive moat, evidenced by growing ROIC well above WACC. Despite some leverage concerns reflected in a grey zone Altman Z-Score, its overall rating is strong at A, suggesting prudent operational efficiency.
Strength & Efficiency Pillars
Comcast Corporation exhibits robust profitability with a net margin of 16.01% and a return on equity of 20.44%. Its return on invested capital (ROIC) at 9.88% comfortably exceeds the weighted average cost of capital (WACC) of 5.28%, confirming Comcast as a value creator. Financial health is solid, supported by a very strong Piotroski score of 9 and an Altman Z-score of 2.39, placing the company in the grey zone but indicating moderate financial risk. These metrics reflect a firm with sustainable competitive advantages and growing profitability.
Weaknesses and Drawbacks
Despite its strengths, Comcast faces some risks. The current ratio stands at a concerning 0.88, signaling potential liquidity constraints that could pressure short-term obligations. Although valuation metrics are favorable, with a low P/E of 5.14 and P/B of 1.05, the stock has experienced a significant 28.37% price decline over the longer term, reflecting bearish sentiment. Seller volume slightly exceeds buyer volume overall, which may dampen momentum despite recent buyer dominance. These factors warrant caution in timing entry points.
Our Verdict about Comcast Corporation
The company’s long-term fundamental profile appears favorable, underpinned by strong profitability and value creation. Recent market dynamics show a buyer-dominant phase with a 65.05% buyer volume share and a 12.01% short-term price rise. This suggests Comcast might appear attractive for investors seeking exposure but with prudent attention to recent volatility and liquidity signals. Patience could reveal a more optimal entry as market conditions evolve.
Disclaimer: This content is for informational purposes only and does not constitute financial, investment, or other professional advice. Investing in financial markets involves a significant risk of loss, and past performance is not indicative of future results.
Additional Resources
- “We Are at an Inflection Point”, Comcast Stock (NASDAQ:CMCSA) Blasts Up – TipRanks (Feb 03, 2026)
- Comcast: Transformation Takes Time, Market Patience Wears Thin (NASDAQ:CMCSA) – Seeking Alpha (Feb 05, 2026)
- Here is What to Know Beyond Why Comcast Corporation (CMCSA) is a Trending Stock – Yahoo Finance (Feb 02, 2026)
- UBS Lowers Comcast (CMCSA) PT to $32 Citing Broadband Go-to-Market Transition – Finviz (Feb 04, 2026)
- Machina Capital S.A.S. Purchases 65,132 Shares of Comcast Corporation $CMCSA – MarketBeat (Feb 04, 2026)
For more information about Comcast Corporation, please visit the official website: corporate.comcast.com