Home > Analyses > Industrials > Columbus McKinnon Corporation
Columbus McKinnon Corporation transforms the way industries move and secure materials, enhancing productivity and safety across global supply chains. Renowned for its intelligent motion solutions, from electric hoists to advanced automation systems, CMCO stands as a key innovator in industrial lifting and material handling. As it continues to expand its footprint in diverse sectors, the crucial question remains: does Columbus McKinnon’s current valuation reflect its growth potential and operational resilience in a competitive market?

Table of contents
Business Model & Company Overview
Columbus McKinnon Corporation, founded in 1875 and headquartered in Buffalo, New York, stands as a key player in the Agricultural – Machinery industry. It delivers an integrated ecosystem of intelligent motion solutions designed to ergonomically move, lift, position, and secure materials worldwide. Its product suite spans electric and air-powered hoists, crane systems, rigging equipment, and advanced power and motion technology, reflecting a cohesive mission to optimize material handling across diverse sectors.
The company’s revenue engine balances durable hardware with specialized electromechanical components and automation services, serving industries from energy to e-commerce globally. Its extensive distribution network and strategic positioning across the Americas, Europe, and Asia enable broad market penetration. Columbus McKinnon’s strong competitive advantage lies in its comprehensive product integration and innovation, securing its role as a cornerstone in shaping the future of industrial motion solutions.
Financial Performance & Fundamental Metrics
In this section, I analyze Columbus McKinnon Corporation’s income statement, key financial ratios, and dividend payout policy to assess its fundamental strength.
Income Statement
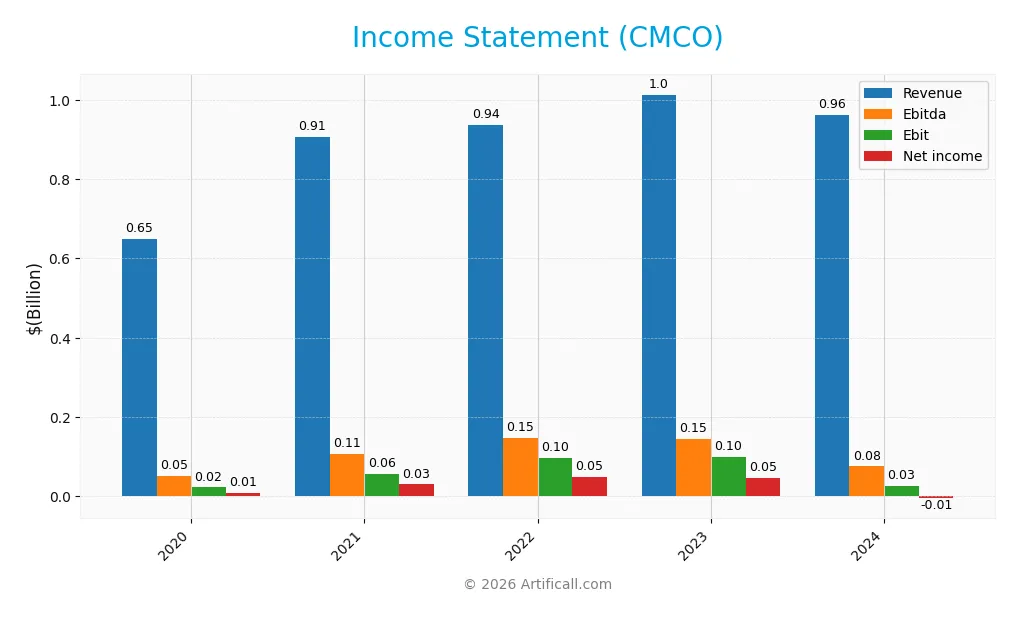
The following table summarizes Columbus McKinnon Corporation’s key income statement figures for fiscal years 2020 through 2024, reported in USD.
| 2020 | 2021 | 2022 | 2023 | 2024 | |
|---|---|---|---|---|---|
| Revenue | 650M | 907M | 936M | 1.01B | 963M |
| Cost of Revenue | 429M | 591M | 594M | 639M | 637M |
| Operating Expenses | 178M | 242M | 244M | 268M | 271M |
| Gross Profit | 220M | 316M | 342M | 375M | 326M |
| EBITDA | 50M | 106M | 147M | 145M | 75M |
| EBIT | 22M | 56M | 97M | 99M | 27M |
| Interest Expense | 12M | 20M | 28M | 38M | 32M |
| Net Income | 9.1M | 29.7M | 48.4M | 46.6M | -5.1M |
| EPS | 0.38 | 1.06 | 1.69 | 1.62 | -0.18 |
| Filing Date | 2021-05-26 | 2022-05-25 | 2023-05-25 | 2024-05-29 | 2025-05-28 |
Income Statement Evolution
From 2020 to 2024, Columbus McKinnon Corporation’s revenue grew by 48.24%, reflecting solid top-line expansion. However, the most recent year shows a 4.98% decline in revenue and a 13.11% decrease in gross profit, signaling margin pressure. EBIT margin remained neutral at 2.8%, but net margin turned unfavorable, dipping to -0.53%, indicating deteriorating profitability.
Is the Income Statement Favorable?
The fiscal year 2024 income statement reveals an unfavorable fundamental picture. Revenue and gross profit declined compared to 2023, while EBIT fell sharply by nearly 73%. Interest expense remained favorable at 3.37% of revenue, yet net income turned negative, resulting in a net margin below zero. Overall, the income statement’s quality is assessed as unfavorable, with significant margin contraction and net losses.
Financial Ratios
The following table presents key financial ratios for Columbus McKinnon Corporation (CMCO) over the last five fiscal years, providing insight into profitability, liquidity, valuation, leverage, and operational efficiency:
| Ratios | 2020 | 2021 | 2022 | 2023 | 2024 |
|---|---|---|---|---|---|
| Net Margin | 1.4% | 3.3% | 5.2% | 4.6% | -0.5% |
| ROE | 1.7% | 3.8% | 5.8% | 5.3% | -0.6% |
| ROIC | 3.9% | 3.8% | 4.2% | 5.0% | 3.3% |
| P/E | 138.5 | 40.1 | 21.9 | 26.6 | -94.7 |
| P/B | 2.38 | 1.54 | 1.27 | 1.40 | 0.55 |
| Current Ratio | 2.40 | 1.87 | 2.05 | 1.96 | 1.81 |
| Quick Ratio | 1.80 | 1.18 | 1.31 | 1.25 | 1.04 |
| D/E | 0.54 | 0.70 | 0.63 | 0.68 | 0.61 |
| Debt-to-Assets | 25% | 32% | 31% | 33% | 31% |
| Interest Coverage | 3.50 | 3.67 | 3.50 | 2.82 | 1.68 |
| Asset Turnover | 0.56 | 0.54 | 0.55 | 0.56 | 0.55 |
| Fixed Asset Turnover | 8.69 | 9.26 | 9.92 | 5.89 | 9.07 |
| Dividend Yield | 0.45% | 0.55% | 0.75% | 0.65% | 1.65% |
Evolution of Financial Ratios
From 2020 to 2024, Columbus McKinnon Corporation’s Return on Equity (ROE) declined, turning negative at -0.58% in 2024, signaling weakened profitability. The Current Ratio remained relatively stable, around 1.8 to 2.4, reflecting consistent liquidity. The Debt-to-Equity Ratio fluctuated moderately, ending near 0.61 in 2024, indicating a stable but moderate leverage position.
Are the Financial Ratios Favorable?
In 2024, profitability ratios such as net margin and ROE were unfavorable, reflecting losses and weak returns. Liquidity ratios like current and quick ratios were favorable, suggesting adequate short-term financial health. Leverage ratios, including debt-to-equity and debt-to-assets, were neutral, showing neither excessive risk nor conservatism. Efficiency and market value ratios had mixed assessments, resulting in a slightly favorable overall financial ratio evaluation.
Shareholder Return Policy
Columbus McKinnon Corporation (CMCO) maintains a consistent dividend payment, with dividend per share near $0.28 and a modest yield around 1.65% in FY 2024. However, the dividend payout ratio turned negative due to a net loss, signaling potential sustainability concerns despite coverage by free cash flow.
The company’s approach includes share buybacks, complementing dividends to return capital to shareholders. Given recent negative net margins, this policy’s ability to support sustainable long-term value depends on CMCO improving profitability and cash flow generation to avoid unsustainable distributions or excessive repurchases.
Score analysis
The radar chart below displays Columbus McKinnon Corporation’s key financial scores for a comprehensive evaluation:
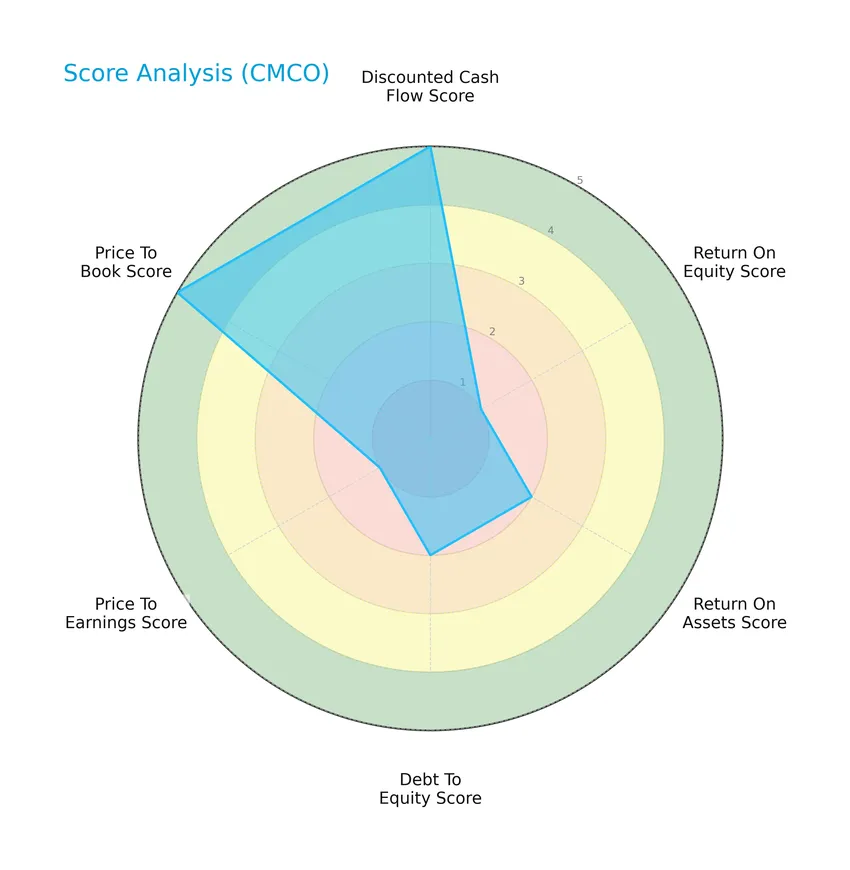
The company shows a very favorable discounted cash flow score of 5 and price-to-book score of 5, while return on equity and price-to-earnings scores are very unfavorable at 1. Return on assets and debt-to-equity scores are moderate at 2, reflecting mixed financial metrics overall.
Analysis of the company’s bankruptcy risk
Columbus McKinnon Corporation’s Altman Z-Score of 1.47 places it in the distress zone, indicating a higher risk of financial distress and potential bankruptcy:

Is the company in good financial health?
The Piotroski Score diagram below illustrates the company’s strong financial health with a score of 8:

With a Piotroski Score categorized as very strong, Columbus McKinnon demonstrates solid profitability, liquidity, and efficiency metrics, suggesting robust overall financial strength.
Competitive Landscape & Sector Positioning
This sector analysis will explore Columbus McKinnon Corporation’s strategic positioning, revenue by segment, key products, main competitors, and competitive advantages. I will examine whether Columbus McKinnon holds a competitive edge within the industrials sector.
Strategic Positioning
Columbus McKinnon Corporation maintains a diversified product portfolio spanning hoists, conveyors, power control systems, and cranes, generating significant revenue across multiple industrial segments. Geographically, it is primarily focused on the United States (approximately $557M in 2024) with substantial presence in Germany ($217M) and Europe ($117M), reflecting a balanced international exposure.
Revenue by Segment
This pie chart illustrates Columbus McKinnon Corporation’s revenue distribution by product segments for the fiscal year ending March 31, 2025 (FY 2024).
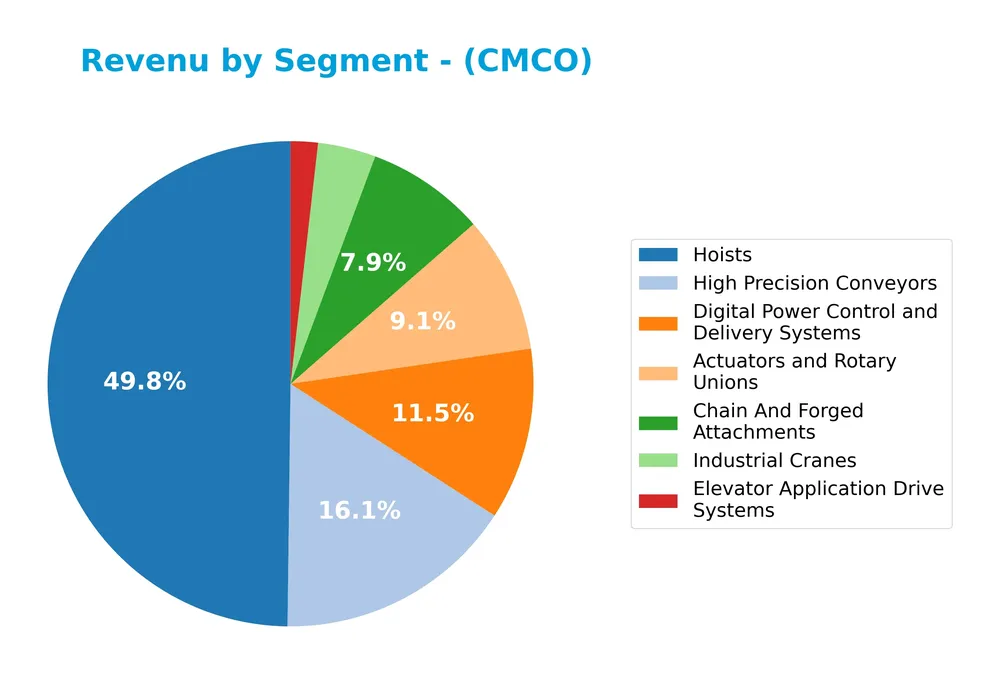
In FY 2024, Hoists led the revenue with $480M, remaining the core business driver despite a slight decline from $495M in FY 2023. High Precision Conveyors followed with $155M, showing a moderate drop from $163M. Digital Power Control and Delivery Systems and Actuators and Rotary Unions generated $110M and $88M respectively, both declining from the previous year. Overall, the business shows a modest slowdown with revenue concentration risk centered on Hoists, which comprises the largest share by far.
Key Products & Brands
The table below presents Columbus McKinnon Corporation’s main products and brands with their descriptions:
| Product | Description |
|---|---|
| Hoists | Electric, air-powered, lever, and hand hoists; explosion-protected and custom engineered hoists and winches for material lifting. |
| Industrial Cranes | Crane systems including crane components, kits, enclosed track rail systems, mobile and jib cranes, and fall protection systems. |
| High Precision Conveyors | Low profile, flexible chain, large scale, sanitary, vertical elevation, pallet system conveyors, and accumulation systems. |
| Digital Power Control and Delivery Systems | Power and motion technology products such as AC motor controls, brakes, cable systems, collision avoidance, and radio controls. |
| Chain And Forged Attachments | Rigging equipment including below-the-hook lifting devices, shackles, chains and accessories, lifting slings, and load binders. |
| Actuators and Rotary Unions | Mechanical and electromechanical actuators, rotary unions, and swivel joints for motion solutions. |
| Elevator Application Drive Systems | Elevator drives and related motor control systems. |
Columbus McKinnon Corporation offers a broad portfolio focused on intelligent motion solutions and material handling, serving diverse industrial and infrastructure markets globally.
Main Competitors
There are 5 competitors in total, with the table below listing the top 5 leaders by market capitalization:
| Competitor | Market Cap. |
|---|---|
| Caterpillar Inc. | 280.3B |
| Deere & Company | 126.2B |
| PACCAR Inc | 58.6B |
| Hyster-Yale Materials Handling, Inc. | 527M |
| Columbus McKinnon Corporation | 496M |
Columbus McKinnon Corporation ranks 5th among its competitors, with a market cap at 0.21% of the leader, Caterpillar Inc. The company is below both the average market cap of the top 10 (93.2B) and the median market cap in the sector (58.6B). It trails its nearest competitor, Hyster-Yale Materials Handling, Inc., by approximately 12.5%.
Comparisons with competitors
Check out how we compare the company to its competitors:
Does CMCO have a competitive advantage?
Columbus McKinnon Corporation does not present a competitive advantage as its return on invested capital (ROIC) is significantly below its weighted average cost of capital (WACC), indicating value destruction and declining profitability. The company’s financials show an unfavorable global moat status due to a negative ROIC trend and decreasing overall profitability.
Looking ahead, Columbus McKinnon Corporation may explore opportunities through its diverse product portfolio in intelligent motion solutions and material handling across multiple industries worldwide. Expansion into new markets and continuous innovation in automation and diagnostics products could offer potential growth avenues despite recent financial challenges.
SWOT Analysis
This SWOT analysis highlights the key internal and external factors affecting Columbus McKinnon Corporation to guide informed investment decisions.
Strengths
- Diverse product portfolio
- Strong global presence, especially in the US and Germany
- Favorable gross margin at 33.82%
Weaknesses
- Declining net margin at -0.53%
- Negative net income growth over 5 years
- Low return on equity and ROIC
Opportunities
- Expansion in emerging markets like Asia Pacific and Latin America
- Growing automation and industrial automation sectors
- Potential for innovation in power and motion technologies
Threats
- Intense competition in industrial machinery
- Economic downturns impacting capital expenditures
- Risk of financial distress indicated by Altman Z-Score in distress zone
Overall, Columbus McKinnon shows solid strengths in product diversity and market reach but struggles with profitability and value creation. Strategic focus should be on improving operational efficiency and leveraging growth opportunities while managing financial risks prudently.
Stock Price Action Analysis
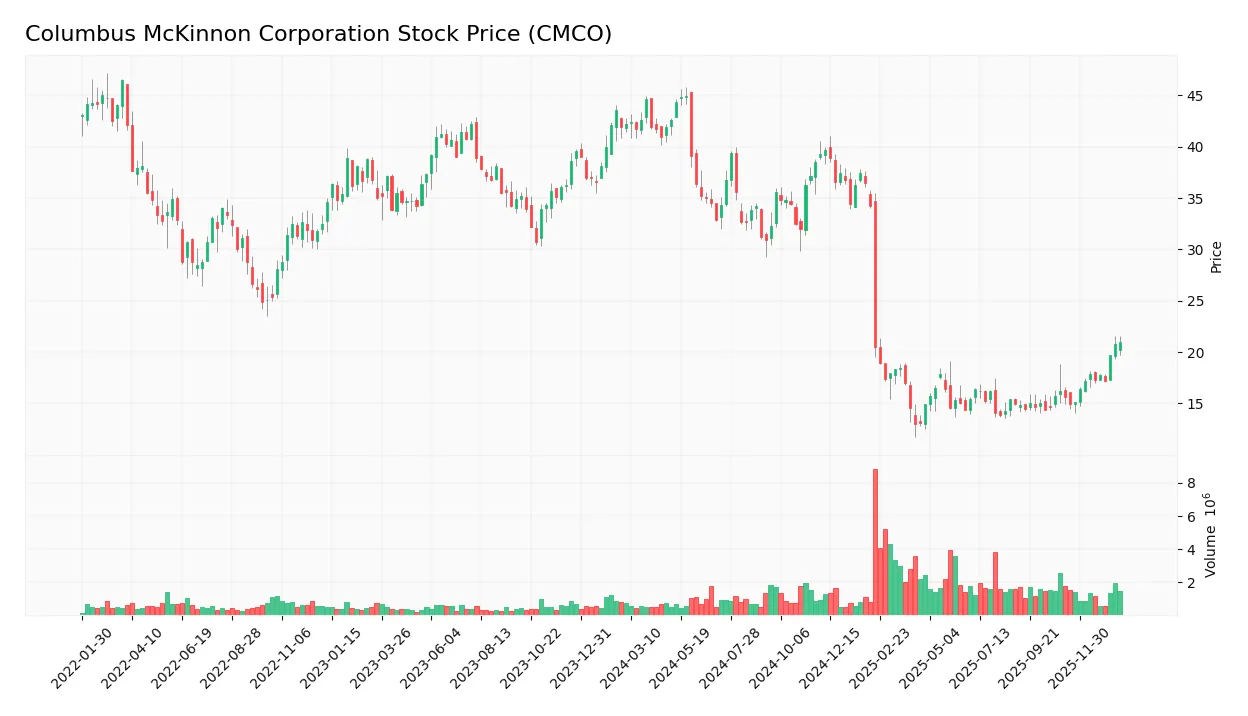
The weekly stock chart of Columbus McKinnon Corporation (CMCO) illustrates price movements and trading activity over the last 12 months:
Trend Analysis
Over the past 12 months, CMCO experienced a significant bearish trend with a price decline of 50.37%, accelerated by high volatility (std deviation 11.02). The stock ranged between a high of 44.9 and a low of 12.96. However, from November 2025 to January 2026, the trend reversed with a 33.93% gain showing moderate upward momentum and low volatility (std deviation 1.93).
Volume Analysis
In the last three months, trading volume has been increasing with a clear buyer dominance at 66.24%, reflecting growing positive investor sentiment. Buyer volume reached 9.78M against seller volume of 4.99M, indicating stronger market participation from buyers and potential confidence building in the stock.
Target Prices
The current analyst consensus for Columbus McKinnon Corporation (CMCO) indicates a unified target price.
| Target High | Target Low | Consensus |
|---|---|---|
| 15 | 15 | 15 |
Analysts show a consistent expectation with all targets converging at $15, suggesting a stable outlook without significant divergence in price forecasts.

Don’t Let Luck Decide Your Entry Point
Optimize your entry points with our advanced ProRealTime indicators. You’ll get efficient buy signals with precise price targets for maximum performance. Start outperforming now!
Analyst & Consumer Opinions
This section reviews the latest analyst ratings and consumer feedback regarding Columbus McKinnon Corporation (CMCO).
Stock Grades
The following table summarizes recent verified grades for Columbus McKinnon Corporation from recognized analysts:
| Grading Company | Action | New Grade | Date |
|---|---|---|---|
| DA Davidson | Downgrade | Neutral | 2025-02-11 |
| DA Davidson | Maintain | Buy | 2024-02-05 |
| DA Davidson | Maintain | Buy | 2022-10-04 |
| DA Davidson | Maintain | Buy | 2022-10-03 |
| Barrington Research | Maintain | Outperform | 2022-07-29 |
| Barrington Research | Maintain | Outperform | 2022-07-28 |
| JP Morgan | Downgrade | Neutral | 2022-05-26 |
| Barrington Research | Maintain | Outperform | 2022-05-26 |
| Barrington Research | Maintain | Outperform | 2022-05-25 |
| JP Morgan | Downgrade | Neutral | 2022-05-25 |
Overall, the consensus among analysts has shifted slightly from predominantly positive ratings such as Buy and Outperform toward more cautious Neutral grades, reflecting a trend of downgrades in recent years. However, the majority consensus remains a Buy with limited Hold ratings and no Sell opinions.
Consumer Opinions
Consumers of Columbus McKinnon Corporation (CMCO) express a mix of appreciation and concerns, reflecting diverse experiences with the company’s products and services.
| Positive Reviews | Negative Reviews |
|---|---|
| Durable and reliable lifting equipment that lasts. | Customer service response times can be slow. |
| Innovative product designs improving operational efficiency. | Some products are priced higher than competitors. |
| Strong safety features that enhance workplace security. | Occasional delays in order fulfillment reported. |
Overall, consumers praise CMCO’s product durability and safety innovations, though some point to service delays and premium pricing as areas for improvement.
Risk Analysis
Below is a table summarizing key risks associated with Columbus McKinnon Corporation, highlighting their probability and potential impact:
| Category | Description | Probability | Impact |
|---|---|---|---|
| Financial Health | Company is in the Altman Z-Score distress zone (1.47), indicating a high bankruptcy risk. | High | High |
| Profitability | Negative net margin (-0.53%) and ROE (-0.58%) signal ongoing profitability challenges. | High | Medium |
| Interest Coverage | Low interest coverage ratio (0.83) raises concerns about ability to meet debt obligations. | Medium | High |
| Market Volatility | Beta of 1.29 suggests higher sensitivity to market fluctuations, increasing investment risk. | Medium | Medium |
| Debt Levels | Moderate debt-to-equity (0.61) and debt-to-assets (31%) ratios imply balanced but present risk | Medium | Medium |
| Valuation | Favorable price-to-book (0.55) but negative price-to-earnings (-94.69) signals valuation risk. | Medium | Medium |
The most pressing risks are the financial distress indicated by the Altman Z-Score and the negative profitability metrics, which could impact the company’s sustainability. Despite strong operational scores like the Piotroski score of 8, cautious risk management is advised due to the high bankruptcy probability and interest coverage concerns.
Should You Buy Columbus McKinnon Corporation?
Columbus McKinnon Corporation appears to be navigating financial challenges with a declining and value-destroying moat profile, while its leverage profile is substantial, suggesting caution. Despite moderate operational efficiency, the overall B rating and strong Piotroski score indicate potential value creation tempered by risk.
Strength & Efficiency Pillars
Columbus McKinnon Corporation exhibits noteworthy financial resilience, underscored by a strong Piotroski Score of 8, signaling robust financial health and operational efficiency. Its current ratio of 1.81 and quick ratio of 1.04 reflect sound liquidity, supporting near-term obligations comfortably. The company benefits from a favorable weighted average cost of capital (WACC) at 7.51%, while maintaining a conservative debt-to-equity ratio of 0.61. Although the return on invested capital (ROIC) at 3.3% falls below the WACC, indicating value erosion, the strong asset turnover ratio of 0.55 and fixed asset turnover of 9.07 demonstrate efficient use of assets.
Weaknesses and Drawbacks
Despite some financial strengths, Columbus McKinnon faces significant headwinds. The Altman Z-Score of 1.47 places it in the distress zone, signaling elevated bankruptcy risk. Profitability is under pressure with a negative net margin of -0.53% and a return on equity (ROE) of -0.58%, both unfavorable. The stock’s valuation metrics appear attractive, with a low price-to-book ratio of 0.55, yet the negative price-to-earnings ratio at -94.69 reflects losses and market skepticism. Market sentiment has pressured the share price sharply, with a 50.37% decline over the long term, despite recent buyer dominance, highlighting volatility and short-term uncertainty.
Our Verdict about Columbus McKinnon Corporation
The company’s long-term fundamental profile might appear unfavorable due to ongoing profitability challenges and financial distress indicators. However, recent market behavior showing buyer dominance and a positive short-term price trend suggests cautious optimism. Despite long-term challenges and value erosion indicated by ROIC below WACC, the improving buyer interest and moderate liquidity could imply a wait-and-see approach, potentially positioning for entry if operational improvements materialize.
Disclaimer: This content is for informational purposes only and does not constitute financial, investment, or other professional advice. Investing in financial markets involves a significant risk of loss, and past performance is not indicative of future results.
Additional Resources
- Columbus McKinnon Announces Pricing of Senior Secured Notes – PR Newswire (Jan 23, 2026)
- Columbus McKinnon Corp Announces Pricing of Senior Secured Notes – TradingView — Track All Markets (Jan 23, 2026)
- Columbus McKinnon trims note sale to $900M to fund Kito Crosby buy – Stock Titan (Jan 23, 2026)
- Will Columbus McKinnon (CMCO) be Able to Trade at 12x EV/EBITDA? – Yahoo Finance (Jan 13, 2026)
- Columbus McKinnon Prices Notes to Fund Kito Crosby Deal – TipRanks (Jan 23, 2026)
For more information about Columbus McKinnon Corporation, please visit the official website: columbusmckinnon.com