Home > Analyses > Financial Services > Coinbase Global, Inc.
Coinbase Global, Inc. revolutionizes how people access and interact with the cryptoeconomy daily. As a pioneer in crypto financial infrastructure, it commands a leading position with its flagship platform serving millions of retail and institutional users. Known for its innovative technology and deep liquidity pools, Coinbase shapes market dynamics and drives adoption. The critical question now is whether Coinbase’s core strengths and growth prospects justify its current valuation amid evolving regulatory and competitive landscapes.

Table of contents
Business Model & Company Overview
Coinbase Global, Inc. was founded in 2012 and is headquartered in Wilmington, Delaware. It dominates the financial data and stock exchange sector by providing a financial infrastructure and technology ecosystem for the cryptoeconomy. Its core mission integrates consumer accounts, institutional liquidity pools, and developer tools into a cohesive platform that fuels crypto adoption globally.
The company generates revenue through a balanced mix of transaction fees from its marketplace, technology services, and crypto-based payment solutions. It operates strategically across key markets in the Americas, Europe, and Asia. Coinbase’s competitive advantage lies in its trusted role as the primary financial account in crypto, building a durable economic moat in an evolving industry.
Financial Performance & Fundamental Metrics
I will analyze Coinbase Global, Inc.’s income statement, key financial ratios, and dividend payout policy to assess its underlying financial health and growth prospects.
Income Statement
The table below summarizes Coinbase Global, Inc.’s key income statement figures for fiscal years 2021 through 2025, reflecting revenue, expenses, profit, and earnings per share.

| 2021 | 2022 | 2023 | 2024 | 2025 | |
|---|---|---|---|---|---|
| Revenue | 7.8B | 3.2B | 3.1B | 6.6B | 6.6B |
| Cost of Revenue | 1.7B | 630M | 1.1B | 1.7B | 1.2B |
| Operating Expenses | 3.0B | 5.3B | 2.1B | 2.6B | 4.5B |
| Gross Profit | 6.1B | 2.6B | 2.0B | 4.9B | 5.4B |
| EBITDA | 3.1B | -2.8B | 146M | 3.2B | 1.8B |
| EBIT | 3.1B | -3.0B | 6M | 3.0B | 1.6B |
| Interest Expense | 29M | 89M | 83M | 81M | 85M |
| Net Income | 3.6B | -2.6B | 95M | 2.6B | 1.3B |
| EPS | 17.47 | -11.84 | 0.40 | 10.42 | 4.85 |
| Filing Date | 2022-02-25 | 2023-02-21 | 2024-02-15 | 2025-02-13 | 2026-02-12 |
Income Statement Evolution
From 2021 to 2025, Coinbase’s revenue declined by 15.4%, with a slight 1% increase in 2025 alone. Gross profit rose 10.5% in 2025, boosting an 81.8% gross margin, while EBIT and net income margins contracted significantly, reflecting margin pressure despite stable revenue. Overall, profitability weakened over the period.
Is the Income Statement Favorable?
The 2025 income statement shows a solid gross margin of 81.8%, indicating efficient cost control. However, EBIT fell 46.8% year-over-year, and net margin dropped to 19%, down 51.6%. Earnings per share declined by 53%, signaling weak profitability momentum. These mixed fundamentals translate into an unfavorable overall income statement assessment.
Financial Ratios
The following table summarizes key financial ratios for Coinbase Global, Inc. from 2021 to 2025, illustrating profitability, liquidity, leverage, and market valuation metrics:
| Ratios | 2021 | 2022 | 2023 | 2024 | 2025 |
|---|---|---|---|---|---|
| Net Margin | 46% | -82% | 3% | 39% | 19% |
| ROE | 57% | -48% | 2% | 25% | 9% |
| ROIC | 31% | -26% | 2% | 14% | 3% |
| P/E | 12.3 | -3.0 | 432.3 | 23.8 | 46.7 |
| P/B | 7.0 | 1.4 | 6.5 | 6.0 | 4.0 |
| Current Ratio | 1.61 | 1.07 | 2.07 | 2.28 | 7.89 |
| Quick Ratio | 1.61 | 1.07 | 2.07 | 2.28 | 7.89 |
| D/E | 0.55 | 0.64 | 0.48 | 0.45 | 0.52 |
| Debt-to-Assets | 16.5% | 20.3% | 20.3% | 20.5% | 25.8% |
| Interest Coverage | 106 | -30.5 | -1.95 | 28.6 | 10.6 |
| Asset Turnover | 0.37 | 0.04 | 0.21 | 0.29 | 0.22 |
| Fixed Asset Turnover | 49.7 | 13.2 | 15.1 | 23.3 | 0 |
| Dividend Yield | 0% | 0% | 0% | 0% | 0% |
Evolution of Financial Ratios
From 2021 to 2025, Coinbase’s Return on Equity (ROE) declined sharply from 56.8% to 8.5%. The Current Ratio improved significantly, rising from 1.61 in 2021 to 7.89 in 2025, indicating stronger short-term liquidity. The Debt-to-Equity Ratio remained relatively stable, fluctuating around 0.5, reflecting consistent leverage use. Profitability showed volatility, with net margins dropping then partially recovering.
Are the Financial Ratios Favorable?
In 2025, Coinbase’s profitability shows mixed signals: net margin at 19.0% is favorable, but ROE (8.5%) and ROIC (2.53%) lag behind the 18.5% WACC, signaling weak capital efficiency. Liquidity is mixed; a high Current Ratio (7.89) is flagged unfavorable due to possible inefficiency, while Quick Ratio is favorable. Leverage is neutral, with debt-to-equity at 0.52. Market multiples like P/E (46.7) and P/B (3.98) are unfavorable, reflecting high valuation risks. Overall, the ratio profile is unfavorable.
Shareholder Return Policy
Coinbase Global, Inc. does not pay dividends, reflecting a strategic choice to reinvest earnings amid a growth and innovation phase. The company maintains zero dividend payout ratio and yield, focusing capital deployment on operational expansion and technology development.
Notably, Coinbase engages in share buybacks, supporting shareholder returns indirectly. This approach aligns with long-term value creation by balancing capital reinvestment and shareholder capital appreciation, given the absence of direct income distributions.
Score analysis
Here is an overview of Coinbase Global, Inc.’s key financial scores represented in the upcoming radar chart:

The company shows moderate scores in discounted cash flow and return on equity, with a favorable return on assets. However, debt to equity is unfavorable, while price-to-earnings and price-to-book scores remain very unfavorable.
Analysis of the company’s bankruptcy risk
The Altman Z-Score places Coinbase in the grey zone, indicating a moderate risk of bankruptcy and financial uncertainty:

Is the company in good financial health?
The Piotroski Score diagram illustrates Coinbase’s average financial health based on nine key criteria:

With a score of 5, Coinbase demonstrates neither strong nor weak financial strength, reflecting an average position in profitability, leverage, liquidity, and operational efficiency.
Competitive Landscape & Sector Positioning
This section examines Coinbase Global, Inc.’s strategic positioning, revenue segments, and key products within the financial services sector. I will assess the company’s main competitors and its competitive advantages in the evolving cryptoeconomy. The analysis aims to determine whether Coinbase holds a sustainable edge over its peers.
Strategic Positioning
Coinbase Global, Inc. concentrates revenue in the U.S. with $6B in 2025 but grows international sales to $1.17B. Its product mix blends consumer crypto services ($3.3B) with institutional and blockchain infrastructure offerings, reflecting a focused yet diversifying portfolio within financial technology.
Revenue by Segment
This pie chart breaks down Coinbase Global, Inc.’s revenue by segment for the fiscal year 2025, illustrating the distribution across different business lines.
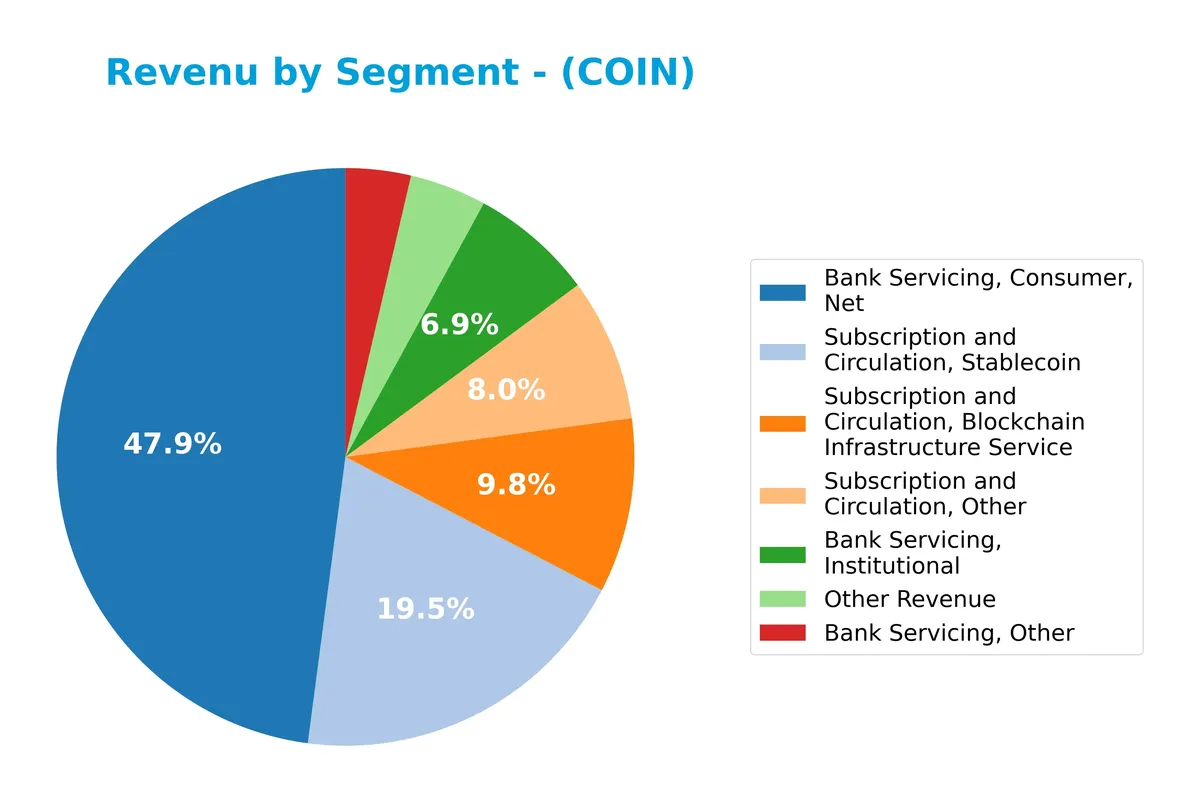
In 2025, the consumer bank servicing segment leads with $3.3B, highlighting its dominance in Coinbase’s revenue mix. Institutional and other bank servicing revenues contribute $480M and $253M, respectively, showing moderate scale but slower growth. Subscription and circulation services, notably stablecoin at $1.35B, reveal a strong acceleration compared to prior years. The diversification into blockchain infrastructure and stablecoin services signals strategic shifts but also concentration risks in volatile crypto markets.
Key Products & Brands
The following table summarizes Coinbase Global, Inc.’s key products and services generating revenue:
| Product | Description |
|---|---|
| Bank Servicing, Consumer, Net | Revenue from providing primary financial accounts and services to individual crypto consumers. |
| Bank Servicing, Institutional | Income derived from supporting institutional clients with crypto asset transactions and liquidity. |
| Bank Servicing, Other | Miscellaneous banking-related services not classified under consumer or institutional segments. |
| Subscription and Circulation, Blockchain Infrastructure Service | Fees from technology and services enabling developers to build crypto applications and payments. |
| Subscription and Circulation, Stablecoin | Revenue generated through stablecoin-related services and transactions. |
| Subscription and Circulation, Custodial Fee | Fees charged for custody and safekeeping of crypto assets (reported in some years). |
| Subscription and Circulation, Other | Other subscription-based or recurring revenue streams within the blockchain ecosystem. |
| Other Revenue | Additional miscellaneous revenue sources outside major segments. |
Coinbase’s revenue streams span consumer and institutional banking services, stablecoin operations, and blockchain infrastructure. This diverse product mix reflects its broad role in the cryptoeconomy.
Main Competitors
There are 9 competitors in the Financial – Data & Stock Exchanges industry; below is a table of the top 9 leaders by market capitalization:
| Competitor | Market Cap. |
|---|---|
| S&P Global Inc. | 155.2B |
| CME Group Inc. | 97.2B |
| Intercontinental Exchange, Inc. | 91.7B |
| Moody’s Corporation | 89.7B |
| Coinbase Global, Inc. | 60.5B |
| Nasdaq, Inc. | 55.5B |
| MSCI Inc. | 43.7B |
| Cboe Global Markets, Inc. | 25.9B |
| FactSet Research Systems Inc. | 10.8B |
Coinbase Global, Inc. ranks 5th among its competitors with a market cap representing 28.5% of the leader, S&P Global. It sits below both the average market cap of the top 10 (70B) and the sector median (60.5B). Coinbase enjoys a significant 102.46% market cap lead over its nearest competitor above, Moody’s Corporation, highlighting a clear gap in scale.
Comparisons with competitors
Check out how we compare the company to its competitors:
Does COIN have a competitive advantage?
Coinbase Global, Inc. does not present a competitive advantage. Its return on invested capital (ROIC) significantly lags its cost of capital with a steeply declining trend, indicating value destruction.
Looking ahead, Coinbase’s expanding international presence and its technology platform for crypto applications offer growth opportunities. However, sustaining profitability amid intense competition remains a challenge.
SWOT Analysis
This analysis highlights Coinbase Global, Inc.’s key strategic factors to assess its market position and growth potential.
Strengths
- strong gross margin at 81.77%
- robust net margin of 19%
- dominant U.S. market presence with $6B revenue
Weaknesses
- declining ROIC well below WACC
- weak revenue and earnings growth
- high valuation multiples (PE 46.67)
Opportunities
- expanding global crypto adoption
- growing institutional crypto demand
- technology platform for crypto payments
Threats
- intense regulatory scrutiny
- high market volatility in crypto assets
- fierce competition from other exchanges
Coinbase shows strong profitability but suffers from declining returns and growth headwinds. The company must leverage its market position and technology to navigate regulatory risks and sustain long-term value creation.
Stock Price Action Analysis
The weekly stock price chart for Coinbase Global, Inc. reveals significant fluctuations and an overall downward trajectory over the past year:
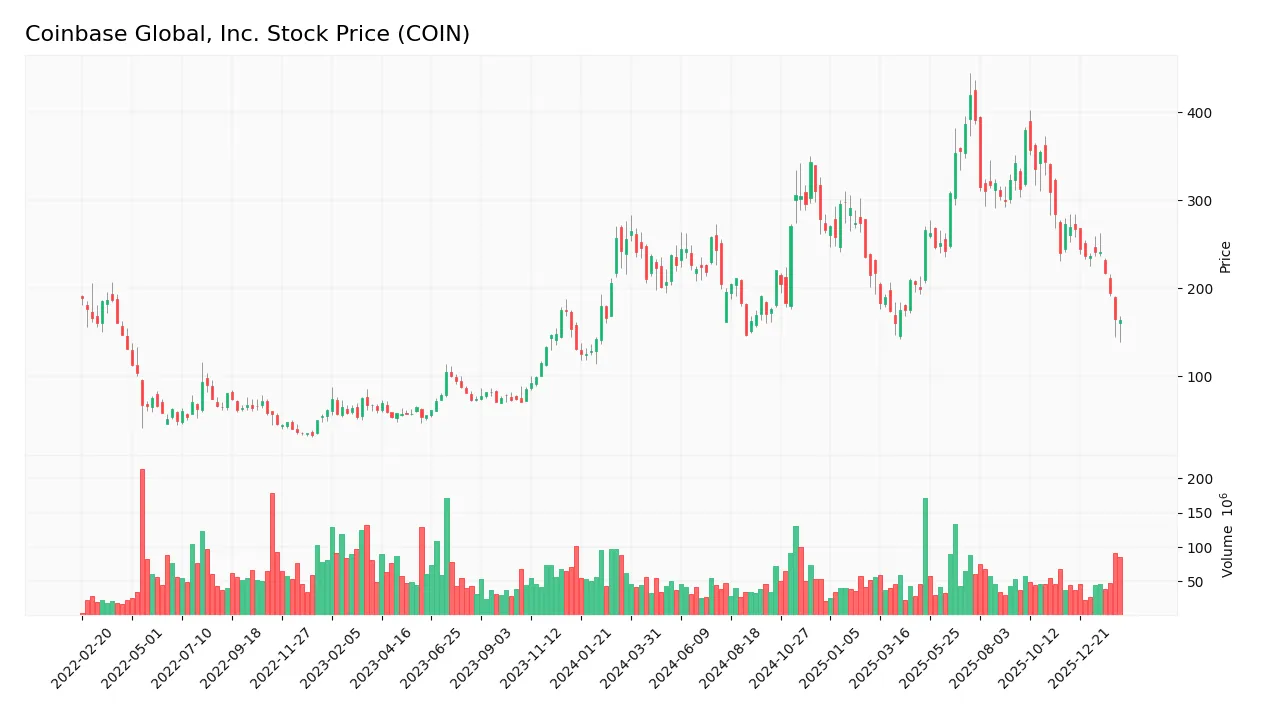
Trend Analysis
Over the past 12 months, COIN’s stock price declined by 35.69%, indicating a clear bearish trend. The price fell from a high of 419.78 to a low of 147.35, with decelerating downward momentum. Volatility remains elevated, with a standard deviation of 59.61, reflecting continued market uncertainty.
Volume Analysis
Trading volume over the last three months has decreased, with sellers dominating at 77.5% of activity. This seller-driven volume suggests weakening investor confidence and reduced market participation, reinforcing the bearish price movement observed during this period.
Target Prices
Analysts present a wide but confident consensus on Coinbase Global, Inc.’s target price.
| Target Low | Target High | Consensus |
|---|---|---|
| 120 | 440 | 280.67 |
The target range reflects significant volatility expectations, yet the consensus suggests moderate upside potential from current levels.

Don’t Let Luck Decide Your Entry Point
Optimize your entry points with our advanced ProRealTime indicators. You’ll get efficient buy signals with precise price targets for maximum performance. Start outperforming now!
Analyst & Consumer Opinions
This section reviews the latest analyst grades and consumer feedback regarding Coinbase Global, Inc. (COIN).
Stock Grades
Here are the latest verified stock grades from leading financial institutions for Coinbase Global, Inc.:
| Grading Company | Action | New Grade | Date |
|---|---|---|---|
| Barclays | Maintain | Equal Weight | 2026-02-13 |
| Needham | Maintain | Buy | 2026-02-13 |
| Benchmark | Maintain | Buy | 2026-02-13 |
| BTIG | Maintain | Buy | 2026-02-13 |
| Canaccord Genuity | Maintain | Buy | 2026-02-13 |
| Rosenblatt | Maintain | Buy | 2026-02-13 |
| Piper Sandler | Maintain | Neutral | 2026-02-13 |
| HC Wainwright & Co. | Maintain | Buy | 2026-02-11 |
| JP Morgan | Maintain | Overweight | 2026-02-10 |
| Citigroup | Maintain | Buy | 2026-02-09 |
Most firms maintain a bullish stance, favoring “Buy” or equivalent ratings, with a minority holding neutral or equal weight positions. This consensus indicates steady confidence amid no recent rating changes.
Consumer Opinions
Consumer sentiment around Coinbase Global, Inc. reveals a mix of enthusiasm for its platform and concerns about service consistency.
| Positive Reviews | Negative Reviews |
|---|---|
| Easy-to-use interface simplifies crypto trading. | Customer support response times are slow. |
| Strong security measures build trust. | High fees impact small investors negatively. |
| Wide range of cryptocurrencies available. | Occasional platform outages disrupt trades. |
Overall, users appreciate Coinbase’s user-friendly platform and robust security. However, recurring complaints about fees and customer service delays highlight areas needing improvement.
Risk Analysis
Below is a summary table of key risks facing Coinbase Global, Inc. as of 2026:
| Category | Description | Probability | Impact |
|---|---|---|---|
| Market Volatility | High beta (3.7) exposes stock to large price swings. | High | High |
| Valuation Risk | Elevated P/E (46.7) and P/B (3.98) suggest overvaluation. | Medium | Medium |
| Profitability | ROIC (2.53%) below WACC (18.5%) signals value destruction. | High | High |
| Liquidity | Very high current ratio (7.89) may indicate inefficient use. | Medium | Low |
| Financial Health | Altman Z-Score in grey zone (2.97) implies moderate distress. | Medium | Medium |
| Regulatory | Crypto regulation changes could impact operations globally. | Medium | High |
| Dividend Policy | No dividends, limiting income appeal for certain investors. | Low | Low |
The most pressing risks are Coinbase’s high market volatility and weak capital efficiency. ROIC significantly below WACC means the company struggles to generate returns above its cost of capital. Despite a robust net margin (19%), inefficient asset turnover and valuation metrics raise red flags. Recent crypto market uncertainties and regulatory shifts amplify these risks. Prudence demands close monitoring of profitability trends and regulatory developments before committing capital.
Should You Buy Coinbase Global, Inc.?
Coinbase appears to be in a grey zone with average financial strength, showing declining operational efficiency and a deteriorating moat due to value destruction. Despite a manageable leverage profile, its overall rating of B- suggests cautious analytical interpretation amid mixed profitability signals.
Strength & Efficiency Pillars
Coinbase Global, Inc. posts a strong gross margin of 81.77% and an EBIT margin of 24.24%, underscoring operational efficiency. The net margin stands at a solid 19.0%, reflecting profitability despite industry pressures. However, the return on invested capital (ROIC) at 2.53% trails the weighted average cost of capital (WACC) at 18.5%, indicating the company is not creating value but rather shedding it. This operational margin strength contrasts with value destruction, signaling caution on capital efficiency.
Weaknesses and Drawbacks
Coinbase faces significant financial headwinds. The Altman Z-Score of 2.97 places it in the “grey zone,” signaling moderate bankruptcy risk. Valuation metrics are stretched, with a price-to-earnings ratio of 46.67 and price-to-book of 3.98, suggesting an expensive stock relative to earnings and assets. The current ratio is unusually high at 7.89, potentially reflecting inefficient asset use. Recent seller dominance at 22.5% amid a bearish trend exacerbates short-term market pressure, increasing volatility risk.
Our Final Verdict about Coinbase Global, Inc.
Despite solid operational margins, Coinbase’s value destruction and grey zone solvency risk make the investment profile cautious. The bearish overall trend and recent seller dominance suggest that, while the company may appear fundamentally resilient, investors might consider a wait-and-see approach for a more favorable entry point. The profile could appeal to risk-tolerant investors but remains too speculative for conservative capital.
Disclaimer: This content is for informational purposes only and does not constitute financial, investment, or other professional advice. Investing in financial markets involves a significant risk of loss, and past performance is not indicative of future results.
Additional Resources
- Coinbase Posts $667 Million Net Loss, Revenue Declines 20% – Bloomberg.com (Feb 12, 2026)
- Coinbase Delivers on Q4 Financial Outlook, Doubles Total Trading Volume and Crypto Trading Volume Market Share in 2025 – Business Wire (Feb 12, 2026)
- Coinbase Global stock bounces up even after Q4 results disappoint (COIN:NASDAQ) – Seeking Alpha (Feb 12, 2026)
- Coinbase posts surprise loss on crypto trading slowdown – Reuters (Feb 12, 2026)
- Coinbase Global Q4 Earnings Call Highlights – Yahoo Finance (Feb 13, 2026)
For more information about Coinbase Global, Inc., please visit the official website: coinbase.com