Home > Analyses > Technology > Coherent, Inc.
Coherent, Inc. powers innovation at the heart of laser technology, shaping industries from microelectronics to scientific research. Its cutting-edge lasers and precision optics drive breakthroughs in manufacturing and instrumentation worldwide. As a key player in hardware and equipment, Coherent commands respect for its quality and market influence. Now, I ask whether Coherent’s robust fundamentals and integration into II-VI Incorporated still justify its premium valuation and growth prospects in 2026.
Table of contents
Business Model & Company Overview
Coherent, Inc., founded in 1966 and based in Santa Clara, California, commands a leading position in the hardware, equipment, and parts industry. Its core mission integrates lasers, precision optics, and laser-based system solutions into a comprehensive ecosystem. This ecosystem serves commercial, industrial, and scientific sectors, enabling innovation across microelectronics, materials processing, and government research programs.
The company’s revenue engine balances Original Equipment Manufacturer (OEM) laser sources with industrial laser systems, combining hardware sales and laser-based technologies. Coherent markets globally through direct sales and independent representatives in the Americas, Europe, and Asia. Its competitive advantage lies in deep technical expertise and a broad product portfolio, forming a durable economic moat that shapes the future of precision laser applications worldwide.
Financial Performance & Fundamental Metrics
I analyze Coherent, Inc.’s income statement, key financial ratios, and dividend payout policy to reveal its underlying profitability and capital allocation discipline.
Income Statement
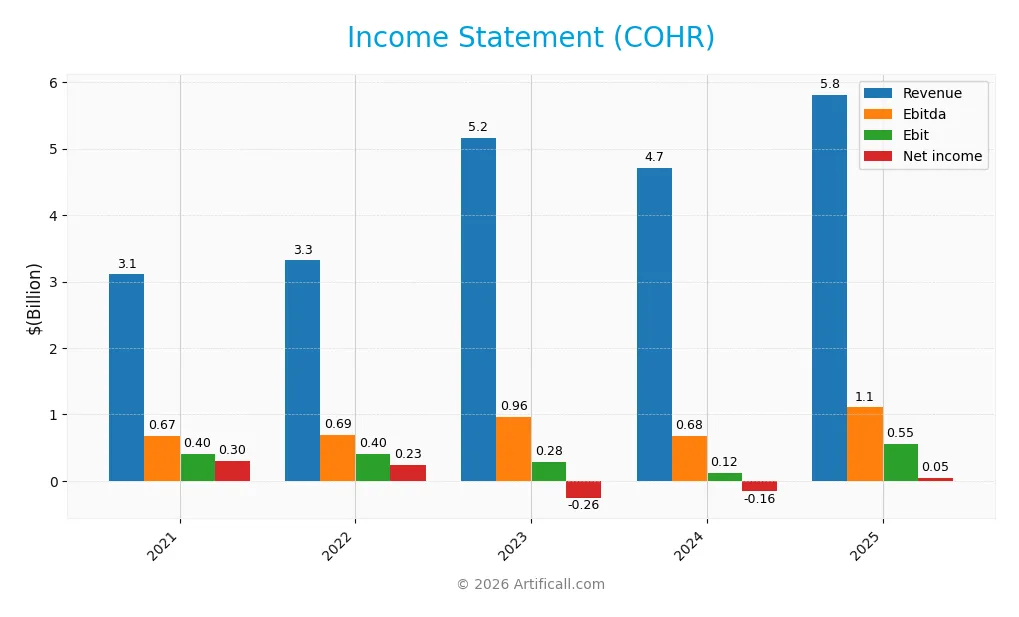
The table below presents Coherent, Inc.’s key income statement figures for fiscal years 2021 through 2025, illustrating revenue, expenses, and earnings trends.
| 2021 | 2022 | 2023 | 2024 | 2025 | |
|---|---|---|---|---|---|
| Revenue | 3.11B | 3.32B | 5.16B | 4.71B | 5.81B |
| Cost of Revenue | 1.93B | 2.05B | 3.38B | 3.25B | 3.75B |
| Operating Expenses | 775M | 851M | 1.50B | 1.33B | 1.51B |
| Gross Profit | 1.18B | 1.27B | 1.78B | 1.46B | 2.06B |
| EBITDA | 672M | 690M | 962M | 683M | 1.11B |
| EBIT | 402M | 403M | 280M | 123M | 552M |
| Interest Expense | 60M | 121M | 287M | 288M | 243M |
| Net Income | 298M | 235M | -259M | -156M | 49M |
| EPS | 2.50 | 1.57 | -2.93 | -1.84 | -0.52 |
| Filing Date | 2021-06-30 | 2022-06-30 | 2023-08-18 | 2024-08-16 | 2025-08-15 |
Income Statement Evolution
Coherent, Inc.’s revenue rose sharply by 87% from 2021 to 2025, with a strong 23% increase in the last year alone. Gross profit expanded faster than revenue, boosting the gross margin to a favorable 35.4%. However, net income declined significantly over the period, dragging net margin down and indicating pressure on bottom-line profitability despite top-line growth.
Is the Income Statement Favorable?
In 2025, Coherent reported a modest net margin of 0.85%, reflecting a slight profit from rising revenues of $5.81B. Operating efficiency improved, with operating expenses growing in line with revenue and EBIT margin holding steady at 9.5%. Interest expenses remained favorable at 4.19% of revenue, supporting a generally positive income statement despite a thin net margin and ongoing earnings volatility.
Financial Ratios
The table below summarizes key financial ratios for Coherent, Inc. over the fiscal years 2021 to 2025, highlighting profitability, liquidity, leverage, and market valuation metrics:
| Ratios | 2021 | 2022 | 2023 | 2024 | 2025 |
|---|---|---|---|---|---|
| Net Margin | 9.6% | 7.1% | -5.0% | -3.3% | 0.8% |
| ROE | 7.2% | 5.4% | -3.6% | -2.1% | 0.6% |
| ROIC | 5.8% | 4.9% | 1.6% | 0.9% | 1.3% |
| P/E | 27 | 23 | -27 | -71 | 280 |
| P/B | 1.93 | 1.23 | 0.97 | 1.46 | 1.70 |
| Current Ratio | 4.1 | 3.4 | 3.0 | 2.7 | 2.2 |
| Quick Ratio | 3.2 | 2.7 | 1.8 | 1.8 | 1.4 |
| D/E | 0.37 | 0.56 | 0.62 | 0.57 | 0.48 |
| Debt-to-Assets | 23% | 31% | 33% | 30% | 26% |
| Interest Coverage | 6.7 | 3.4 | 1.0 | 0.4 | 2.3 |
| Asset Turnover | 0.48 | 0.42 | 0.38 | 0.32 | 0.39 |
| Fixed Asset Turnover | 2.5 | 2.4 | 2.9 | 2.6 | 3.1 |
| Dividend Yield | 0.25% | 0.64% | 0.39% | 0.00% | 0.08% |
Evolution of Financial Ratios
From 2021 to 2025, Coherent, Inc.’s Return on Equity declined sharply from 7.2% to 0.6%, indicating eroding profitability. The Current Ratio decreased from 4.15 to 2.19, reflecting reduced liquidity but still above 1, signaling adequate short-term coverage. Debt-to-Equity ratio rose moderately, then improved to 0.48 in 2025, suggesting better leverage management.
Are the Financial Ratios Fovorable?
In 2025, Coherent’s profitability ratios, including net margin (0.85%) and ROE (0.61%), remain unfavorable versus industry norms. Liquidity ratios, such as the current (2.19) and quick (1.39) ratios, are favorable, supporting operational stability. Leverage metrics like debt-to-equity (0.48) and debt-to-assets (26.1%) also appear favorable. However, asset turnover (0.39) and dividend yield (0.08%) are unfavorable, while interest coverage (2.27) and price-to-book (1.7) ratios are neutral, resulting in a slightly unfavorable overall assessment.
Shareholder Return Policy
Coherent, Inc. pays a modest dividend with a payout ratio near 23%, supported by positive free cash flow coverage. Dividend per share has fluctuated, yielding under 0.1%, while the company also engages in share buybacks.
This distribution policy reflects cautious capital allocation amid thin net margins and moderate profitability. The balance between dividends and repurchases appears designed to sustain long-term shareholder value without risking excessive cash depletion.
Score analysis
The radar chart below visualizes Coherent, Inc.’s key financial scores across valuation, profitability, and leverage metrics:
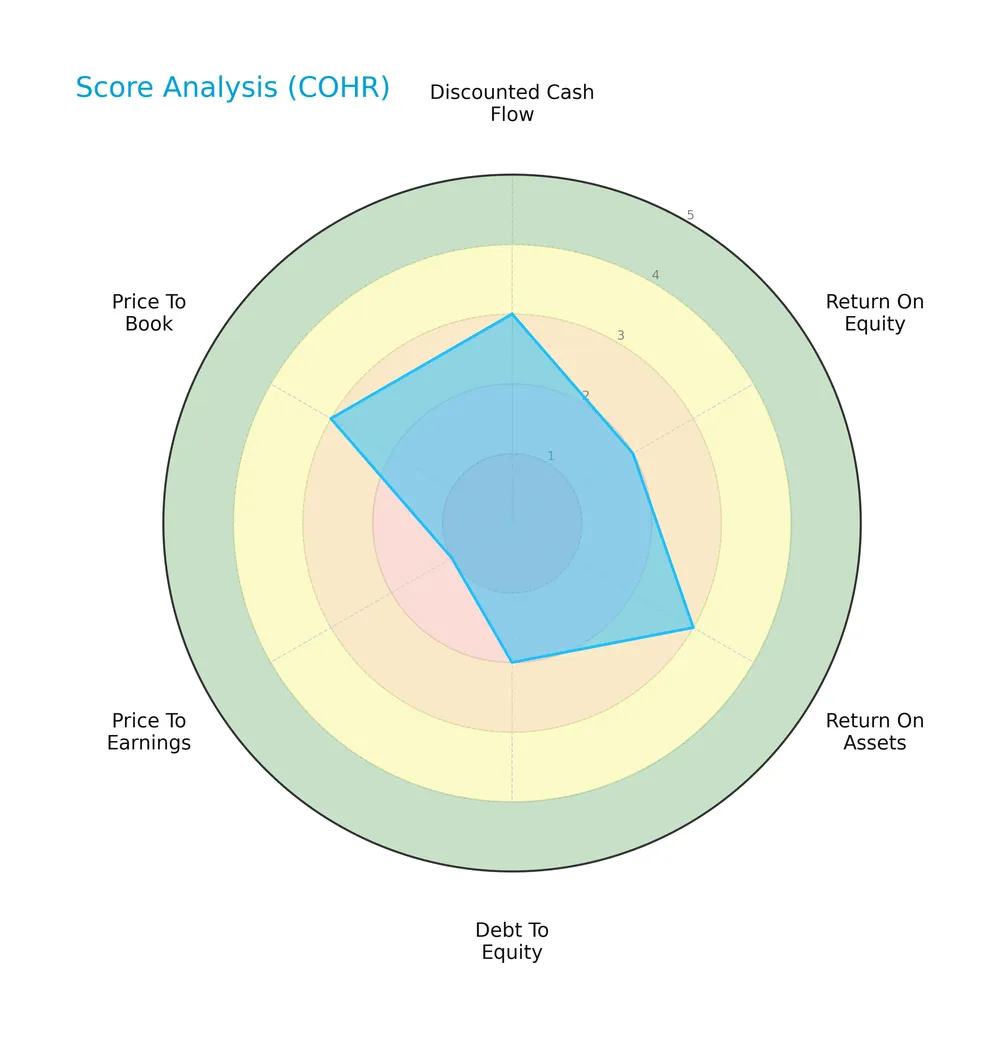
Coherent shows moderate scores in discounted cash flow, return on equity, return on assets, debt to equity, and price to book ratios. The price to earnings score is notably low, indicating valuation concerns relative to earnings.
Analysis of the company’s bankruptcy risk
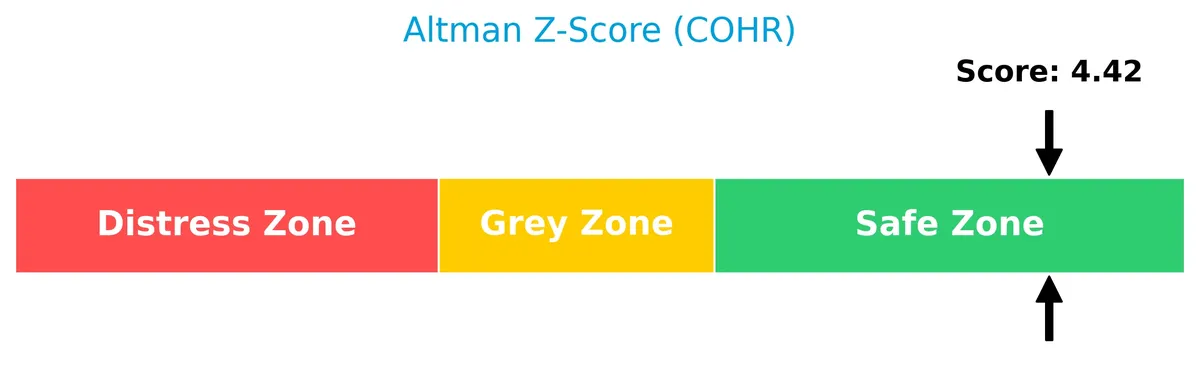
Coherent’s Altman Z-Score places it firmly in the safe zone, signaling low bankruptcy risk and solid financial stability:
Is the company in good financial health?
The Piotroski diagram below illustrates Coherent’s strong financial health based on profitability, leverage, liquidity, and operational efficiency:
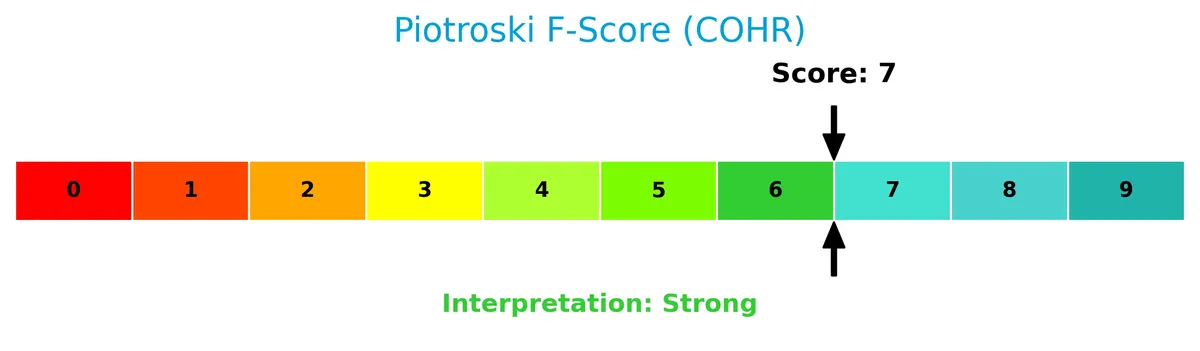
With a Piotroski Score of 7, Coherent ranks as financially strong, suggesting good fundamentals and resilience despite some valuation cautions.
Competitive Landscape & Sector Positioning
This section evaluates Coherent, Inc.’s strategic positioning within the hardware, equipment, and parts industry. I will analyze revenue by segment, key products, and main competitors. I will assess whether Coherent holds a competitive advantage over its peers. The analysis includes a detailed SWOT overview to clarify strengths and vulnerabilities.
Strategic Positioning
Coherent, Inc. maintains a moderately diversified portfolio with two main segments: Lasers (1.43B in 2025) and Materials (953M). Geographically, it relies heavily on North America (3.56B), while maintaining significant exposure in Europe (699M), China (680M), Japan (391M), and other regions.
Revenue by Segment
This pie chart illustrates Coherent, Inc.’s revenue distribution by segment for fiscal year 2025, highlighting the relative contributions of the Lasers and Materials segments.
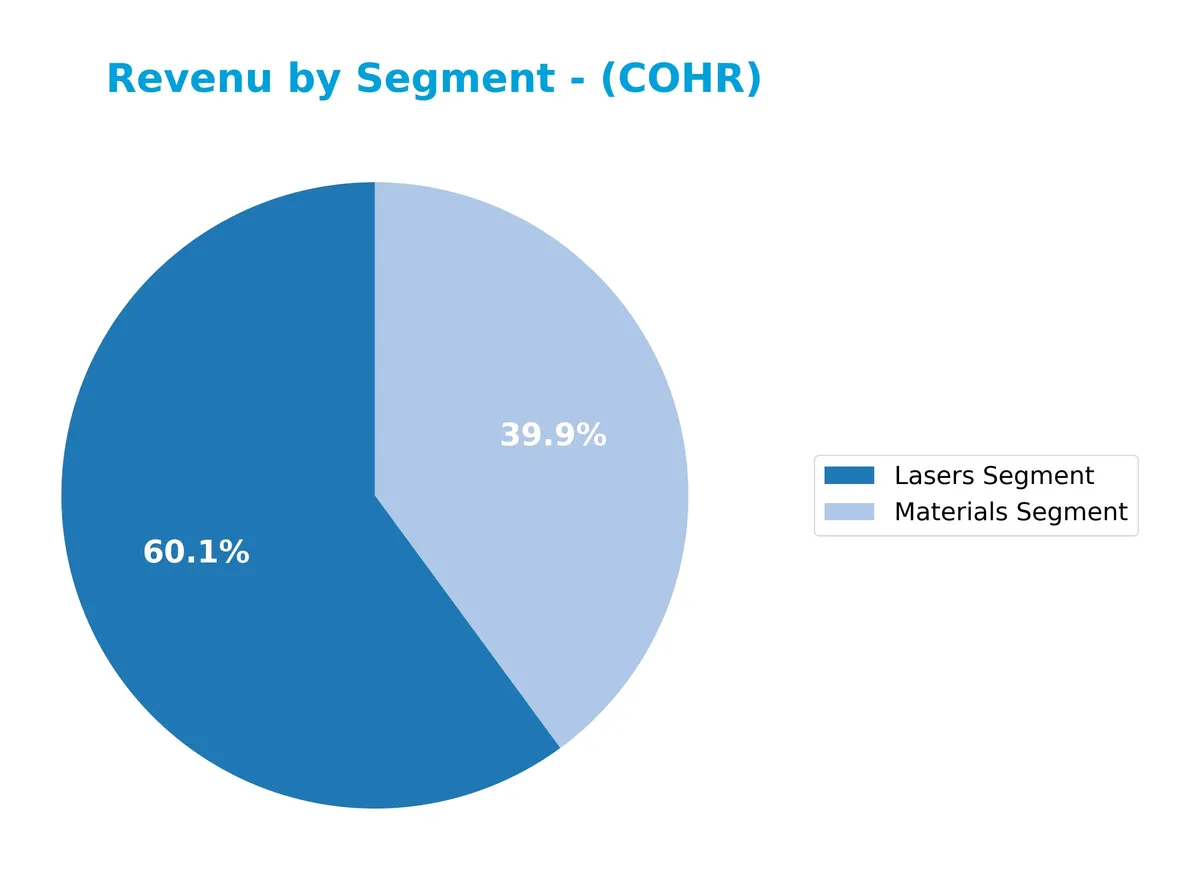
Coherent’s revenue in 2025 shows the Lasers segment leading with $1.43B, slightly up from $1.40B in 2024 but down from $1.47B in 2023. The Materials segment declined sharply to $954M in 2025 from $1.02B in 2024 and $1.35B in 2023. This shift signals a growing concentration in Lasers, raising questions about diversification risks ahead.
Key Products & Brands
Coherent, Inc. offers a range of laser technologies and precision materials for industrial and scientific uses:
| Product | Description |
|---|---|
| Lasers Segment | Designs and manufactures lasers, laser tools, and laser-based system solutions for OEM and industrial applications. |
| Materials Segment | Produces precision optics, laser measurement and control products, serving microelectronics and scientific research. |
Coherent’s product portfolio centers on advanced lasers and precision materials. These serve diverse markets such as microelectronics, materials processing, and government research programs. The company blends manufacturing expertise with high-tech applications.
Main Competitors
Coherent, Inc. competes with 20 companies in its sector; the table below lists the top 10 leaders by market capitalization:
| Competitor | Market Cap. |
|---|---|
| Amphenol Corporation | 171B |
| Corning Incorporated | 77.7B |
| TE Connectivity Ltd. | 68.6B |
| Sandisk Corporation | 40.0B |
| Garmin Ltd. | 38.9B |
| Keysight Technologies, Inc. | 35.5B |
| Celestica Inc. | 34.0B |
| Coherent, Inc. | 28.7B |
| Jabil Inc. | 25.7B |
| Teledyne Technologies Incorporated | 24.4B |
Coherent ranks 8th among its 20 competitors, with a market cap equaling 18.7% of the sector’s leader, Amphenol Corporation. The company sits below the average market cap of the top 10 (54.4B) but above the sector median (21.6B). It maintains a 6.49% gap over its closest rival above, Celestica Inc., indicating a moderate cushion in competitive positioning.
Comparisons with competitors
Check out how we compare the company to its competitors:
Does COHR have a competitive advantage?
Coherent, Inc. does not demonstrate a competitive advantage, as its ROIC falls significantly below WACC, indicating value destruction and declining profitability. This very unfavorable moat status signals inefficiency in capital use and weakening economic profits.
Looking ahead, Coherent’s strong revenue growth and expansion in North America and Asia could offer future opportunities. Its focus on laser technologies for diverse industrial and scientific applications may support market penetration and product development.
SWOT Analysis
This SWOT analysis distills Coherent, Inc.’s key internal and external factors impacting its competitive stance and growth potential.
Strengths
- strong revenue growth of 87% over 5 years
- favorable gross margin at 35.4%
- robust geographic diversification with North America leadership
Weaknesses
- negative ROIC vs. WACC signals value destruction
- weak net and ROE margins under 1%
- very high P/E ratio of 280x raises valuation concerns
Opportunities
- expanding industrial laser market
- innovation in laser-based system solutions
- growing demand in microelectronics and scientific research
Threats
- intense competition in laser hardware sector
- high beta of 1.87 indicates stock volatility
- supply chain constraints and geopolitical risks
Coherent shows strong top-line growth and operational scale, but weak profitability and value generation undermine its financial moat. The company must leverage innovation and market expansion to offset competitive and valuation risks.
Stock Price Action Analysis
The upcoming weekly chart displays Coherent, Inc.’s stock price evolution over the past 12 months, highlighting key highs, lows, and trend dynamics:
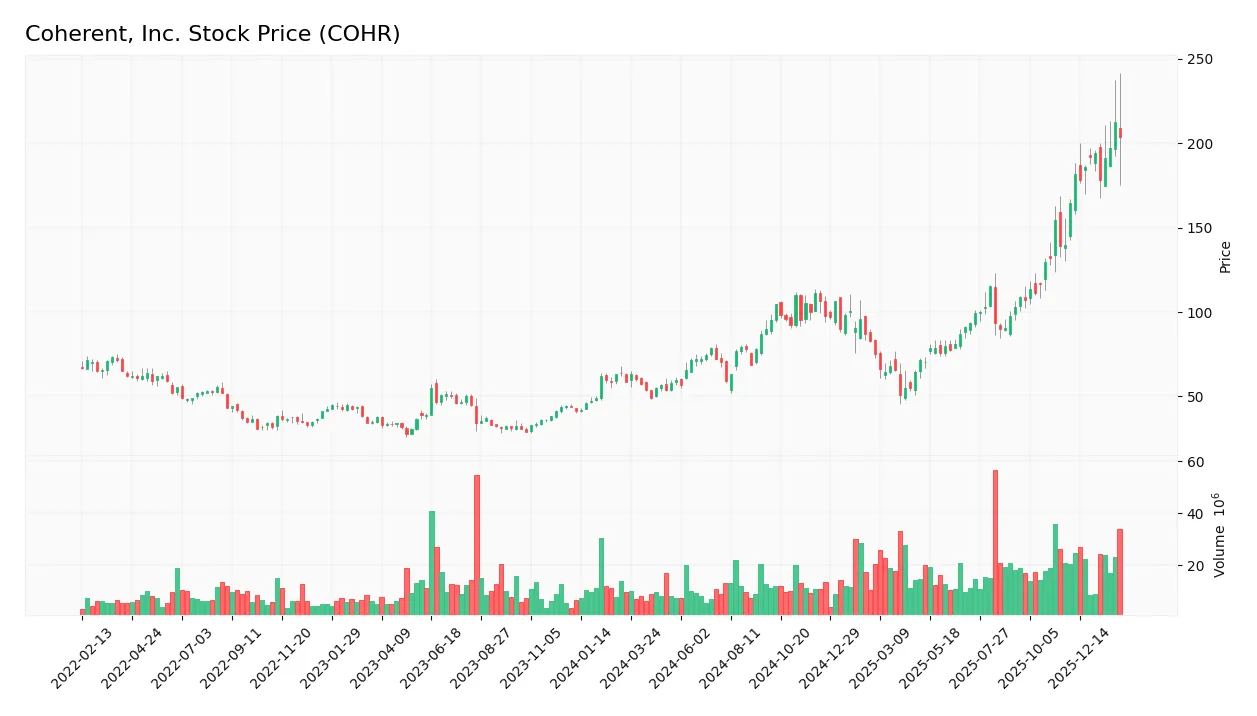
Trend Analysis
Coherent, Inc.’s stock increased 247% over the past year, confirming a strong bullish trend with accelerating momentum. The price moved from a low of 49.26 to a high of 212.18, with volatility measured by a standard deviation of 38.81, reflecting significant price swings during this period.
Volume Analysis
Trading volume shows an increasing trend, with a total of 1.77B shares exchanged. Buyers dominate at 60%, rising to 67% in the recent three-month period, indicating strong buyer-driven activity and positive investor sentiment supporting the stock’s upward trajectory.
Target Prices
Analysts show a robust target consensus for Coherent, Inc., reflecting confidence in its growth trajectory.
| Target Low | Target High | Consensus |
|---|---|---|
| 170 | 235 | 209.29 |
The target range from 170 to 235 indicates bullish analyst expectations, with a consensus near 210 signaling strong upside potential.

Don’t Let Luck Decide Your Entry Point
Optimize your entry points with our advanced ProRealTime indicators. You’ll get efficient buy signals with precise price targets for maximum performance. Start outperforming now!
Analyst & Consumer Opinions
This section examines the latest analyst ratings and consumer feedback regarding Coherent, Inc. (COHR) to gauge market sentiment.
Stock Grades
Here are the latest verified analyst grades for Coherent, Inc. reflecting consistent sentiment across firms:
| Grading Company | Action | New Grade | Date |
|---|---|---|---|
| Barclays | Maintain | Overweight | 2026-02-05 |
| Needham | Maintain | Buy | 2026-02-05 |
| Rosenblatt | Maintain | Buy | 2026-02-05 |
| JP Morgan | Maintain | Overweight | 2026-02-05 |
| Stifel | Maintain | Buy | 2026-02-05 |
| Morgan Stanley | Maintain | Equal Weight | 2026-02-05 |
| Morgan Stanley | Maintain | Equal Weight | 2026-01-30 |
| Citigroup | Maintain | Buy | 2026-01-26 |
| Susquehanna | Maintain | Positive | 2026-01-22 |
| Stifel | Maintain | Buy | 2026-01-22 |
The grades reveal a strong bias toward buying, with most firms maintaining positive ratings. A few hold positions suggest cautious optimism among top analysts.
Consumer Opinions
Consumer sentiment around Coherent, Inc. (COHR) reflects a mix of admiration for product quality and frustration with customer service responsiveness.
| Positive Reviews | Negative Reviews |
|---|---|
| “The laser technology is top-notch and reliable.” | “Customer support takes too long to respond.” |
| “Products deliver consistent performance every time.” | “Pricing feels high compared to competitors.” |
| “Strong innovation keeps them ahead in the market.” | “Limited availability causes delays in orders.” |
Overall, consumers praise Coherent’s advanced technology and product consistency. However, recurring complaints about customer service delays and pricing may dampen user satisfaction.
Risk Analysis
Below is a summary table outlining the key risks facing Coherent, Inc. as of 2026:
| Category | Description | Probability | Impact |
|---|---|---|---|
| Valuation Risk | Extremely high P/E of 280 signals overvaluation and market caution. | High | High |
| Profitability Risk | Net margin at 0.85% and ROIC at 1.31% both fall well below WACC. | High | High |
| Market Volatility | Beta of 1.87 indicates sensitivity to broader market swings. | Medium | Medium |
| Debt Servicing | Interest coverage of 2.27 suggests moderate risk in servicing debt. | Medium | Medium |
| Operational Risk | Asset turnover of 0.39 signals inefficiency in asset use. | Medium | Medium |
Profitability and valuation risks dominate Coherent’s profile. Its returns fail to cover the 11.8% cost of capital, a red flag for long-term value creation. The sky-high P/E ratio heightens downside risk if growth disappoints. I note the firm’s strong Altman Z-score (4.42) and Piotroski score (7), which moderate bankruptcy concerns but do not offset profitability gaps. Investors must weigh these factors carefully in volatile tech markets.
Should You Buy Coherent, Inc.?
Coherent, Inc. appears to be in a safe financial zone with moderate profitability and a deteriorating competitive moat, indicating value destruction. Despite manageable leverage, the overall B- rating suggests cautious monitoring of operational efficiency is prudent.
Strength & Efficiency Pillars
Coherent, Inc. shows solid financial health with an Altman Z-Score of 4.42, placing it firmly in the safe zone. The Piotroski Score of 7 signals strong operational fundamentals. Its current ratio of 2.19 and debt-to-equity ratio of 0.48 reflect prudent liquidity and moderate leverage. While return on invested capital (ROIC) stands at a low 1.31%, below the weighted average cost of capital (WACC) at 11.8%, the company maintains healthy gross margins of 35.41%, supporting operational efficiency despite value erosion.
Weaknesses and Drawbacks
Coherent faces valuation challenges, with an inflated price-to-earnings ratio of 279.75 signaling an expensive stock relative to earnings. The net margin at 0.85% and return on equity of 0.61% are notably weak, raising concerns about profitability. Asset turnover at 0.39 suggests inefficient asset utilization. Additionally, the company’s declining ROIC trend indicates value destruction, highlighting risks in capital allocation. The modest dividend yield of 0.08% adds little appeal for income-focused investors.
Our Verdict about Coherent, Inc.
The fundamental profile of Coherent, Inc. appears mixed to slightly unfavorable due to weak profitability and value destruction. However, the bullish stock trend and recent buyer dominance with 66.63% buying volume might suggest potential momentum. Despite long-term challenges, the current market enthusiasm could present opportunities, but investors may want to adopt a cautious, patient stance before committing significant capital.
Disclaimer: This content is for informational purposes only and does not constitute financial, investment, or other professional advice. Investing in financial markets involves a significant risk of loss, and past performance is not indicative of future results.
Additional Resources
- Better-Than-Expected Results Lifted Coherent (COHR) in Q4 – Yahoo Finance (Feb 05, 2026)
- Coherent, Inc. (NYSE:COHR) Q2 2026 Earnings Call Transcript – Insider Monkey (Feb 05, 2026)
- Coherent Shines at Q2 Earnings: Should Investors Buy the Stock Now? – Finviz (Feb 05, 2026)
- Coherent Live: Complete Coverage Of COHR’s Q2 Earnings – 24/7 Wall St. (Feb 04, 2026)
- Coherent Pivots to Next Gen Manufacturing in a Massive Bid to Capture AI Hypergrowth – Benzinga (Feb 05, 2026)
For more information about Coherent, Inc., please visit the official website: coherent.com