Home > Analyses > Technology > Cognizant Technology Solutions Corporation
Cognizant transforms how businesses harness technology to redefine customer experiences and operational efficiency. It commands a leading role in IT services, delivering cutting-edge consulting, AI, and automation solutions across industries like healthcare, finance, and media. Renowned for innovation and scale, Cognizant shapes digital transformations that impact millions daily. The key question: Do its fundamentals still support robust growth and justify its current valuation in a fiercely competitive sector?

Table of contents
Business Model & Company Overview
Cognizant Technology Solutions Corporation, founded in 1994 and headquartered in Teaneck, New Jersey, stands as a dominant player in Information Technology Services. It delivers a cohesive ecosystem of consulting, technology, and outsourcing services across Financial Services, Healthcare, Products and Resources, and Communications sectors. The company’s mission centers on enhancing customer experience through digital innovation, including AI, analytics, and robotic process automation.
Cognizant generates value through a balanced mix of software-driven solutions and consulting services, targeting operational improvements and digital transformation. Its strategic footprint spans the Americas, Europe, and Asia, serving industries from healthcare to media. The company’s robust economic moat lies in its integrated, outcome-based contracting and deep domain expertise, shaping the future of IT services globally.
Financial Performance & Fundamental Metrics
I analyze Cognizant Technology Solutions Corporation’s income statement, key financial ratios, and dividend payout policy to assess its core profitability and shareholder value.
Income Statement
The table below summarizes Cognizant Technology Solutions Corporation’s key income statement items for fiscal years 2021 through 2025, reflecting revenue growth and profitability trends.

| 2021 | 2022 | 2023 | 2024 | 2025 | |
|---|---|---|---|---|---|
| Revenue | 18.5B | 19.4B | 19.4B | 19.7B | 21.1B |
| Cost of Revenue | 11.6B | 12.4B | 12.7B | 12.9B | 14.0B |
| Operating Expenses | 4.1B | 4.0B | 4.0B | 3.9B | 3.6B |
| Gross Profit | 6.9B | 7.0B | 6.7B | 6.8B | 7.1B |
| EBITDA | 3.4B | 3.6B | 3.4B | 3.5B | 4.2B |
| EBIT | 2.8B | 3.0B | 2.8B | 3.0B | 3.6B |
| Interest Expense | 9M | 19M | 41M | 54M | 37M |
| Net Income | 2.1B | 2.3B | 2.1B | 2.2B | 2.2B |
| EPS | 4.06 | 4.42 | 4.21 | 4.52 | 4.56 |
| Filing Date | 2022-02-16 | 2023-02-15 | 2024-02-14 | 2025-02-12 | 2026-02-12 |
Income Statement Evolution
Cognizant’s revenue rose 14.1% from 2021 to 2025, with a 7.0% jump in 2025 alone. Gross profit improved steadily, reflecting stable gross margins near 34%. EBIT grew faster, up 21.1% in 2025, indicating better operational efficiency. However, net margin declined modestly over the period, signaling some pressure on profitability despite revenue gains.
Is the Income Statement Favorable?
In 2025, Cognizant posted $21.1B revenue and $2.23B net income, yielding a 10.6% net margin classified as favorable. EBIT margin of 17.2% and low interest expense ratio (0.18%) further support strong fundamentals. Yet, a 6.9% net margin drop in the last year warns of emerging margin risks. Overall, the income statement shows solid growth with prudent cost control, though margin trends merit monitoring.
Financial Ratios
The following table summarizes key financial ratios for Cognizant Technology Solutions Corporation (CTSH) over the last five fiscal years:
| Ratios | 2021 | 2022 | 2023 | 2024 | 2025 |
|---|---|---|---|---|---|
| Net Margin | 11.5% | 11.8% | 11.0% | 11.3% | 10.6% |
| ROE | 17.8% | 18.6% | 16.1% | 15.5% | 14.9% |
| ROIC | 14.7% | 15.3% | 13.3% | 13.2% | 12.3% |
| P/E | 21.9 | 12.9 | 17.9 | 17.0 | 17.9 |
| P/B | 3.90 | 2.41 | 2.88 | 2.65 | 2.66 |
| Current Ratio | 2.08 | 2.17 | 2.25 | 2.09 | 2.34 |
| Quick Ratio | 2.08 | 2.17 | 2.25 | 2.09 | 2.34 |
| D/E | 0.14 | 0.12 | 0.10 | 0.10 | 0.10 |
| Debt-to-Assets | 9.2% | 8.6% | 7.1% | 7.5% | 7.6% |
| Interest Coverage | 314 | 156 | 66 | 54 | 95 |
| Asset Turnover | 1.04 | 1.09 | 1.05 | 0.99 | 1.02 |
| Fixed Asset Turnover | 8.80 | 9.83 | 11.7 | 12.8 | 14.0 |
| Dividend Yield | 1.1% | 1.9% | 1.5% | 1.6% | 1.5% |
Evolution of Financial Ratios
Return on Equity (ROE) showed a slight decline from 18.6% in 2022 to 14.9% in 2025, indicating a moderation in profitability. The Current Ratio improved from 2.17 in 2022 to 2.34 in 2025, reflecting stronger liquidity. Debt-to-Equity remained stable around 0.10, suggesting consistent leverage management over the period.
Are the Financial Ratios Fovorable?
In 2025, profitability ratios such as net margin (10.56%) and return on invested capital (12.31%) are favorable, exceeding the company’s weighted average cost of capital (7.93%). Liquidity is strong with a current ratio of 2.34 and quick ratio matching it. Leverage appears conservative with a debt-to-equity of 0.1 and interest coverage near 98. Market valuation ratios, including P/E of 17.9 and P/B of 2.66, are neutral. Overall, 71% of key ratios are favorable, supporting a positive financial profile.
Shareholder Return Policy
Cognizant maintains a consistent dividend policy with a payout ratio near 27%, supporting a stable dividend per share rising from $0.97 in 2021 to $1.27 in 2025. The annual yield hovers around 1.5%, underpinned by free cash flow coverage close to 90%.
The company also engages in share buybacks, reinforcing capital return without risking sustainability. Dividend payments remain comfortably covered by operating cash flow and capital expenditures, indicating a balanced approach to shareholder returns that supports long-term value creation.
Score analysis
Here is a radar chart illustrating Cognizant Technology Solutions Corporation’s key financial scores:
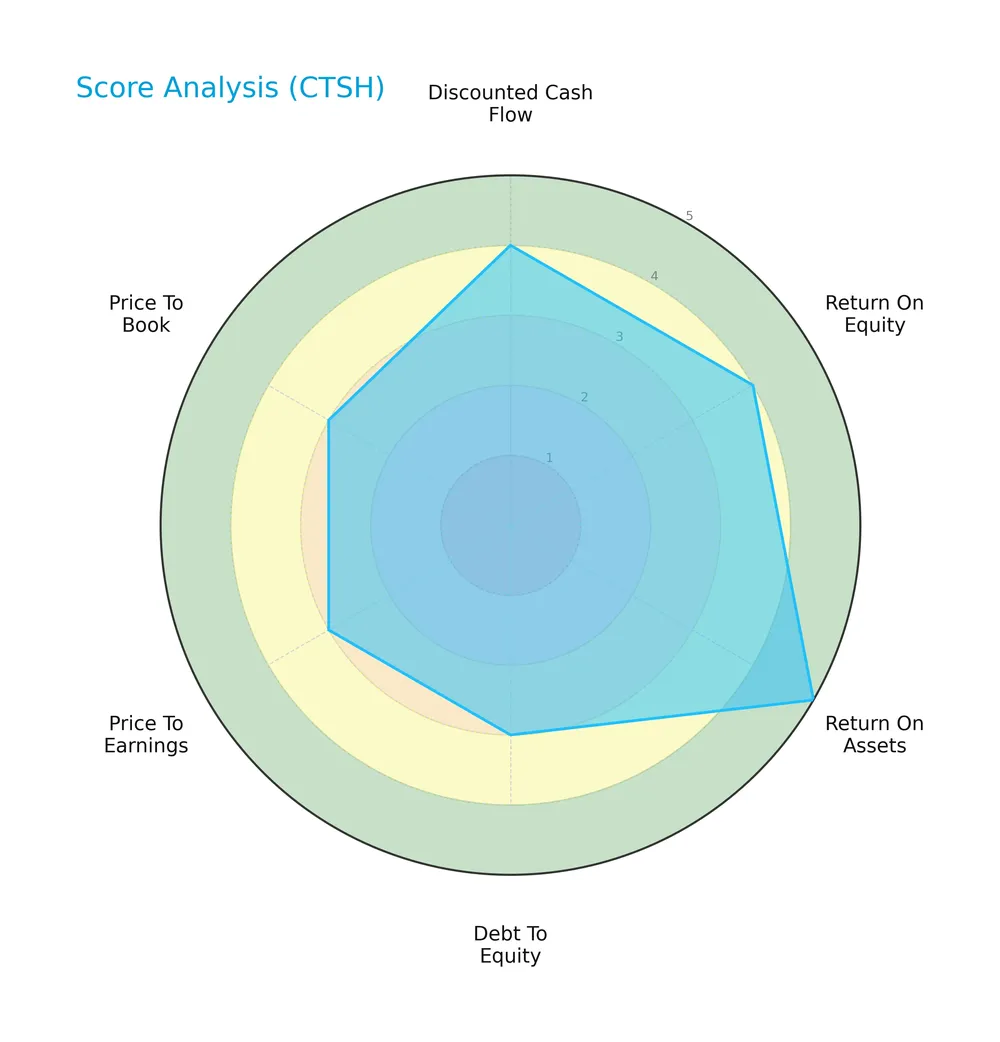
The company scores favorably in discounted cash flow and return on equity, with a very favorable return on assets. Debt to equity, price to earnings, and price to book ratios hold moderate scores, reflecting balanced financial metrics.
Analysis of the company’s bankruptcy risk
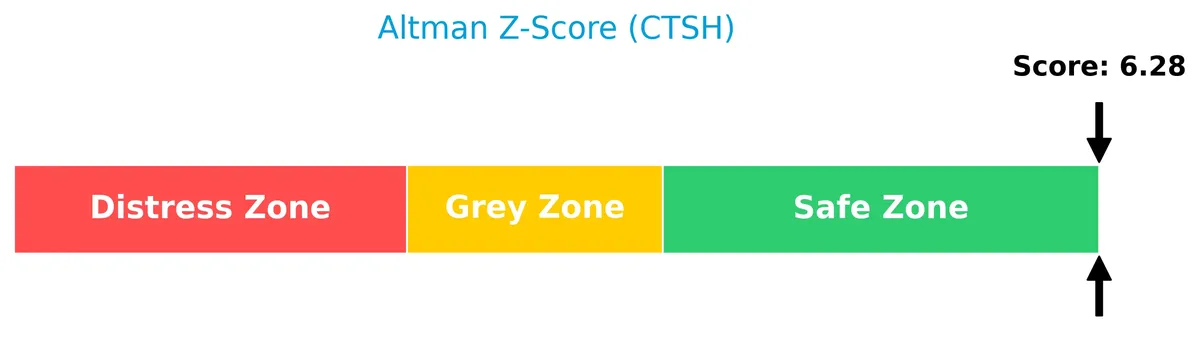
The Altman Z-Score places the company firmly in the safe zone, indicating a low risk of bankruptcy and strong financial stability:
Is the company in good financial health?
The Piotroski diagram below reflects a strong financial health score for the company:
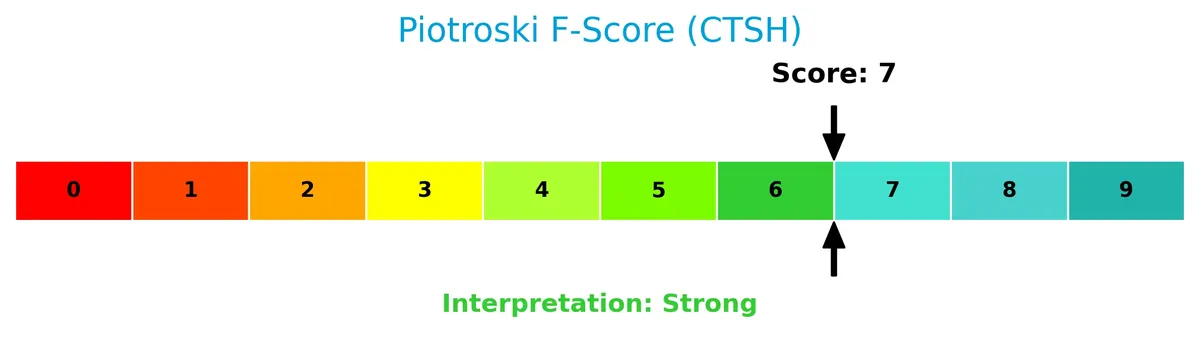
With a Piotroski Score of 7, Cognizant demonstrates strong profitability, liquidity, and operational efficiency, supporting its overall financial robustness.
Competitive Landscape & Sector Positioning
This analysis examines Cognizant Technology Solutions Corporation’s position within the Information Technology Services sector. We will explore its strategic positioning, revenue by segment, key products, and main competitors. I will assess whether Cognizant holds a competitive advantage over its peers.
Strategic Positioning
Cognizant Technology Solutions maintains a diversified portfolio across four key segments: Financial Services, Healthcare, Products and Resources, and Communications, Media and Technology. Geographically, it concentrates primarily in North America and Europe, generating over 90% of its 2025 revenue from these regions, reflecting a balanced yet focused global presence.
Revenue by Segment
The pie chart depicts Cognizant Technology Solutions Corporation’s revenue distribution by segment for fiscal year 2025, highlighting the contribution of key business units.

In 2025, Healthcare remains the largest revenue driver at $6.3B, closely followed by Financial Services at $6.2B. Products and Resources and Communication, Media and Technology contribute $5.3B and $3.3B, respectively. The steady growth in Healthcare and Financial Services signals solid sector demand, while Communication’s slower rise suggests modest expansion. This balance reduces concentration risk, ensuring diversified revenue streams for Cognizant.
Key Products & Brands
The company generates revenue through four primary segments and their related services:
| Product | Description |
|---|---|
| Financial Services | Consulting, technology, and outsourcing services for banking, digital lending, fraud detection, payments. |
| Healthcare Segment | Services improving clinical development, pharmacovigilance, claims processing, and patient experience. |
| Products and Resources | Solutions for manufacturers, retailers, travel, logistics, energy, and utilities sectors. |
| Communication, Media and Technology | Digital content, personalized user experience, digital engineering for media, entertainment, and tech companies. |
Cognizant’s revenue mix reflects broad industry coverage with strong footholds in financial services and healthcare. These segments consistently generate over half of the total revenue, highlighting the company’s strategic focus.
Main Competitors
The Technology sector includes 16 competitors, with this table listing the top 10 leaders by market capitalization:
| Competitor | Market Cap. |
|---|---|
| International Business Machines Corporation | 272B |
| Accenture plc | 162B |
| Cognizant Technology Solutions Corporation | 40B |
| Fiserv, Inc. | 36B |
| Fidelity National Information Services, Inc. | 34B |
| Wipro Limited | 30B |
| Leidos Holdings, Inc. | 23B |
| Gartner, Inc. | 18B |
| CDW Corporation | 17B |
| Jack Henry & Associates, Inc. | 13B |
Cognizant ranks 3rd among its competitors, holding about 11.7% of the top market cap leader’s scale. It sits below the average market cap of the top 10 (65B) but above the sector median (18B). The company maintains a significant 410% gap over the next competitor above, highlighting its strong relative position.
Comparisons with competitors
Check out how we compare the company to its competitors:
Does CTSH have a competitive advantage?
Cognizant Technology Solutions Corporation shows a competitive advantage with a ROIC exceeding WACC by 4.38%, signaling value creation despite a declining profitability trend. Its 33.7% gross margin and 17.2% EBIT margin compare favorably within the Information Technology Services sector.
Looking ahead, Cognizant leverages growth opportunities in digital automation, AI-driven analytics, and sector-specific solutions across financial services, healthcare, and communications. Expansion in North America and Europe supports revenue growth, driven by evolving customer experience and operational improvement services.
SWOT Analysis
This analysis highlights Cognizant Technology Solutions Corporation’s core strengths, weaknesses, opportunities, and threats to guide strategic decisions.
Strengths
- Strong market position in IT services
- Favorable margins and ROIC above WACC
- Diversified client base across sectors and regions
Weaknesses
- Declining ROIC trend signals profitability pressure
- Net margin growth negative over period
- Moderate valuation multiples limit upside
Opportunities
- Growing demand for digital transformation and AI services
- Expansion potential in healthcare and financial sectors
- Increasing outsourcing trends globally
Threats
- Intense competition from global IT firms
- Rapid technology changes require constant innovation
- Geopolitical risks affecting international revenues
Cognizant’s solid fundamentals and market reach create value, but managing profitability decline is crucial. The company must leverage digital growth areas while mitigating competitive and geopolitical risks to sustain its moat.
Stock Price Action Analysis
The weekly stock chart below illustrates Cognizant Technology Solutions Corporation’s price movements over the past 12 months:
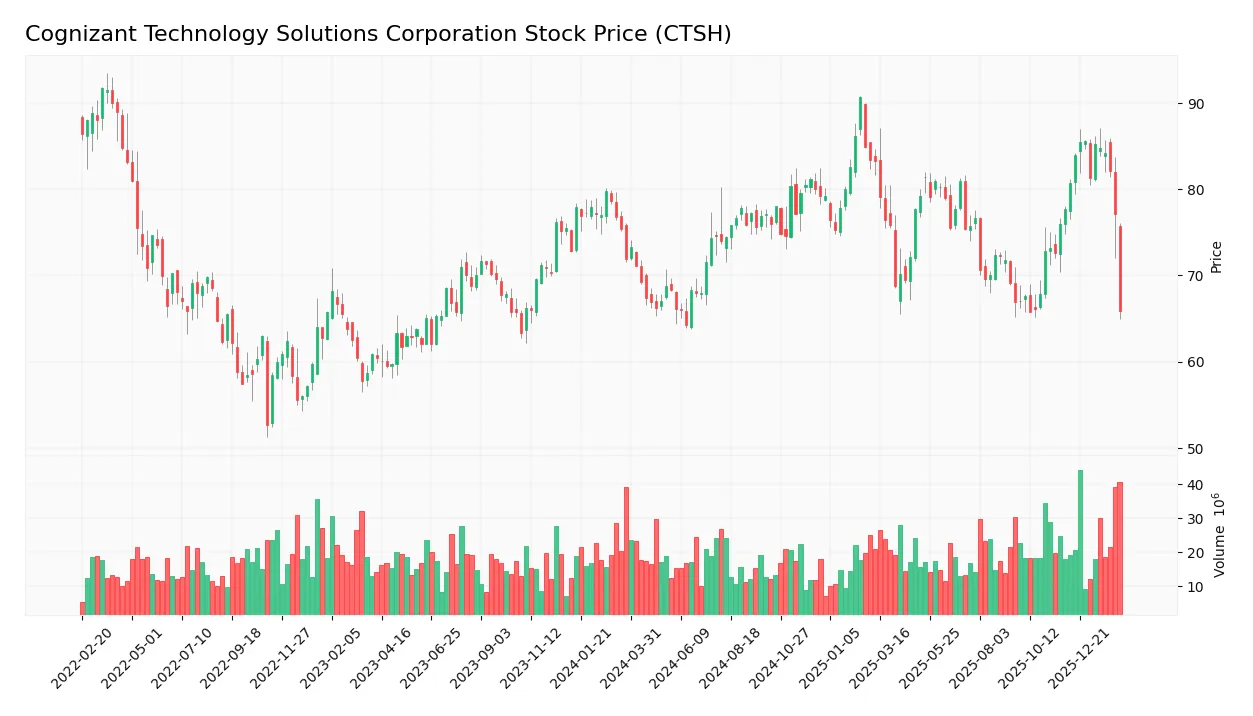
Trend Analysis
Over the past 12 months, the stock price declined by 8.44%, confirming a bearish trend. The trend shows deceleration with a high volatility level, reflected by a 5.85 standard deviation. The price ranged between 64.26 at its low and 90.7 at its peak, without reversal signs.
Volume Analysis
Trading volume increased overall, with sellers accounting for 54.07% of activity, indicating a seller-driven market. In the recent period, seller dominance grew slightly stronger at 55.65%, suggesting cautious investor sentiment and sustained selling pressure.
Target Prices
Analysts set a clear consensus target for Cognizant Technology Solutions Corporation.
| Target Low | Target High | Consensus |
|---|---|---|
| 82 | 107 | 92.1 |
The target range suggests moderate upside potential, with a consensus price near 92. Investors expect steady performance relative to current levels.

Don’t Let Luck Decide Your Entry Point
Optimize your entry points with our advanced ProRealTime indicators. You’ll get efficient buy signals with precise price targets for maximum performance. Start outperforming now!
Analyst & Consumer Opinions
This section examines the latest analyst ratings and consumer feedback regarding Cognizant Technology Solutions Corporation (CTSH).
Stock Grades
Here are the latest verified analyst grades for Cognizant Technology Solutions Corporation, reflecting recent consensus and rating actions:
| Grading Company | Action | New Grade | Date |
|---|---|---|---|
| RBC Capital | Maintain | Sector Perform | 2026-02-05 |
| Morgan Stanley | Maintain | Equal Weight | 2026-02-05 |
| TD Cowen | Maintain | Hold | 2026-02-05 |
| Guggenheim | Maintain | Buy | 2026-01-28 |
| Citigroup | Maintain | Neutral | 2026-01-22 |
| Wells Fargo | Maintain | Overweight | 2026-01-14 |
| TD Cowen | Maintain | Hold | 2026-01-09 |
| UBS | Maintain | Neutral | 2025-12-08 |
| William Blair | Upgrade | Outperform | 2025-11-21 |
| RBC Capital | Maintain | Sector Perform | 2025-10-30 |
The grades exhibit a stable outlook with most firms maintaining their positions. Notably, William Blair upgraded to Outperform, signaling selective optimism amid a generally cautious consensus centered on Hold.
Consumer Opinions
Consumers express a mixed but generally favorable view of Cognizant Technology Solutions Corporation’s services.
| Positive Reviews | Negative Reviews |
|---|---|
| Reliable IT solutions with strong project management. | Occasional delays in delivery affecting timelines. |
| Responsive customer support team addressing issues quickly. | Some pricing concerns; seen as premium compared to peers. |
| Innovative approach to digital transformation projects. | Communication gaps during complex implementations. |
Overall, clients appreciate Cognizant’s reliability and innovation. However, recurring concerns about delivery delays and pricing warrant caution for cost-sensitive buyers.
Risk Analysis
Below is a summary of key risks facing Cognizant Technology Solutions Corporation, assessing their likelihood and potential impact:
| Category | Description | Probability | Impact |
|---|---|---|---|
| Market Volatility | Recent 7% share price drop reflects sensitivity to tech sector swings and macroeconomic shifts. | Medium | High |
| Competitive Pressure | Intense competition in IT services could pressure margins and client retention. | High | Medium |
| Technological Change | Rapid tech evolution demands constant innovation; failure risks obsolescence. | Medium | High |
| Regulatory Risks | Data privacy and international regulations could increase compliance costs. | Low | Medium |
| Currency Fluctuations | Global operations expose revenue to currency exchange risks. | Medium | Low |
The most pressing risks are competitive pressure and technological change, both likely to affect Cognizant’s margins and growth potential. The recent 7% stock drop highlights market sensitivity amid sector volatility. However, strong liquidity (current ratio 2.34) and a robust Altman Z-Score (6.28 in safe zone) mitigate bankruptcy concerns. Investors should monitor sector dynamics closely.
Should You Buy Cognizant Technology Solutions Corporation?
Cognizant appears to be a profitable company with strong value creation, supported by a slightly favorable moat despite declining ROIC. Its leverage profile seems manageable, and the overall rating of A suggests a very favorable financial health profile.
Strength & Efficiency Pillars
Cognizant Technology Solutions Corporation exhibits solid operational efficiency with a net margin of 10.56% and a ROIC of 12.31%, comfortably exceeding its WACC of 7.93%. This differential confirms the company as a value creator. Its EBIT margin stands at a favorable 17.16%, reflecting disciplined cost management. The firm’s strong current and quick ratios (2.34 each) signal robust liquidity. Overall, Cognizant demonstrates a sound blend of profitability and capital efficiency, aligning well with industry benchmarks.
Weaknesses and Drawbacks
The company presents moderate valuation risks with a P/E of 17.9 and a P/B of 2.66, indicating fair but not cheap pricing. While leverage is low at a debt-to-equity ratio of 0.1, the recent 6.92% decline in net margin growth signals margin pressure. Technical trends reveal a bearish overall stock trend with a recent 15.29% price drop and seller dominance at 55.65%, suggesting short-term market skepticism. These factors introduce caution in timing new investments.
Our Final Verdict about Cognizant Technology Solutions Corporation
Cognizant’s fundamentals reflect a value-creating firm with strong liquidity and solid profitability. However, the bearish market trend and recent seller dominance suggest investors might consider a wait-and-see stance for a more favorable entry point. The company’s profile may appear attractive for long-term exposure but could face near-term volatility due to market sentiment.
Disclaimer: This content is for informational purposes only and does not constitute financial, investment, or other professional advice. Investing in financial markets involves a significant risk of loss, and past performance is not indicative of future results.
Additional Resources
- COGNIZANT TECHNOLOGY SOLUTIONS CORP SEC 10-K Report – TradingView (Feb 12, 2026)
- Cognizant Technology Solutions Corporation (CTSH) Rebounded from Challenges – Yahoo Finance (Feb 03, 2026)
- ING Groep NV Sells 422,253 Shares of Cognizant Technology Solutions Corporation $CTSH – MarketBeat (Feb 11, 2026)
- Cognizant lands three-year deal with DAMAC to manage IT infrastructure – Seeking Alpha (Feb 10, 2026)
- DAMAC Group works with Cognizant as strategic partner to transform IT operations and elevate customer experience – Finviz (Feb 10, 2026)
For more information about Cognizant Technology Solutions Corporation, please visit the official website: cognizant.com