Cognex Corporation is revolutionizing the landscape of manufacturing and distribution with its state-of-the-art machine vision products, fundamentally transforming how industries operate. Known for its innovative spirit, Cognex empowers a diverse range of sectors—from consumer electronics to pharmaceuticals—with technology that enhances efficiency and accuracy. As I delve into the investment potential of Cognex, I will assess whether its robust fundamentals can support its current market valuation and growth trajectory moving forward.
Table of contents
Company Description
Cognex Corporation, founded in 1981 and headquartered in Natick, Massachusetts, is a prominent player in the machine vision sector, specializing in hardware and software solutions that enhance manufacturing and distribution processes. The company’s core offerings include advanced vision systems, inspection tools, and deep learning software, which are integral in industries such as consumer electronics, automotive, pharmaceuticals, and food and beverage. With a market capitalization of approximately $6.6 billion and a robust global presence, Cognex operates primarily in North America, Europe, and Asia. The company’s commitment to innovation and efficiency positions it as a leader in automating complex tasks, shaping the future of manufacturing through technology integration.
Fundamental Analysis
In this section, I will analyze Cognex Corporation’s income statement, key financial ratios, and payout policy to provide insight into its financial health and investment potential.
Income Statement
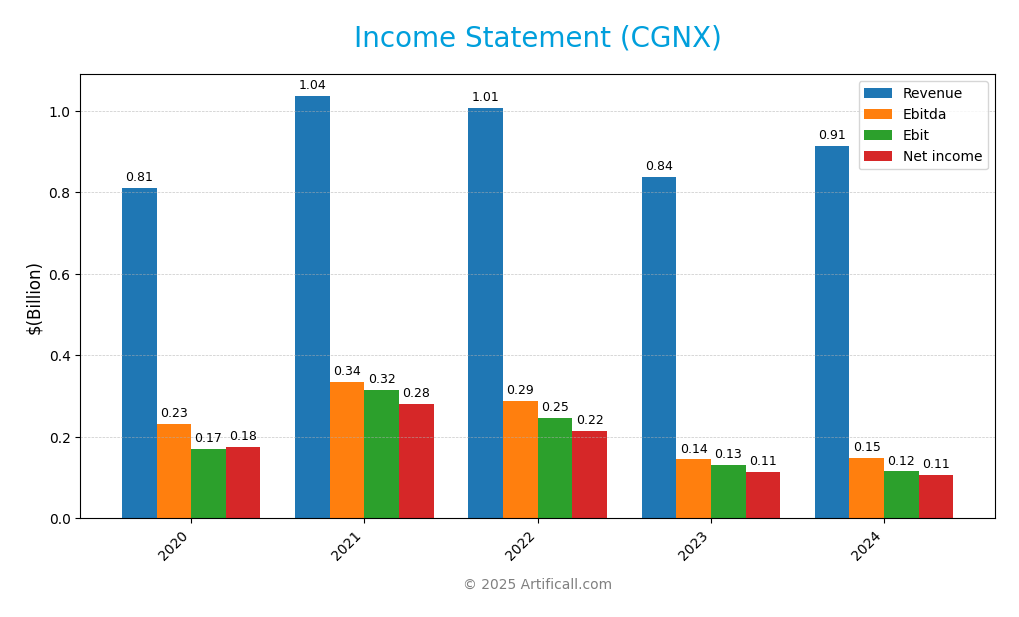
The following table summarizes the income statement for Cognex Corporation (CGNX) over the last five years, reflecting key financial metrics that are crucial for evaluating the company’s performance.
| Metric | 2020 | 2021 | 2022 | 2023 | 2024 |
|---|---|---|---|---|---|
| Revenue | 811M | 1.037B | 1.006B | 838M | 915M |
| Cost of Revenue | 206M | 277M | 284M | 236M | 289M |
| Operating Expenses | 434M | 445M | 476M | 471M | 511M |
| Gross Profit | 605M | 760M | 722M | 601M | 626M |
| EBITDA | 233M | 335M | 288M | 145M | 148M |
| EBIT | 171M | 315M | 246M | 131M | 115M |
| Interest Expense | 0 | 0 | 0 | 0 | 0 |
| Net Income | 176M | 280M | 216M | 113M | 106M |
| EPS | 1.02 | 1.59 | 1.24 | 0.66 | 0.62 |
| Filing Date | 2021-02-11 | 2022-02-17 | 2023-02-16 | 2024-02-15 | 2025-02-13 |
In analyzing Cognex Corporation’s financial performance, I observe a general decline in revenue from a peak of $1.006 billion in 2022 to $915 million in 2024. This trend reflects a challenging environment, possibly due to market saturation or increased competition. Net income also declined, from $216 million in 2022 to $106 million in 2024, indicating pressure on profitability. The gross profit margin has remained relatively stable, suggesting effective cost management despite revenue fluctuations. In 2024, EBITDA showed a slight recovery, indicating better operational efficiency compared to the previous year, although overall growth appears to have slowed. It’s essential for investors to monitor these trends closely.
Financial Ratios
The following table presents the financial ratios for Cognex Corporation (CGNX) over the last five years, allowing investors to assess its financial performance and stability.
| Ratio | 2020 | 2021 | 2022 | 2023 | 2024 |
|---|---|---|---|---|---|
| Net Margin | 21.72% | 26.99% | 21.42% | 13.52% | 11.61% |
| ROE | 13.96% | 19.57% | 14.98% | 7.53% | 6.99% |
| ROIC | 10.22% | 17.36% | 13.91% | 7.00% | 6.31% |
| P/E | 79.06 | 49.03 | 37.90 | 63.49 | 57.90 |
| P/B | 11.04 | 9.60 | 5.68 | 4.78 | 4.05 |
| Current Ratio | 4.55 | 3.39 | 3.82 | 4.47 | 3.62 |
| Quick Ratio | 4.09 | 2.79 | 3.17 | 3.40 | 2.69 |
| D/E | 0.021 | 0.018 | 0.028 | 0.052 | 0.046 |
| Debt-to-Assets | 1.46% | 1.28% | 2.03% | 3.90% | 3.52% |
| Interest Coverage | N/A | N/A | N/A | N/A | N/A |
| Asset Turnover | 0.45 | 0.52 | 0.51 | 0.42 | 0.46 |
| Fixed Asset Turnover | 7.97 | 10.30 | 8.57 | 4.63 | 5.52 |
| Dividend Yield | 2.80% | 0.32% | 0.56% | 0.68% | 0.85% |
Interpretation of Financial Ratios
The most recent ratios for 2024 indicate a decline in profitability, with a net margin of 11.61% and a return on equity (ROE) of 6.99%, both lower than previous years. The P/E ratio remains high at 57.90, suggesting that the stock may be overvalued relative to its earnings. Additionally, the current and quick ratios reflect strong liquidity, though the rising debt levels may warrant further attention.
Evolution of Financial Ratios
Over the past five years, Cognex Corporation’s financial ratios show a trend of decreasing profitability and returns, with net margins and ROE declining significantly. However, liquidity ratios remain robust, indicating the company maintains a strong short-term financial position despite increasing debt levels.
Distribution Policy
Cognex Corporation (CGNX) currently pays dividends, with a payout ratio of approximately 49.3%. The annual dividend yield is around 0.85%, reflecting a consistent commitment to returning value to shareholders. However, the company also engages in share buybacks, which can enhance shareholder value but raises concerns if done excessively. Balancing dividend payments and repurchases is crucial for sustainable long-term value creation, especially in light of potential risks associated with high payout ratios.
Sector Analysis
Cognex Corporation operates in the hardware, equipment, and parts industry, specializing in machine vision products that enhance manufacturing automation. Key competitors include Keyence and Omron, while its competitive advantages lie in proprietary software and a strong market presence. A SWOT analysis highlights strengths in innovation, weaknesses in market dependency, opportunities in expanding automation sectors, and threats from emerging technologies.
Strategic Positioning
Cognex Corporation (CGNX) holds a significant position in the machine vision market, boasting a robust market share thanks to its innovative products and solutions that automate manufacturing and distribution processes. The competitive landscape is intense, with pressure from both established players and emerging tech disruptors. Cognex’s ability to adapt to technological advancements, such as integrating deep learning into its vision systems, enhances its competitive edge. However, investors should remain cautious about potential market fluctuations and the impact of rapid technological changes on its market share.
Key Products
Cognex Corporation specializes in machine vision products that enhance automation in manufacturing and distribution. Below is a table outlining some of their key products:
| Product | Description |
|---|---|
| VisionPro Software | A suite of patented vision tools designed for advanced programming of machine vision applications. |
| QuickBuild | A user-friendly tool that allows customers to create vision applications using a graphical interface. |
| Cognex Deep Learning | Advanced software that utilizes deep learning techniques for enhanced visual recognition and analysis. |
| In-Sight Vision Systems | A product line of vision systems and sensors for tasks such as inspection and quality control. |
| DataMan | Image-based barcode readers and verifiers used in various industries for tracking and identification. |
These products are essential for automating processes in sectors such as consumer electronics, automotive, and pharmaceuticals, making Cognex a leader in the machine vision industry.
Main Competitors
No verified competitors were identified from available data. However, based on my analysis, Cognex Corporation holds a substantial market share within the machine vision technology sector, particularly in North America. The company is well-positioned in its niche, focusing on automation solutions for various industries including consumer electronics, automotive, and pharmaceuticals.
Competitive Advantages
Cognex Corporation stands out in the machine vision industry due to its robust portfolio of innovative products and strong market presence. The company’s advanced technologies, such as the VisionPro software and DataMan barcode readers, provide significant automation solutions across various sectors, including automotive and pharmaceuticals. Looking ahead, Cognex is well-positioned to exploit emerging markets and applications in areas like artificial intelligence and deep learning, which can enhance its product offerings. This strategic focus on innovation and diversification is likely to create additional growth opportunities, solidifying its competitive edge in the industry.
SWOT Analysis
The SWOT analysis evaluates Cognex Corporation’s strengths, weaknesses, opportunities, and threats to inform strategic decisions.
Strengths
- Strong market position
- Innovative product offerings
- Diverse customer base
Weaknesses
- High dependence on specific industries
- Limited global presence
- Relatively high price point
Opportunities
- Growing demand for automation
- Expansion into emerging markets
- Advancements in AI technology
Threats
- Intense competition
- Economic downturns
- Rapid technological changes
Overall, Cognex Corporation demonstrates a robust position with promising growth opportunities, yet it must address its vulnerabilities and external threats to sustain its market leadership and drive long-term success.
Stock Analysis
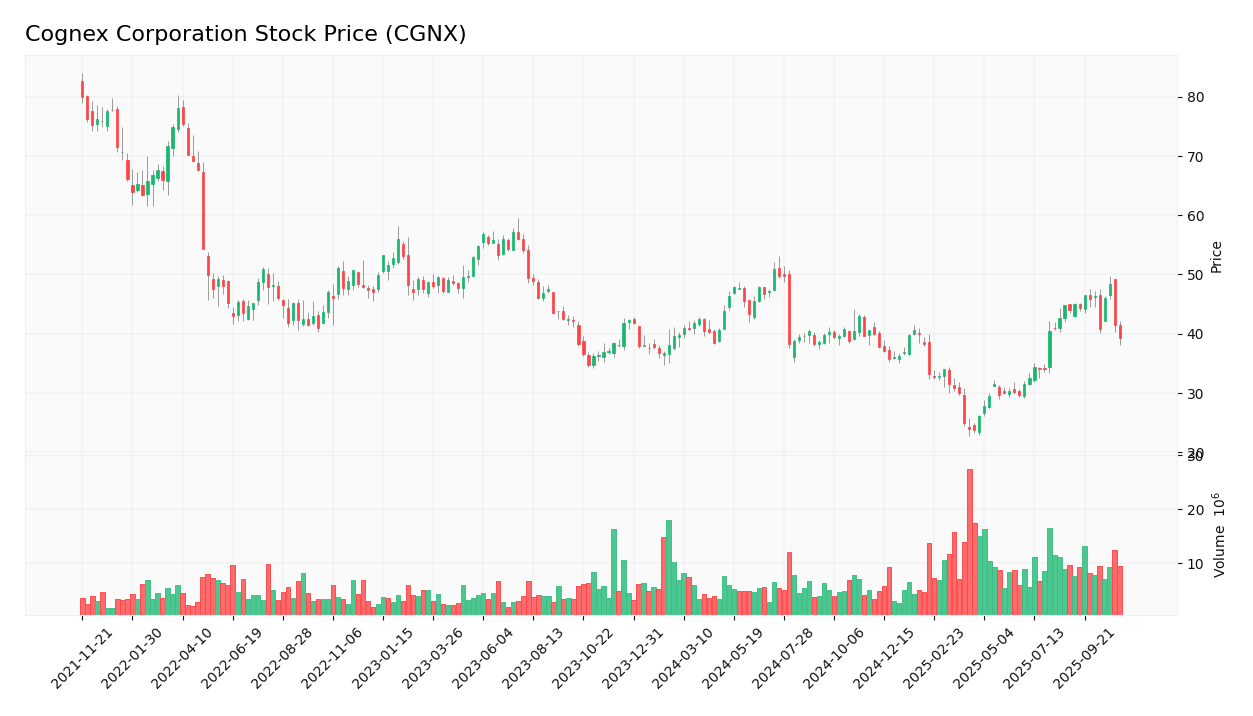
Over the past year, Cognex Corporation (CGNX) has experienced significant price movements, reflecting a bearish trend characterized by a -6.14% change in stock price. This analysis will delve into the key trading dynamics and highlight the volatility observed in the company’s stock.
Trend Analysis
Analyzing the stock’s performance over the last two years reveals a -6.14% decrease in price, indicating a bearish trend. The stock’s highest price reached $50.98, while the lowest was $23.77, suggesting considerable volatility with a standard deviation of 5.93. The trend has been marked by deceleration, indicating a slowdown in price decline recently. Notably, in the recent period from August 24, 2025, to November 9, 2025, the stock saw a more pronounced drop of -12.27%, further affirming the bearish outlook.
Volume Analysis
Over the last three months, trading volumes have averaged approximately 9.40M shares per day. The activity has been predominantly seller-driven, as indicated by the average sell volume of 4.90M shares compared to 4.50M in buy volume. Despite this, the overall volume trend is classified as bullish, with an increasing average volume of 9.40M, suggesting heightened market participation. However, the recent buyer volume proportion stands at 47.9%, highlighting a prevailing seller dominance in the market sentiment.
Analyst Opinions
Recent analysis of Cognex Corporation (CGNX) presents a mixed outlook. On November 7, 2025, analysts provided a consensus rating of “Neutral,” with a score of 3 out of 5. While the Return on Assets (ROA) received a “Buy” recommendation (score of 4), the Price-to-Earnings (PE) ratio drew a “Strong Sell” (score of 1). Analysts highlight concerns over valuation metrics, particularly suggesting that the stock may be overvalued at its current price. Thus, the overall consensus leans towards a cautious stance rather than a clear buy or sell recommendation.
Stock Grades
No verified stock grades were available from recognized analysts for Cognex Corporation (CGNX). This lack of grading data makes it difficult to assess the current sentiment among traders and investors. However, it is important to monitor the company’s performance and market position closely, as this can provide valuable insights into potential investment opportunities.
Target Prices
No verified target price data is available from recognized analysts for Cognex Corporation (CGNX). This limitation highlights the uncertainty in market sentiment surrounding the stock at this time.
Consumer Opinions
Consumer sentiment around Cognex Corporation (CGNX) reveals a complex landscape of satisfaction and concern among its users.
| Positive Reviews | Negative Reviews |
|---|---|
| “Cognex’s vision systems are top-notch; they significantly improve our production efficiency.” | “Customer service could be better; response times are often slow.” |
| “The product quality is unparalleled; we’ve seen a great return on investment.” | “Prices are on the higher side compared to competitors.” |
| “Their technology is innovative and reliable, making our automation seamless.” | “Software updates can be buggy and require frequent fixes.” |
Overall, consumer feedback highlights Cognex’s exceptional product quality and innovative technology as major strengths, while slow customer service and high prices are common concerns among users.
Risk Analysis
In evaluating Cognex Corporation (CGNX), it’s essential to understand the potential risks that could impact investment performance. Below is a summary of key risks associated with the company.
| Category | Description | Probability | Impact |
|---|---|---|---|
| Market Risk | Fluctuations in demand for machine vision systems may affect revenues. | High | High |
| Technology Risk | Rapid technological advancements could render current products obsolete. | Medium | High |
| Regulatory Risk | Changes in regulations related to automation and AI could impose new compliance costs. | Medium | Medium |
| Supply Chain Risk | Disruptions in the supply chain could hinder production capabilities. | High | Medium |
The most pressing risks for Cognex Corporation involve market fluctuations and technological advancements, both of which can significantly impact its revenue and competitive position.
Should You Buy Cognex Corporation?
Cognex Corporation (CGNX) has demonstrated strong financial metrics with a net profit margin of 11.61%, a return on invested capital (ROIC) of 6.31%, and a weighted average cost of capital (WACC) that suggests a healthy investment environment. However, the company is currently facing a bearish market trend and has shown signs of seller dominance in volume analysis.
Based on the recent net margin, which is positive, and the ROIC being slightly above the WACC, there are favorable indicators for long-term investment. However, the long-term trend is negative, and buyer volumes are currently not dominant, suggesting that it may be prudent to wait for a bullish reversal and a return of buyer volumes before making a significant investment.
Cognex faces specific risks from increasing competition within the automation sector and potential supply chain disruptions, which could affect its market position and profitability.
Disclaimer: This article is not financial advice. Each investor is responsible for their own investment decisions.
Additional Resources
- World Investment Advisors Takes Position in Cognex Corporation $CGNX – MarketBeat (Nov 06, 2025)
- DA Davidson Maintains Cognex (CGNX) Neutral Recommendation – Nasdaq (Nov 04, 2025)
- Cognex (NASDAQ: CGNX) to present at Baird Nov 11 and Stephens Nov 19 conferences – Stock Titan (Nov 04, 2025)
- Cognex: Expansion Into The Logistics Market May Grow Profitability Into 2026 – Seeking Alpha (Nov 03, 2025)
- The Price Is Right For Cognex Corporation (NASDAQ:CGNX) – 富途牛牛 (Nov 06, 2025)
For more information about Cognex Corporation, please visit the official website: cognex.com