Home > Analyses > Technology > Cognex Corporation
Cognex Corporation powers the automated vision systems that shape manufacturing worldwide. Its machine vision products inspect, identify, and guide production lines for industries from automotive to pharmaceuticals. Known for innovation and precision, Cognex drives efficiency with its patented software and sensor technologies. As competition intensifies and technology evolves, I ask whether Cognex’s strong fundamentals still justify its premium valuation and growth prospects in 2026.
Table of contents
Business Model & Company Overview
Cognex Corporation, founded in 1981 and headquartered in Natick, Massachusetts, commands a leading position in machine vision technology. It delivers an integrated ecosystem of vision systems, sensors, and software that automate manufacturing and distribution tasks. Cognex’s solutions streamline identification, inspection, and measurement processes across diverse industries, forming a critical backbone for quality and efficiency in global production lines.
The company’s revenue engine balances sales of hardware like In-Sight vision sensors and DataMan barcode readers with high-value software tools such as VisionPro and deep learning vision software. Cognex serves major markets in the Americas, Europe, and Asia, leveraging a broad network of distributors and integrators. Its robust portfolio and global reach create a durable economic moat, positioning it to shape the future of industrial automation.
Financial Performance & Fundamental Metrics
I will analyze Cognex Corporation’s income statement, key financial ratios, and dividend payout policy to reveal its core financial health and operational efficiency.
Income Statement
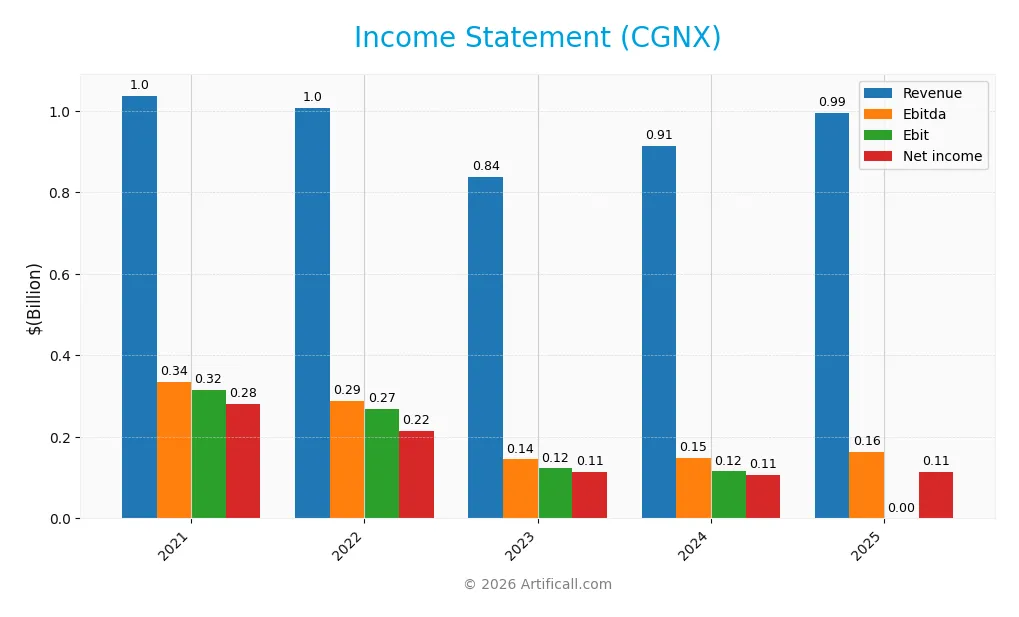
The table below presents Cognex Corporation’s key income statement figures for fiscal years 2021 through 2025, showing revenue progression and profitability metrics.
| 2021 | 2022 | 2023 | 2024 | 2025 | |
|---|---|---|---|---|---|
| Revenue | 1.04B | 1.01B | 838M | 915M | 994M |
| Cost of Revenue | 277M | 284M | 236M | 289M | 329M |
| Operating Expenses | 445M | 476M | 471M | 511M | 503M |
| Gross Profit | 760M | 722M | 601M | 626M | 665M |
| EBITDA | 335M | 288M | 145M | 148M | 163M |
| EBIT | 315M | 269M | 123M | 115M | 0 |
| Interest Expense | 0 | 0 | 0 | 0 | 0 |
| Net Income | 280M | 216M | 113M | 106M | 114M |
| EPS | 1.59 | 1.24 | 0.66 | 0.62 | 0.68 |
| Filing Date | 2022-02-17 | 2023-02-16 | 2024-02-15 | 2025-02-13 | 2026-02-12 |
Income Statement Evolution
Cognex’s revenue showed a modest 8.7% increase from 2024 to 2025 after a general decline over 2021-2025. Gross margin remained favorable at 66.9%, reflecting stable cost control. However, EBIT margin dropped sharply to zero in 2025, signaling a significant operational profit contraction despite net margin holding at a positive 11.5%.
Is the Income Statement Favorable?
In 2025, Cognex reported $994M revenue with $114M net income, yielding an 11.5% net margin, which remains favorable. Yet, EBIT margin fell to zero, indicating operating income challenges. The company had no interest expense, supporting profitability. Overall, half the income metrics appear favorable while others signal caution, resulting in a neutral fundamental stance.
Financial Ratios
The table below presents key financial ratios for Cognex Corporation (CGNX) over the last five fiscal years, illustrating profitability, liquidity, leverage, and market valuation metrics:
| Ratios | 2021 | 2022 | 2023 | 2024 | 2025 |
|---|---|---|---|---|---|
| Net Margin | 27% | 21% | 14% | 12% | 12% |
| ROE | 20% | 15% | 8% | 7% | 8% |
| ROIC | 15% | 12% | 6% | 5% | 6% |
| P/E | 49 | 38 | 63 | 58 | 53 |
| P/B | 9.6 | 5.7 | 4.8 | 4.1 | 4.1 |
| Current Ratio | 3.4 | 3.8 | 4.5 | 3.6 | 3.8 |
| Quick Ratio | 2.8 | 3.2 | 3.4 | 2.7 | 3.0 |
| D/E | 0.02 | 0.03 | 0.05 | 0.05 | 0.05 |
| Debt-to-Assets | 1.3% | 2.0% | 3.9% | 3.5% | 3.8% |
| Interest Coverage | 0 | 0 | 0 | 0 | 0 |
| Asset Turnover | 0.52 | 0.51 | 0.42 | 0.46 | 0.49 |
| Fixed Asset Turnover | 10.3 | 8.6 | 4.6 | 5.5 | 6.3 |
| Dividend Yield | 0.3% | 0.6% | 0.7% | 0.9% | 0.9% |
All ratios are rounded for clarity. Interest coverage is reported as zero, indicating negligible or no interest expense relative to operating income in these years.
Evolution of Financial Ratios
Cognex’s Return on Equity (ROE) declined from 19.57% in 2021 to 7.67% in 2025, reflecting reduced profitability. The Current Ratio showed moderate fluctuation but remained above 3.5, indicating stable liquidity. The Debt-to-Equity Ratio stayed very low and stable near 0.05, signaling conservative leverage throughout the period.
Are the Financial Ratios Fovorable?
In 2025, profitability measured by net margin is favorable at 11.5%, but ROE and ROIC lag behind the 10.85% WACC, marking weak capital returns. Liquidity is mixed: the quick ratio is favorable at 3.05, yet the current ratio is flagged unfavorable despite being above 3. Debt levels remain low and favorable with a 0.05 debt-to-equity ratio. Market multiples like P/E (52.8) and P/B (4.05) appear stretched, contributing to an overall unfavorable ratio profile.
Shareholder Return Policy
Cognex Corporation maintains a consistent dividend policy with a payout ratio near 48% and a stable dividend per share growth, yielding about 0.9% annually. The company supports distributions with strong free cash flow coverage and modest share buybacks, reflecting prudent capital allocation.
This balanced approach sustains shareholder returns without risking excessive payouts or buybacks. Such discipline aligns well with long-term value creation, given the company’s solid cash flow generation and conservative leverage.
Score analysis
The radar chart below highlights Cognex Corporation’s key financial scores across valuation, profitability, and leverage metrics:
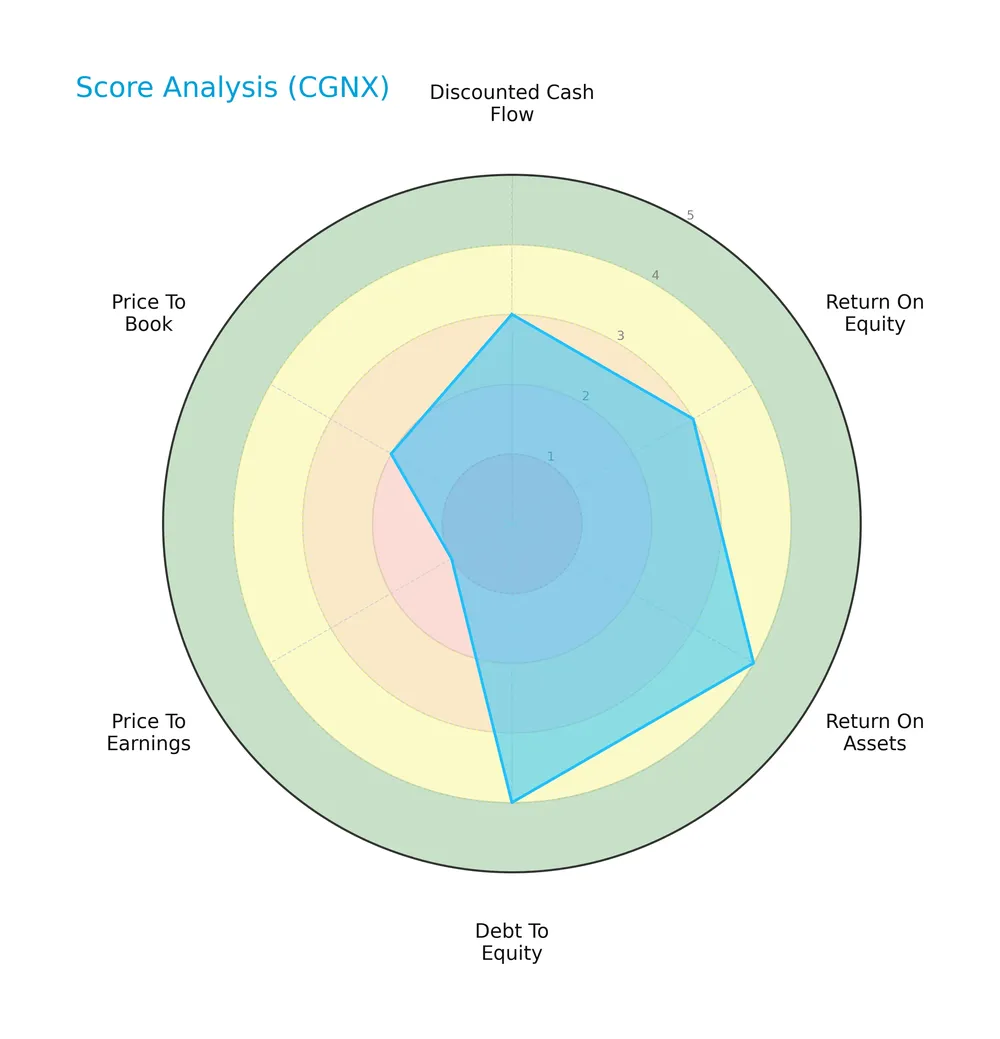
Cognex shows moderate discounted cash flow and return on equity scores at 3 each. Return on assets and debt to equity scores are favorable at 4. Valuation metrics lag, with a very unfavorable PE score of 1 and an unfavorable PB score of 2.
Analysis of the company’s bankruptcy risk
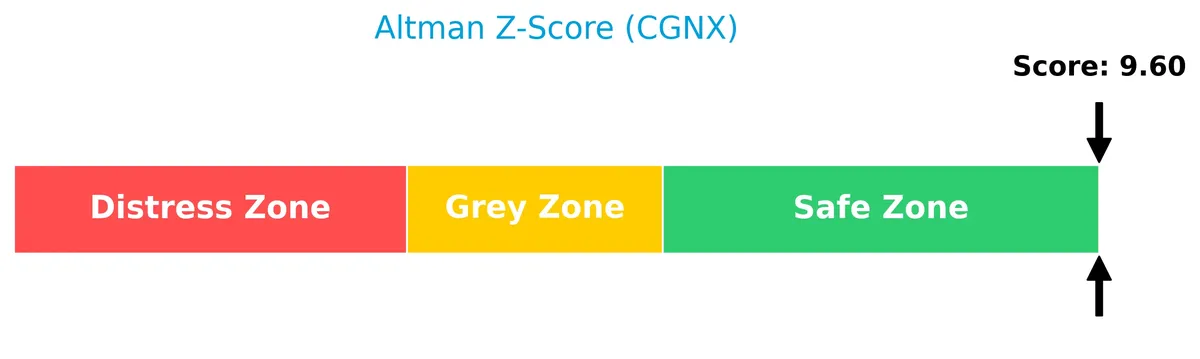
Cognex’s Altman Z-Score places it securely in the safe zone, indicating a low bankruptcy risk:
Is the company in good financial health?
The Piotroski diagram below summarizes Cognex’s financial strength based on nine criteria:
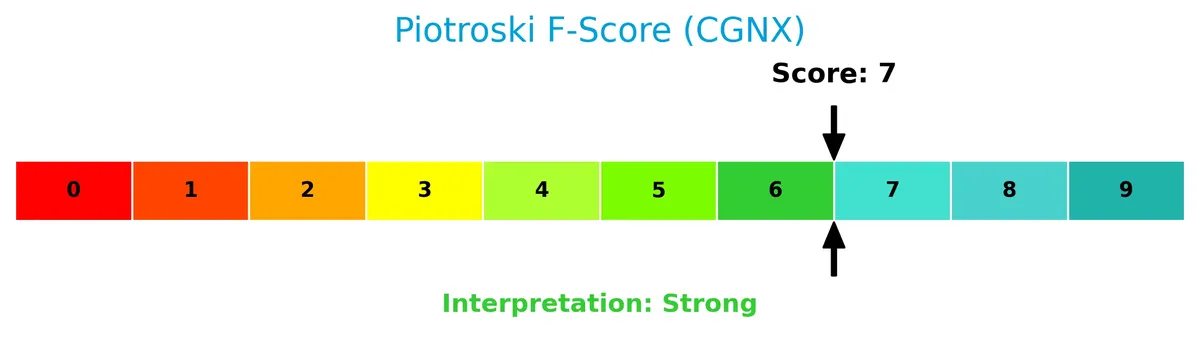
With a strong Piotroski Score of 7, Cognex demonstrates solid financial health, reflecting robust profitability, efficient capital use, and stable liquidity.
Competitive Landscape & Sector Positioning
This analysis examines Cognex Corporation’s sector positioning and competitive environment. I will assess whether Cognex holds a sustainable competitive advantage over its main rivals.
Strategic Positioning
Cognex concentrates on machine vision hardware and software, with 87% of 2024 revenue from standard products. It serves diverse industries globally, generating 35% from Americas, 22% Europe, and 18% from Greater China and other Asia combined.
Revenue by Segment
This pie chart illustrates Cognex Corporation’s revenue distribution by product segment for the fiscal year 2024, highlighting the relative contributions of key business lines.
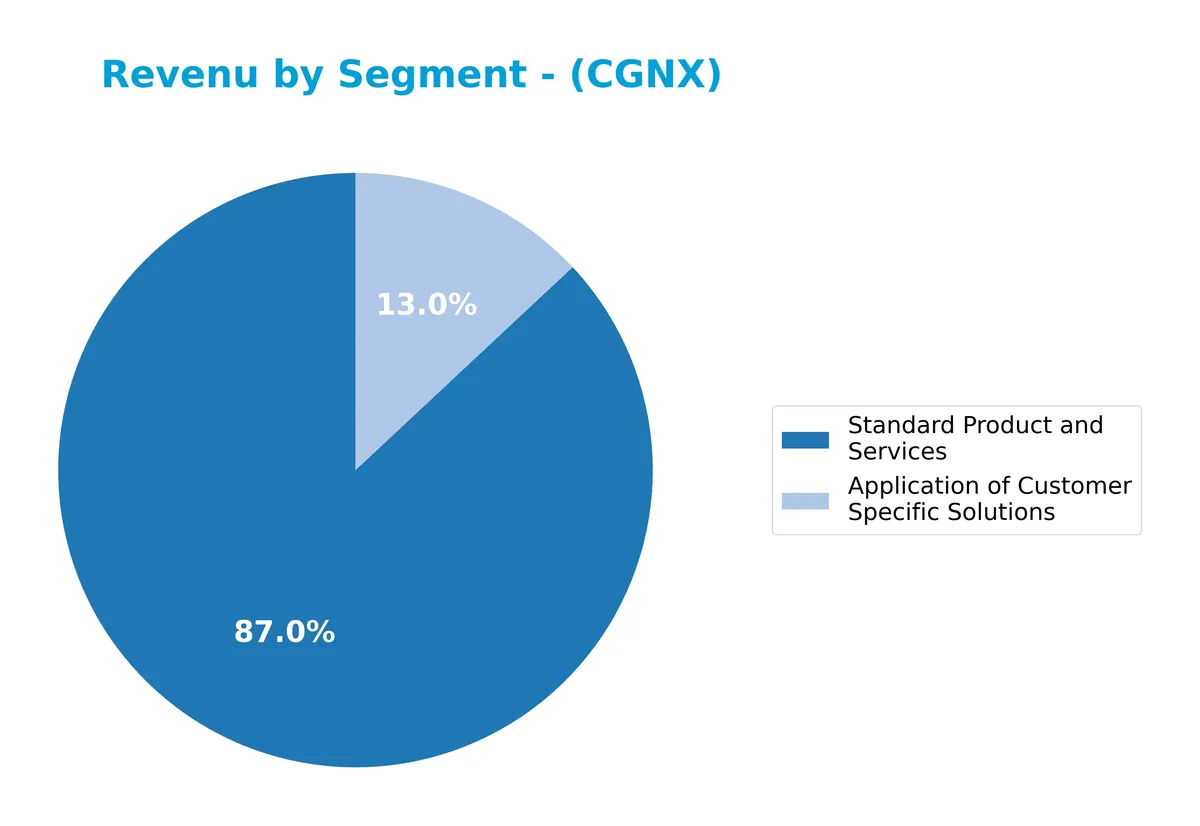
In 2024, Standard Product and Services drove the business with $795M in revenue, dominating over Application of Customer Specific Solutions at $119M. The data reveals a concentration risk as the company depends heavily on its standard offerings. Notably, revenue from customer-specific solutions declined from prior years, signaling a slowdown in this segment and a strategic reliance on standardized products to sustain growth.
Key Products & Brands
The table below summarizes Cognex Corporation’s main product lines and their functions:
| Product | Description |
|---|---|
| VisionPro Software | A suite of patented vision tools for advanced programming of machine vision applications. |
| QuickBuild | Graphical, flowchart-based programming interface enabling rapid vision application building. |
| Cognex Deep Learning Vision Software | AI-powered vision software enhancing pattern recognition and inspection capabilities. |
| In-Sight Product Line | Vision systems and sensors performing tasks like part location, identification, and measurement. |
| DataMan | Image-based barcode readers and barcode verifiers for tracking and quality control. |
| Standard Products and Services | Core machine vision hardware and software offerings, generating majority of revenue (~$795M in 2024). |
| Application of Customer Specific Solutions | Custom-tailored vision solutions to meet unique client manufacturing needs (~$119M in 2024). |
Cognex’s portfolio centers on machine vision technologies that automate discrete item manufacturing and tracking. Their product mix balances standard hardware/software with growing custom solution applications, serving diverse industries like automotive, electronics, and pharmaceuticals.
Main Competitors
Cognex Corporation competes with 20 companies in its sector; the table below lists the top 10 leaders by market capitalization:
| Competitor | Market Cap. |
|---|---|
| Amphenol Corporation | 171B |
| Corning Incorporated | 78B |
| TE Connectivity Ltd. | 69B |
| Sandisk Corporation | 40B |
| Garmin Ltd. | 39B |
| Keysight Technologies, Inc. | 35B |
| Celestica Inc. | 34B |
| Coherent, Inc. | 29B |
| Jabil Inc. | 26B |
| Teledyne Technologies Incorporated | 24B |
Cognex ranks 16th among 20 competitors with a market cap roughly 5.75% the size of the sector leader Amphenol. The company sits below both the average market cap of the top 10 (54B) and the sector median (21.6B). It trails the closest competitor above by approximately 17.67%, highlighting a moderate gap in scale.
Comparisons with competitors
Check out how we compare the company to its competitors:
Does CGNX have a competitive advantage?
Cognex Corporation currently lacks a competitive advantage, as it is destroying value with a declining ROIC well below its WACC. This negative trend signals inefficient capital use and weakening profitability.
Looking ahead, Cognex focuses on expanding its machine vision products across diverse industries and geographic markets. Opportunities include new software tools and deep learning solutions that could potentially improve operational efficiency.
SWOT Analysis
This SWOT analysis highlights Cognex Corporation’s core competitive position and strategic challenges in 2026.
Strengths
- strong gross margin at 67%
- diversified product portfolio in machine vision
- low debt levels with 3.8% debt to assets
Weaknesses
- declining ROIC below WACC reflects value destruction
- high PE ratio at 52.8 signals overvaluation
- weak revenue and net income growth over 5 years
Opportunities
- expanding automation demand in consumer electronics
- growth potential in emerging Asian markets
- advances in AI-powered vision software
Threats
- intense competition in hardware and software
- rapid technological changes risk obsolescence
- geopolitical tensions impacting supply chains
Cognex benefits from robust margins and product diversity but faces serious profitability erosion. Strategic focus must prioritize innovation and geographic expansion while managing valuation risk and competitive pressures.
Stock Price Action Analysis
The weekly stock chart for Cognex Corporation (CGNX) displays price movements over the last 100 weeks, highlighting recent performance dynamics:
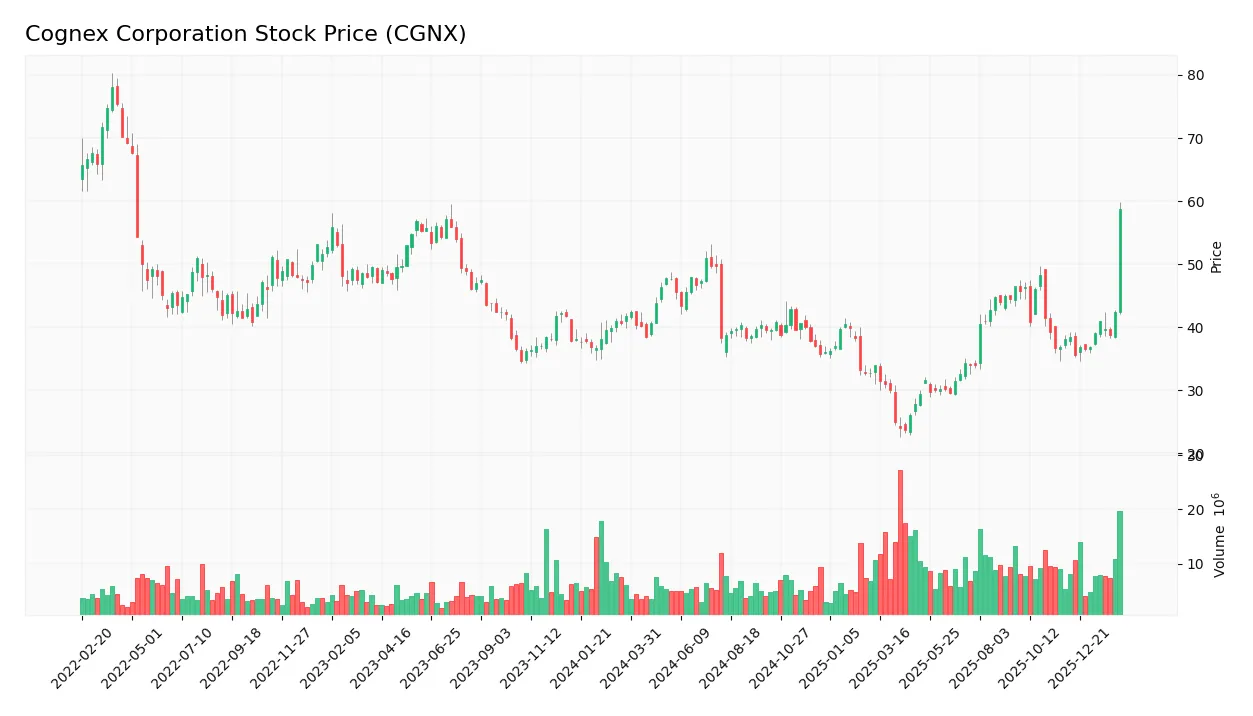
Trend Analysis
Over the past two years, CGNX shares gained 40.19%, confirming a bullish trend with accelerating momentum. Price volatility stands at a standard deviation of 6.25. The stock reached a high of 58.67 and a low of 23.77, signaling strong upward movement without deceleration.
Volume Analysis
Trading volume increased with 946M shares overall, showing a buyer-driven market at 57.24%. In the recent three months, buyer dominance intensified to 72.64%, indicating strong investor confidence and heightened market participation favoring CGNX stock.
Target Prices
Analysts show a balanced target price consensus for Cognex Corporation.
| Target Low | Target High | Consensus |
|---|---|---|
| 38 | 58 | 48.14 |
The target range indicates moderate upside potential, reflecting cautious optimism among analysts.

Don’t Let Luck Decide Your Entry Point
Optimize your entry points with our advanced ProRealTime indicators. You’ll get efficient buy signals with precise price targets for maximum performance. Start outperforming now!
Analyst & Consumer Opinions
This section examines recent analyst ratings and consumer feedback related to Cognex Corporation’s market performance and product reception.
Stock Grades
Here is a summary of recent analyst grades from well-known firms for Cognex Corporation (CGNX):
| Grading Company | Action | New Grade | Date |
|---|---|---|---|
| Needham | Maintain | Buy | 2026-02-12 |
| Barclays | Maintain | Overweight | 2026-01-12 |
| Truist Securities | Maintain | Hold | 2025-12-18 |
| Goldman Sachs | Upgrade | Buy | 2025-12-16 |
| JP Morgan | Downgrade | Underweight | 2025-12-03 |
| DA Davidson | Maintain | Neutral | 2025-11-03 |
| Barclays | Maintain | Overweight | 2025-10-31 |
| Needham | Maintain | Buy | 2025-10-31 |
| Baird | Maintain | Neutral | 2025-10-31 |
| Truist Securities | Maintain | Hold | 2025-10-08 |
The overall grading trend remains mixed with a slight bias toward buy and overweight recommendations. Notably, Goldman Sachs upgraded from sell to buy late in 2025, indicating growing confidence, while JP Morgan showed caution by downgrading to underweight.
Consumer Opinions
Cognex Corporation enjoys a generally favorable reputation among its users, reflecting confidence in its technological edge and product reliability.
| Positive Reviews | Negative Reviews |
|---|---|
| “Exceptional accuracy in barcode reading tech.” | “Customer support response times can lag.” |
| “Robust and durable hardware for industrial use.” | “Pricing feels high for small businesses.” |
| “Seamless integration with existing systems.” | “Software updates occasionally cause glitches.” |
Overall, consumers praise Cognex for its precision technology and durable products. However, concerns about customer service responsiveness and pricing recur, suggesting areas for improvement.
Risk Analysis
Below is a detailed table outlining Cognex Corporation’s key risks, their likelihood, and potential impact:
| Category | Description | Probability | Impact |
|---|---|---|---|
| Valuation Risk | Elevated P/E ratio at 52.8 signals potential overvaluation relative to sector benchmarks. | High | High |
| Profitability | ROE of 7.7% lags behind WACC at 10.85%, indicating value destruction risk. | Medium | High |
| Liquidity | Current ratio of 3.8 is labeled unfavorable, suggesting inefficient asset use. | Low | Medium |
| Market Volatility | Beta of 1.53 implies higher sensitivity to market swings, increasing share price volatility. | High | Medium |
| Interest Coverage | Zero interest coverage ratio raises red flags about debt servicing under stress conditions. | Low | High |
The most pressing concerns are valuation and profitability mismatches. Cognex’s P/E far exceeds industry averages, exposing investors to downside if growth disappoints. ROE below WACC signals the company struggles to generate returns above capital costs, a core value driver. Despite strong liquidity ratios, inefficient use of assets tempers enthusiasm. Elevated beta amplifies market risk amid tech sector cyclicality. The zero interest coverage is unusual given low debt, but deserves monitoring for any debt cost changes. Overall, risks cluster around valuation and capital efficiency, warranting cautious positioning despite the firm’s strong Altman Z-Score and Piotroski strength.
Should You Buy Cognex Corporation?
Cognex appears to be a company with moderate profitability and operational efficiency, yet its competitive moat seems very unfavorable due to declining ROIC. Supported by a strong leverage profile and a B rating, the overall financial health suggests cautious value creation.
Strength & Efficiency Pillars
Cognex Corporation posts a solid net margin of 11.51%, reflecting operational profitability. The company maintains a favorable gross margin at 66.92%, showing strong cost control. Its ROIC stands at 5.52%, slightly below the WACC of 10.85%, indicating it currently sheds value rather than creates it. Despite this, the Altman Z-Score of 9.60 places Cognex firmly in the safe zone, and the Piotroski score of 7 signals strong financial health overall.
Weaknesses and Drawbacks
Cognex faces valuation headwinds with a high P/E ratio of 52.83 and a P/B ratio of 4.05, suggesting an expensive stock relative to earnings and book value. The current ratio at 3.8 is labeled unfavorable despite seeming healthy, likely due to asset structure concerns. Interest coverage is zero, reflecting potential vulnerability in servicing debt. Additionally, asset turnover at 0.49 signals inefficiency in utilizing assets to generate sales, raising caution over operational leverage.
Our Final Verdict about Cognex Corporation
Cognex demonstrates operational profitability and financial stability, supported by a strong Altman Z-Score and Piotroski rating. However, its valuation appears stretched, and some efficiency metrics underperform. The bullish stock trend paired with strong buyer dominance suggests momentum, yet the premium valuation might prompt a cautious entry. Overall, Cognex may appear attractive for long-term exposure, though investors should weigh valuation risks carefully.
Disclaimer: This content is for informational purposes only and does not constitute financial, investment, or other professional advice. Investing in financial markets involves a significant risk of loss, and past performance is not indicative of future results.
Additional Resources
- Cognex Q4 Earnings Review: Why The Stock Jumped Over 30% (Upgrade) (NASDAQ:CGNX) – Seeking Alpha (Feb 12, 2026)
- Cognex (CGNX) Shares Skyrocket, What You Need To Know – Yahoo Finance (Feb 12, 2026)
- Cognex (NASDAQ:CGNX) Sets New 12-Month High on Earnings Beat – MarketBeat (Feb 12, 2026)
- Cognex (CGNX) Surpasses Earnings and Revenue Expectations – GuruFocus (Feb 12, 2026)
- Cognex Corporation (CGNX) Beats Q4 Earnings and Revenue Estimates – Nasdaq (Feb 11, 2026)
For more information about Cognex Corporation, please visit the official website: cognex.com