Cognex Corporation revolutionizes the way industries operate, seamlessly integrating machine vision technology into everyday manufacturing and distribution tasks. With its flagship products like VisionPro software and advanced image-based barcode readers, Cognex has cemented its status as a trailblazer in the hardware and equipment sector. Known for its innovative solutions that enhance efficiency and accuracy, the company plays a pivotal role in sectors ranging from automotive to pharmaceuticals. As we delve into the investment landscape, I invite you to consider whether Cognex’s strong fundamentals continue to justify its current market valuation and growth prospects.
Table of contents
Company Description
Cognex Corporation (NASDAQ: CGNX), founded in 1981 and headquartered in Natick, Massachusetts, is a prominent player in the machine vision industry. The company specializes in developing products that capture and analyze visual information to automate manufacturing and distribution processes. Its core offerings include advanced vision software like VisionPro and QuickBuild, as well as robust inspection systems, vision sensors, and image-based barcode readers under the DataMan brand. Operating primarily in markets such as consumer electronics, automotive, and pharmaceuticals, Cognex is recognized for its innovative solutions that enhance efficiency and accuracy in production. As a leader in machine vision technology, Cognex is shaping the future of automation and smart manufacturing.
Fundamental Analysis
In this section, I will analyze Cognex Corporation’s income statement, financial ratios, and dividend payout policy to assess its overall financial health.
Income Statement
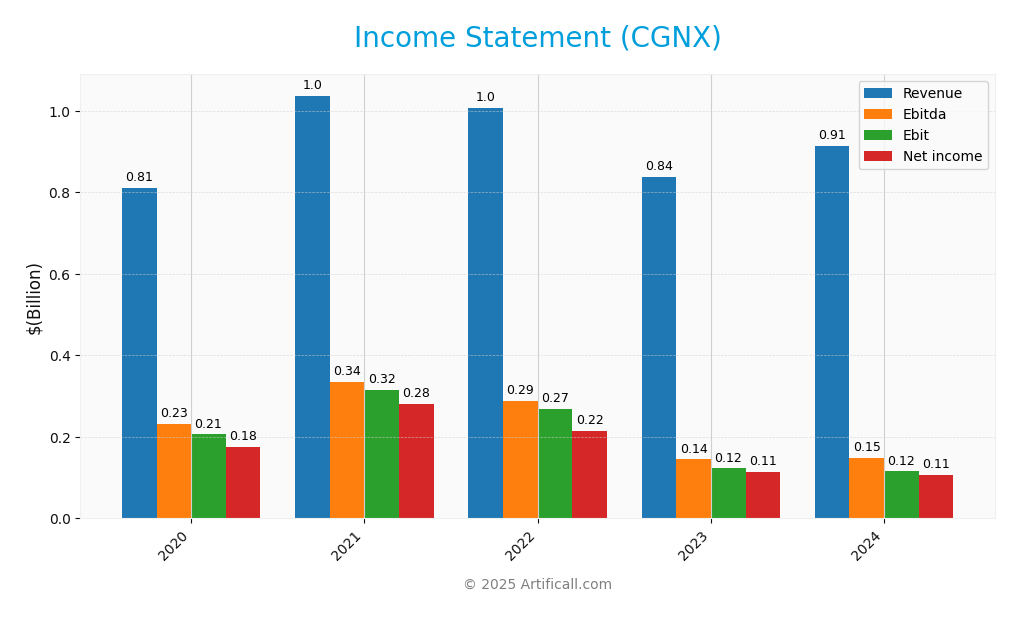
Below is the Income Statement for Cognex Corporation, showcasing the financial performance over the last five years.
| Item | 2020 | 2021 | 2022 | 2023 | 2024 |
|---|---|---|---|---|---|
| Revenue | 811M | 1B | 1B | 838M | 915M |
| Cost of Revenue | 206M | 277M | 284M | 236M | 289M |
| Operating Expenses | 434M | 445M | 476M | 471M | 511M |
| Gross Profit | 605M | 760M | 722M | 601M | 626M |
| EBITDA | 233M | 335M | 288M | 145M | 148M |
| EBIT | 206M | 315M | 269M | 123M | 115M |
| Interest Expense | 0 | 0 | 0 | 0 | 0 |
| Net Income | 176M | 280M | 216M | 113M | 106M |
| EPS | 1.02 | 1.59 | 1.24 | 0.66 | 0.62 |
| Filing Date | 2021-02-11 | 2022-02-17 | 2023-02-16 | 2024-02-15 | 2025-02-13 |
Interpretation of Income Statement
Over the five-year period, Cognex Corporation’s revenue showed fluctuations, peaking at 1B in 2022 before declining to 915M in 2024. Net income followed a similar trend, decreasing from 280M in 2021 to 106M in 2024, which raises concerns about profitability. Gross margins have remained relatively stable, but the recent year’s EBITDA and EBIT indicate a slight decline in operational efficiency. The decrease in EPS from 1.02 in 2020 to 0.62 in 2024 highlights the need for investors to be cautious, as growth has slowed and profitability has contracted.
Financial Ratios
Below is a summary of the financial ratios for Cognex Corporation (CGNX) over the past few fiscal years.
| Metrics | 2020 | 2021 | 2022 | 2023 | 2024 |
|---|---|---|---|---|---|
| Net Margin | 21.72% | 26.99% | 21.42% | 13.52% | 11.61% |
| ROE | 13.96% | 19.57% | 14.98% | 7.53% | 6.99% |
| ROIC | 9.59% | 15.17% | 11.90% | 5.83% | 5.05% |
| P/E | 79.06 | 49.03 | 37.90 | 63.49 | 57.90 |
| P/B | 11.04 | 9.60 | 5.68 | 4.78 | 4.05 |
| Current Ratio | 4.55 | 3.39 | 3.82 | 4.47 | 3.62 |
| Quick Ratio | 4.09 | 2.79 | 3.17 | 3.40 | 2.69 |
| D/E | 0.02 | 0.02 | 0.03 | 0.05 | 0.04 |
| Debt-to-Assets | 1.46% | 1.28% | 2.03% | 3.90% | 3.52% |
| Interest Coverage | – | – | – | – | 0 |
| Asset Turnover | 0.45 | 0.52 | 0.51 | 0.42 | 0.46 |
| Fixed Asset Turnover | 7.97 | 10.30 | 8.57 | 4.63 | 5.52 |
| Dividend Yield | 2.80% | 0.32% | 0.56% | 0.68% | 0.85% |
Interpretation of Financial Ratios
Analyzing Cognex Corporation’s financial ratios for 2024 reveals a generally strong financial position. The current ratio at 3.62 indicates robust liquidity, suggesting the company can cover its short-term liabilities comfortably. The debt-to-equity ratio is notably low at 0.046, reflecting a conservative approach to leverage, which minimizes financial risk. However, the net profit margin of 11.61% could be considered moderate compared to industry peers. Additionally, a price-to-earnings ratio of 57.90 may signal overvaluation or high growth expectations, raising caution for potential investors. Overall, while liquidity and solvency are strong, profitability and market valuation metrics warrant close monitoring.
Evolution of Financial Ratios
Over the past five years, Cognex’s financial ratios have shown mixed trends. While liquidity ratios like the current ratio have remained robust, the profit margins have generally declined, indicating potential challenges in maintaining profitability in a competitive environment.
Distribution Policy
Cognex Corporation (CGNX) currently pays dividends, with a recent annual dividend yield of approximately 0.85% and a payout ratio of 49.29%. The dividend per share has shown a consistent upward trend, reflecting a commitment to returning capital to shareholders. Additionally, Cognex engages in share buybacks, which can enhance shareholder value. However, investors should remain cautious about the sustainability of these distributions amid potential market fluctuations and operational challenges, as these factors could impact long-term value creation.
Sector Analysis
Cognex Corporation operates in the Hardware, Equipment & Parts industry, specializing in machine vision products that enhance automation in manufacturing and distribution. Key competitors include Keyence and Omron, while its competitive advantages lie in patented technology and diverse applications across various sectors.
Strategic Positioning
Cognex Corporation (CGNX) holds a significant market share in the machine vision industry, driven by its advanced products that automate manufacturing and distribution tasks. The company’s key offerings, such as VisionPro software and the In-Sight product line, position it favorably against competitors. However, it faces competitive pressure from emerging technologies and players in the market, necessitating continual innovation. Technological disruption is a constant threat, as advancements in AI and machine learning can reshape the landscape, compelling Cognex to adapt swiftly to maintain its leadership in this dynamic sector.
Revenue by Segment
The following chart illustrates Cognex Corporation’s revenue segmentation for fiscal years 2023 and 2024, highlighting trends in key business areas over this period.
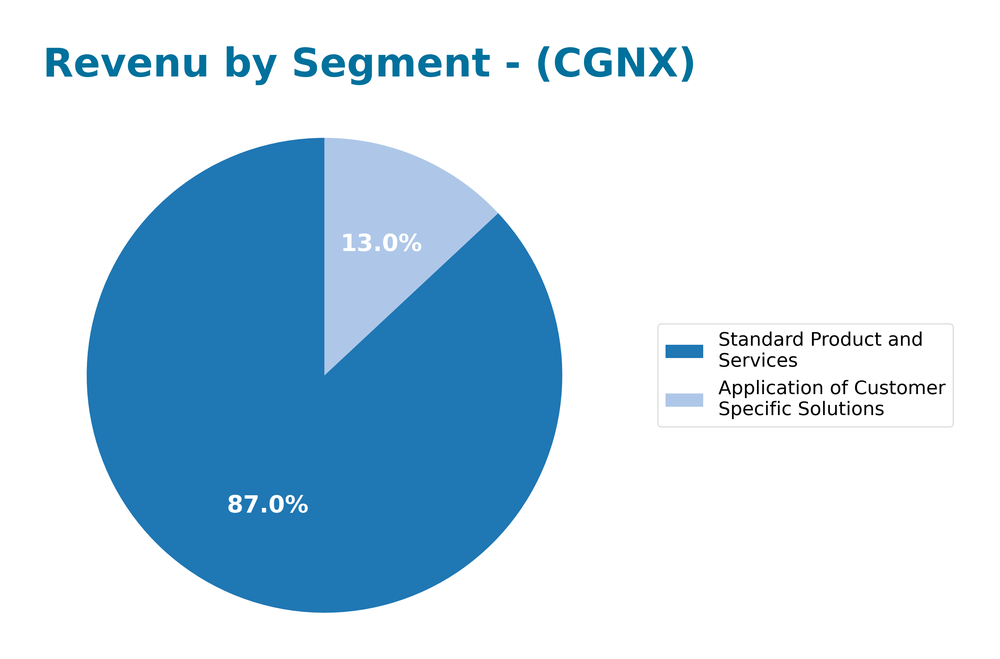
In analyzing Cognex’s revenue by segment, we see a notable increase in the “Standard Product and Services” segment, growing from 734M in 2023 to 795M in 2024. Conversely, the “Application of Customer Specific Solutions” segment experienced a decline from 103M in 2023 to 119M in 2024. This shift indicates that while the standard offerings are driving revenue growth, there may be potential margin pressures or concentration risks within the custom solutions area. Overall, the recent year reflects a mixed performance, with the growth rate in services slowing compared to previous years, requiring careful monitoring of market dynamics and customer demands.
Key Products
Cognex Corporation offers a range of innovative machine vision products designed to enhance automation in manufacturing and distribution. Below is a table summarizing some of their key products:
| Product | Description |
|---|---|
| VisionPro | A comprehensive suite of patented vision tools for advanced programming, enabling complex vision applications. |
| QuickBuild | A user-friendly graphical interface that allows customers to create vision applications using a flowchart-based approach. |
| Deep Learning Vision Software | Advanced software that utilizes deep learning algorithms for superior image analysis and inspection tasks. |
| In-Sight Systems | A line of vision systems and sensors designed for tasks such as part location, identification, and assembly verification. |
| DataMan | High-performance image-based barcode readers and verifiers that enhance tracking and inventory management. |
| Vision Sensors | Specialized sensors for applications including presence detection and size verification of parts. |
These products cater to various industries, including consumer electronics, automotive, and pharmaceuticals, reflecting Cognex’s commitment to advancing automation technologies.
Main Competitors
The competitive landscape for Cognex Corporation (CGNX) includes several key players in the hardware, equipment, and parts industry, particularly focusing on machine vision products.
| Company | Market Cap |
|---|---|
| Sanmina Corporation | 8.53B |
| The Descartes Systems Group Inc. | 7.95B |
| TTM Technologies, Inc. | 7.62B |
| Littelfuse, Inc. | 6.44B |
| Cognex Corporation | 6.44B |
| Waystar Holding Corp. | 5.95B |
| Universal Display Corporation | 5.77B |
| Badger Meter, Inc. | 5.31B |
| Vontier Corporation | 5.25B |
| ESCO Technologies Inc. | 5.05B |
| Novanta Inc. | 4.17B |
The main competitors listed above operate primarily in the North American and global markets, each offering various solutions that overlap with Cognex’s machine vision technology.
Competitive Advantages
Cognex Corporation (CGNX) possesses a robust competitive advantage through its innovative machine vision technology, which is crucial for automating manufacturing and distribution processes across various industries, including automotive and pharmaceuticals. The company’s extensive portfolio, featuring products like VisionPro software and DataMan barcode readers, positions it well in a growing market. Looking ahead, opportunities lie in expanding into new markets, particularly in artificial intelligence and smart manufacturing, as demand for automation continues to rise globally. This focus on innovation and adaptability will likely enhance its market share and revenue growth in the coming years.
SWOT Analysis
This SWOT analysis aims to evaluate Cognex Corporation’s strategic position in the market.
Strengths
- Strong market presence
- Innovative product offerings
- Diverse customer base
Weaknesses
- High dependency on manufacturing sector
- Limited brand recognition outside tech
- Vulnerability to economic downturns
Opportunities
- Growth in automation trends
- Expansion into emerging markets
- Increasing demand for machine vision technology
Threats
- Intense competition
- Rapid technological changes
- Economic instability affecting customer budgets
The overall SWOT assessment indicates that while Cognex has a solid foundation with its strengths, it must address its weaknesses and threats effectively. Focusing on expanding its market reach and capitalizing on automation trends will be crucial for enhancing its strategic outlook.
Stock Analysis
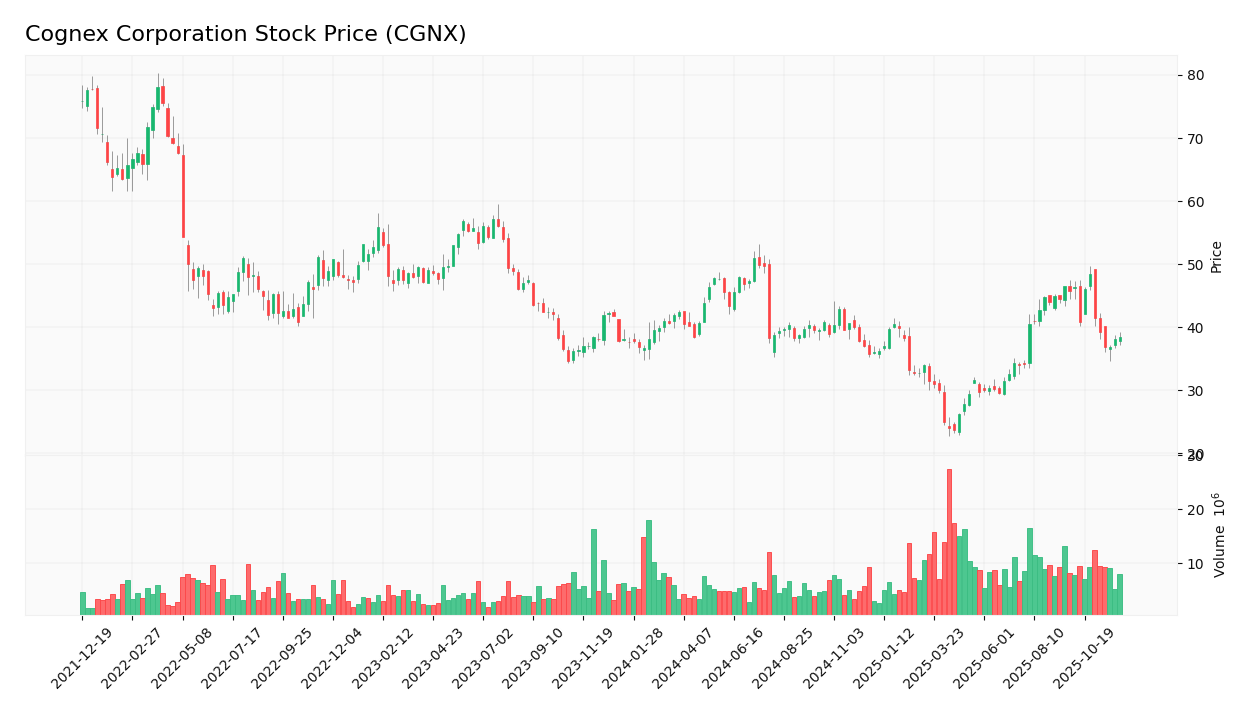
Over the past year, Cognex Corporation (CGNX) has experienced notable price movements that reflect varying trading dynamics. The stock has shown a bullish trend overall, despite facing recent volatility.
Trend Analysis
Analyzing the stock’s performance over the past two years, I observe a percentage change of +0.89%. This slight increase indicates a bullish trend, although it is important to note that the trend is currently in a state of deceleration. The highest price recorded was 50.98, while the lowest was 23.77, demonstrating some volatility with a standard deviation of 5.91.
In the recent period from September 21, 2025, to December 7, 2025, the stock has experienced a significant decline of -17.34%, which is indicative of a bearish trend in that timeframe, marked by a trend slope of -0.95. The standard deviation of 4.09 suggests moderate volatility during this period.
Volume Analysis
Over the last three months, the total trading volume for CGNX has reached approximately 897M shares, with buyer-driven activity comprising about 55.54% of this volume (498M shares). The volume trend is increasing, highlighting a growing interest in the stock. This suggests that investor sentiment is leaning slightly towards buying, which may reflect confidence in the long-term potential of the company, despite the recent price downturn.
Analyst Opinions
Recent analyst recommendations for Cognex Corporation (CGNX) indicate a consensus rating of “Buy.” Analysts highlight the company’s strong return on assets (4) and overall solid performance across various metrics, despite a lower price-to-earnings score (1). Analysts believe that CGNX’s innovative technology and market position will drive future growth. Notably, analysts from firms like Morgan Stanley and Goldman Sachs have reiterated their positive outlook, citing potential for revenue growth in automation and AI sectors. Overall, the sentiment remains optimistic for investors looking to add CGNX to their portfolios.
Stock Grades
Cognex Corporation (CGNX) has received a range of stock ratings from recognized grading companies, reflecting varying perspectives on the company’s market position.
| Grading Company | Action | New Grade | Date |
|---|---|---|---|
| JP Morgan | downgrade | Underweight | 2025-12-03 |
| DA Davidson | maintain | Neutral | 2025-11-03 |
| Needham | maintain | Buy | 2025-10-31 |
| Baird | maintain | Neutral | 2025-10-31 |
| Barclays | maintain | Overweight | 2025-10-31 |
| Truist Securities | maintain | Hold | 2025-10-08 |
| Goldman Sachs | maintain | Sell | 2025-09-16 |
| DA Davidson | maintain | Neutral | 2025-08-04 |
| Baird | maintain | Neutral | 2025-08-01 |
| Keybanc | upgrade | Overweight | 2025-08-01 |
Overall, the trend in grades for CGNX shows a mix of maintaining and downgrading actions, with a notable downgrade from JP Morgan to Underweight, juxtaposed with a recent upgrade by Keybanc to Overweight. This indicates a cautious sentiment among analysts, with some maintaining their support while others express growing concerns.
Target Prices
The consensus among analysts for Cognex Corporation (CGNX) indicates a range of target prices reflecting varying expectations.
| Target High | Target Low | Consensus |
|---|---|---|
| 58 | 38 | 48.67 |
Overall, the target prices suggest a moderate outlook for CGNX, with analysts anticipating potential gains, but also recognizing the risks involved.
Consumer Opinions
Consumer sentiment about Cognex Corporation (CGNX) reflects a mix of appreciation for its innovative technology and concerns regarding customer support.
| Positive Reviews | Negative Reviews |
|---|---|
| “Cognex’s products have significantly improved our production efficiency.” | “Customer service response times are too slow.” |
| “The image processing quality is outstanding.” | “Software updates often cause compatibility issues.” |
| “Reliable and high-quality equipment.” | “Prices are higher than competitors.” |
Overall, consumer feedback indicates that while customers praise the quality and efficiency of Cognex’s products, they express dissatisfaction with the customer service and pricing structure.
Risk Analysis
In assessing Cognex Corporation (CGNX), it’s crucial to understand the potential risks that could affect its performance. Below is a summary of key risks:
| Category | Description | Probability | Impact |
|---|---|---|---|
| Market Risk | Fluctuations in demand for machine vision products | High | High |
| Competitive Risk | Increased competition from emerging technologies | Medium | High |
| Regulatory Risk | Changes in trade policies affecting exports | Medium | Medium |
| Operational Risk | Supply chain disruptions due to global events | High | Medium |
| Technological Risk | Rapid advancements making current tech obsolete | Medium | High |
Cognex faces significant market and operational risks, particularly given the rapid technological advancements and potential supply chain disruptions that could impact its competitive position and profitability.
Should You Buy Cognex Corporation?
Cognex Corporation (CGNX) has demonstrated a positive profitability trend with a net profit margin of 11.61% in 2024, indicating effective cost management. However, the company may be seen as value destructive since its return on invested capital (ROIC) of 5.05% is below the weighted average cost of capital (WACC) of 10.83%. Cognex maintains a low debt level, with a debt-to-equity ratio of 0.046, suggesting strong financial stability. The overall rating is a B, indicating a moderate level of investment quality and performance.
Favorable signals
Cognex Corporation has shown several favorable elements in its income statement evaluation, including a revenue growth of 9.19% and a gross margin of 68.43%. Additionally, the company has favorable operating expenses compared to revenue growth, with a margin of 9.19%. The net margin stands at a positive 11.61%, and the interest expense percentage is notably at 0.0%. Furthermore, the quick ratio is favorable at 2.69, along with a debt-to-equity ratio of 0.05 and a debt-to-assets percentage of 3.52%.
Unfavorable signals
Despite the favorable indicators, there are several unfavorable elements in Cognex Corporation’s financials. The EBIT margin shows a decline of 6.22%, and the net margin growth is negative at -14.13%. The earnings per share growth also reflects an unfavorable trend with a decline of 4.62%. Additionally, the return on equity is unfavorable at 7.0% compared to the weighted average cost of capital at 10.83%, indicating value destruction. The price-to-earnings ratio of 57.9 and price-to-book ratio of 4.05 are also unfavorable, signaling potential overvaluation. Lastly, the current ratio of 3.62 is unfavorable in the context of its operational performance.
Conclusion
Given that the income statement evaluation is favorable while the ratios evaluation is unfavorable, it appears that there are mixed signals regarding the company’s financial health. The recent seller volume exceeding buyer volume suggests that I might consider waiting for buyers to return before making any investment decisions.
Disclaimer: This article is not financial advice. Each investor is responsible for their own investment decisions.
Additional Resources
- What Makes Cognex Corporation (CGNX) an Investment Bet? – Yahoo Finance (Nov 18, 2025)
- Cognex (NASDAQ: CGNX) to join Goldman Sachs and Bernstein industrials events – Stock Titan (Dec 01, 2025)
- Cognex: Fairly Valued Given Limited Near-Term Visibility (NASDAQ:CGNX) – Seeking Alpha (Dec 03, 2025)
- Cognex Announces Participation at Upcoming Investor Conferences – PR Newswire (Dec 01, 2025)
- Is the AI-Enabled SLX Launch Reshaping the Investment Case for Cognex (CGNX)? – Sahm (Dec 01, 2025)
For more information about Cognex Corporation, please visit the official website: cognex.com