Home > Analyses > Consumer Defensive > Coca-Cola Europacific Partners PLC
Coca-Cola Europacific Partners PLC refreshes millions daily with its iconic beverages and innovative product range. As the largest independent Coca-Cola bottler by revenue, it commands a leading position in the global non-alcoholic drinks market. Renowned for quality and a diverse portfolio spanning from classic sodas to energy drinks, it shapes consumer habits worldwide. The key question: does CCEP’s robust market footprint still support its current valuation and growth ambitions in 2026?

Table of contents
Business Model & Company Overview
Coca-Cola Europacific Partners PLC, founded in 1986 and headquartered in Uxbridge, UK, stands as a dominant player in the non-alcoholic beverage sector. It operates a vast ecosystem that includes soft drinks, energy drinks, waters, teas, and juices, marketed under iconic brands such as Coca-Cola, Monster Energy, and Costa Coffee. This diverse portfolio fuels its mission to refresh and energize around 600M consumers globally.
The company’s revenue engine blends bottling, distribution, and sales across the Americas, Europe, and Asia. It balances hardware-intensive bottling operations with high-margin branded beverages and recurring consumer demand. This integrated model cements its competitive advantage, enabling it to shape the future of the beverage industry through scale and brand strength.
Financial Performance & Fundamental Metrics
I analyze Coca-Cola Europacific Partners PLC’s income statement, key financial ratios, and dividend payout policy to assess its core financial health and shareholder value.
Income Statement
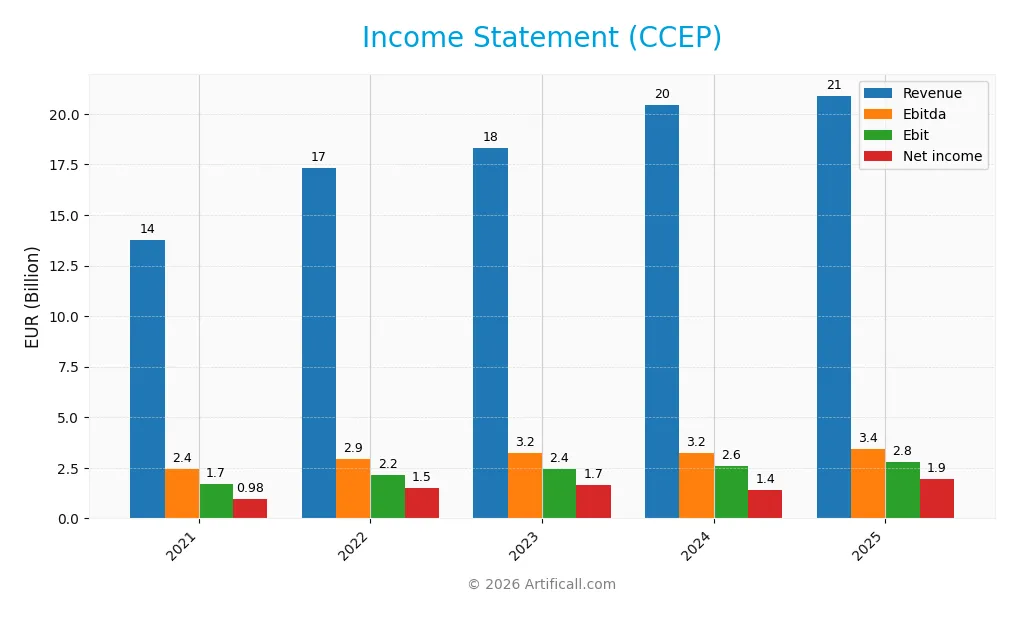
The table below summarizes Coca-Cola Europacific Partners PLC’s key income statement metrics for fiscal years 2021 through 2025, reported in EUR.
| 2021 | 2022 | 2023 | 2024 | 2025 | |
|---|---|---|---|---|---|
| Revenue | 13.8B | 17.3B | 18.3B | 20.4B | 20.9B |
| Cost of Revenue | 8.7B | 11.1B | 11.6B | 13.2B | 13.5B |
| Operating Expenses | 3.6B | 4.2B | 4.4B | 5.2B | 4.6B |
| Gross Profit | 5.1B | 6.2B | 6.7B | 7.3B | 7.4B |
| EBITDA | 2.4B | 2.9B | 3.2B | 3.2B | 3.4B |
| EBIT | 1.7B | 2.2B | 2.4B | 2.6B | 2.8B |
| Interest Expense | 96M | 131M | 162M | 242M | 294M |
| Net Income | 982M | 1.5B | 1.7B | 1.4B | 1.9B |
| EPS | 2.15 | 3.3 | 3.63 | 3.08 | 4.09 |
| Filing Date | 2022-03-15 | 2023-03-17 | 2024-03-15 | 2025-03-21 | 2026-03-13 |
Income Statement Evolution
From 2021 to 2025, Coca-Cola Europacific Partners PLC’s revenue rose 52% to 20.9B EUR. Net income nearly doubled, reaching 1.94B EUR. Gross margin improved steadily, stabilizing above 35%. EBIT margin also advanced, hitting 13.3% in 2025. These trends reflect solid operational leverage and disciplined cost control amid moderate revenue growth.
Is the Income Statement Favorable?
The 2025 income statement shows favorable fundamentals. EBIT grew 7% year-over-year to 2.79B EUR, outpacing revenue growth of 2.3%. Net margin expanded sharply to 9.3%, supported by contained interest expenses at 1.4% of revenue. EPS surged 33%, reflecting efficient capital allocation. Overall, profitability metrics and margin improvements underscore strong earnings quality and operational efficiency.
Financial Ratios
The following table summarizes key financial ratios for Coca-Cola Europacific Partners PLC over the last five fiscal years:
| Ratios | 2021 | 2022 | 2023 | 2024 | 2025 |
|---|---|---|---|---|---|
| Net Margin | 7.1% | 8.7% | 9.1% | 6.9% | 9.3% |
| ROE | 14.0% | 20.2% | 20.9% | 16.7% | 24.8% |
| ROIC | 4.5% | 6.9% | 7.6% | 6.5% | 9.5% |
| P/E | 22.8 | 15.7 | 16.6 | 24.1 | 18.1 |
| P/B | 3.2 | 3.2 | 3.5 | 4.0 | 4.5 |
| Current Ratio | 0.95 | 0.89 | 0.91 | 0.81 | 0.80 |
| Quick Ratio | 0.76 | 0.71 | 0.72 | 0.62 | 0.60 |
| D/E | 1.87 | 1.60 | 1.43 | 1.33 | 1.38 |
| Debt-to-Assets | 45.2% | 40.6% | 38.9% | 36.4% | 36.1% |
| Interest Coverage | 15.8x | 15.9x | 14.4x | 8.8x | 9.5x |
| Asset Turnover | 0.47 | 0.59 | 0.63 | 0.66 | 0.70 |
| Fixed Asset Turnover | 2.62 | 3.33 | 3.42 | 3.18 | 3.40 |
| Dividend Yield | 2.8% | 3.2% | 3.0% | 2.7% | 2.5% |
Evolution of Financial Ratios
Return on Equity (ROE) improved significantly from 14% in 2021 to nearly 25% in 2025, indicating stronger profitability. The Current Ratio declined steadily from 0.95 to 0.80, reflecting tighter liquidity. Debt-to-Equity Ratio decreased from 1.87 in 2021 to 1.38 in 2025, showing modest deleveraging and improved financial stability.
Are the Financial Ratios Favorable?
In 2025, profitability measured by ROE is favorable at 24.79%, surpassing typical market expectations, while net margin is neutral at 9.29%. Liquidity ratios, including current (0.8) and quick (0.6), remain unfavorable, signaling potential short-term risk. Leverage is somewhat unfavorable with a Debt-to-Equity of 1.38, yet interest coverage is strong at 9.49. Market valuation shows mixed signals with an unfavorable price-to-book ratio of 4.49 but a favorable dividend yield of 2.53%. Overall, the ratio profile is slightly favorable with balanced risks.
Shareholder Return Policy
Coca-Cola Europacific Partners PLC maintains a consistent dividend policy with a payout ratio near 46% in 2025 and a dividend yield around 2.53%. Dividends have grown steadily from €1.40 in 2021 to €1.95 in 2025. The dividend is well covered by free cash flow, supporting sustainability.
The company also engages in share buybacks, complementing cash returns to shareholders. Although leverage remains elevated, dividend and capex coverage ratios above 1.6 indicate prudent capital allocation. This balanced approach underpins sustainable long-term shareholder value creation.
Score analysis
The radar chart below visualizes Coca-Cola Europacific Partners PLC’s key financial scores across valuation, profitability, and leverage metrics:
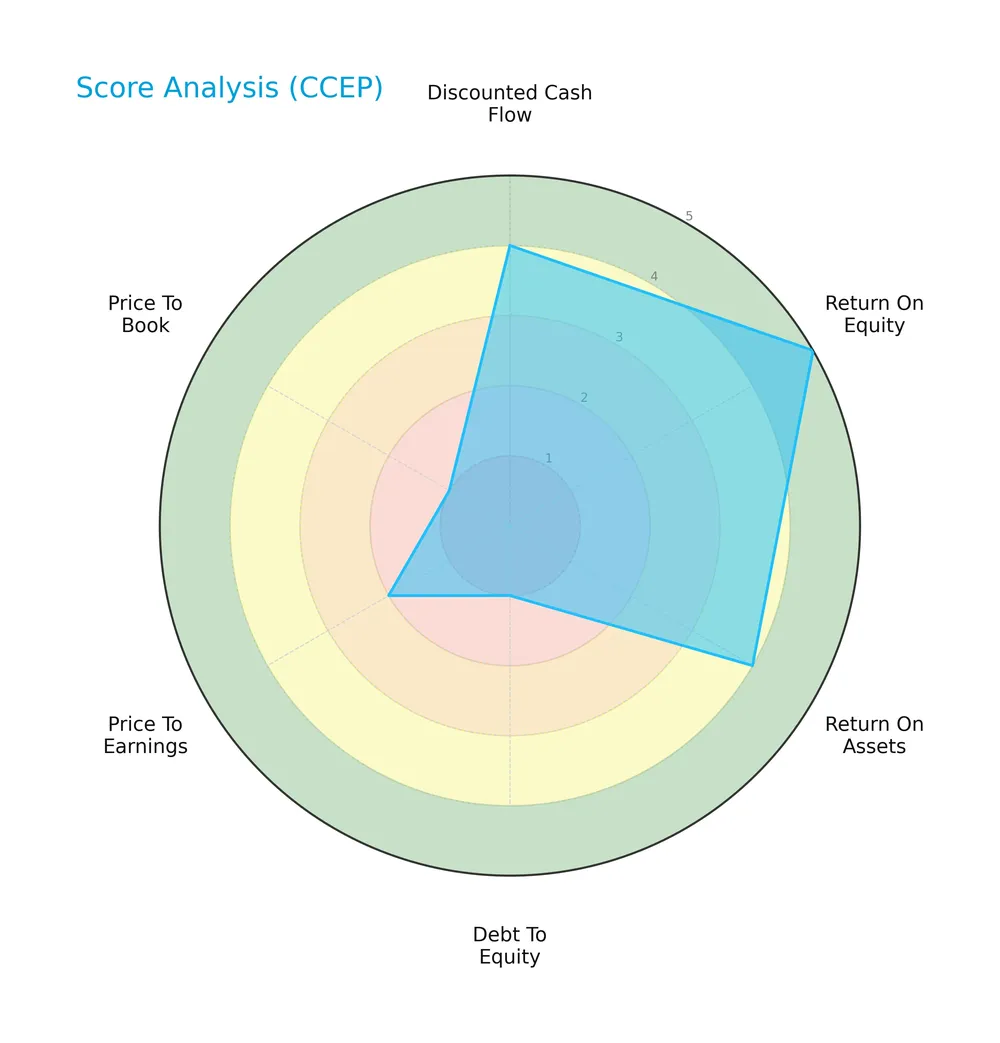
The company scores very favorably on return on equity (5) and favorably on discounted cash flow (4) and return on assets (4). However, debt to equity (1), price to earnings (2), and price to book (1) scores reveal unfavorable valuation and leverage concerns.
Analysis of the company’s bankruptcy risk
Coca-Cola Europacific Partners PLC’s Altman Z-Score places it solidly in the safe zone, indicating low bankruptcy risk:

Is the company in good financial health?
The Piotroski Score diagram presents an average financial health status for the company:

With a Piotroski Score of 6, Coca-Cola Europacific Partners PLC demonstrates moderate financial strength, suggesting reasonable profitability and operational efficiency but room for improvement in financial robustness.
Competitive Landscape & Sector Positioning
This section examines Coca-Cola Europacific Partners PLC’s strategic positioning within the non-alcoholic beverages sector. I will analyze its revenue by segment, key products, and main competitors. I aim to determine whether the company holds a competitive advantage over its peers.
Strategic Positioning
Coca-Cola Europacific Partners PLC maintains a diversified geographic footprint, with Europe generating approximately €15.4B and Australia-Pacific-Asia around €5.5B in 2025. Its broad non-alcoholic beverage portfolio spans soft drinks, waters, energy drinks, and ready-to-drink teas, reflecting a balanced product mix across key markets.
Revenue by Segment
This pie chart illustrates Coca-Cola Europacific Partners PLC’s revenue distribution across its segments for the fiscal year 2026.

The revenue breakdown reveals that the core beverage segment overwhelmingly drives the business, reflecting strong brand demand. Other segments contribute modestly, indicating limited diversification. In 2026, revenue concentration remains high, underscoring the company’s reliance on its flagship product lines. This focus can deliver stable cash flows but also raises exposure to shifting consumer preferences and regulatory risks.
Key Products & Brands
The following table summarizes Coca-Cola Europacific Partners’ main products and brands:
| Product | Description |
|---|---|
| Soft Drinks | Includes flagship brands Coca-Cola, Diet Coke, Coca-Cola Zero Sugar, Fanta, and Sprite. |
| Energy Drinks | Brands such as Monster Energy, Coca-Cola Energy, Relentless, BURN, REIGN, and POWERADE. |
| Water & Enhanced Water | Includes smartwater, Chaudfontaine, AQUARIUS, BONAQUA, Apollinaris, Krystal, and Vio SCHORLE. |
| Ready-to-Drink Tea & Coffee | Covers Costa Coffee, Fuzetea, CHAQWA, and NESTEA. |
| Juices & Other Drinks | Includes Minute Maid, Capri-Sun, Oasis, Appletiser, MER, Tropico, and others. |
| Mixers & Flavours | Coca-Cola Signature Mixers, Schweppes, FINLEY, mezzo mix, Royal Bliss, NORDIC MIST, and more. |
Coca-Cola Europacific Partners offers a diverse portfolio spanning soft drinks, energy beverages, waters, teas, juices, and mixers. This broad range supports its position in the non-alcoholic beverage sector.
Main Competitors
There are 7 main competitors in the sector, with the table below showing the top 10 leaders by market capitalization:
| Competitor | Market Cap. |
|---|---|
| The Coca-Cola Company | 297.5B |
| PepsiCo, Inc. | 194.5B |
| Monster Beverage Corporation | 74.4B |
| Coca-Cola Europacific Partners PLC | 41.7B |
| Keurig Dr Pepper Inc. | 37.7B |
| Coca-Cola Consolidated, Inc. | 13.3B |
| Celsius Holdings, Inc. | 11.8B |
Coca-Cola Europacific Partners ranks 4th among its 7 competitors. Its market cap is 13.8% of the sector leader, The Coca-Cola Company. The company sits below both the top 10 average (95.8B) and the sector median (41.7B). It leads its closest rival by a significant 81.2%, indicating a clear gap in scale.
Comparisons with competitors
Check out how we compare the company to its competitors:
Does CCEP have a competitive advantage?
Coca-Cola Europacific Partners PLC demonstrates a clear competitive advantage, evidenced by a ROIC exceeding WACC by over 4%, indicating efficient capital use and value creation. The company’s gross margin of 35.6% and net margin of 9.3% further underscore its profitability within the non-alcoholic beverages sector.
Looking ahead, CCEP leverages a diverse portfolio of established brands across Europe and Asia-Pacific, supporting steady growth opportunities. Its expanding presence in markets like Australia and Southeast Asia, combined with favorable EBIT and EPS growth trends, positions it well to capitalize on evolving consumer preferences and new product introductions.
SWOT Analysis
This analysis identifies Coca-Cola Europacific Partners PLC’s key internal and external factors shaping its competitive position.
Strengths
- Strong brand portfolio including Coca-Cola and Monster Energy
- Favorable profitability with ROE near 25%
- Growing ROIC indicating value creation
Weaknesses
- Low current and quick ratios signal liquidity risks
- High debt-to-equity ratio of 1.38 raises leverage concerns
- Elevated price-to-book ratio suggests potential overvaluation
Opportunities
- Expansion in Asia Pacific with growing revenue
- Innovation in ready-to-drink tea and energy products
- Increasing demand for healthier beverage options
Threats
- Intense competition in non-alcoholic beverages
- Raw material cost inflation pressures margins
- Regulatory risks on sugar and plastic packaging
Coca-Cola Europacific Partners combines robust brand equity and improving profitability with liquidity and leverage challenges. Its strategy must balance growth investments and prudent capital structure management to sustain competitive advantage.
Stock Price Action Analysis
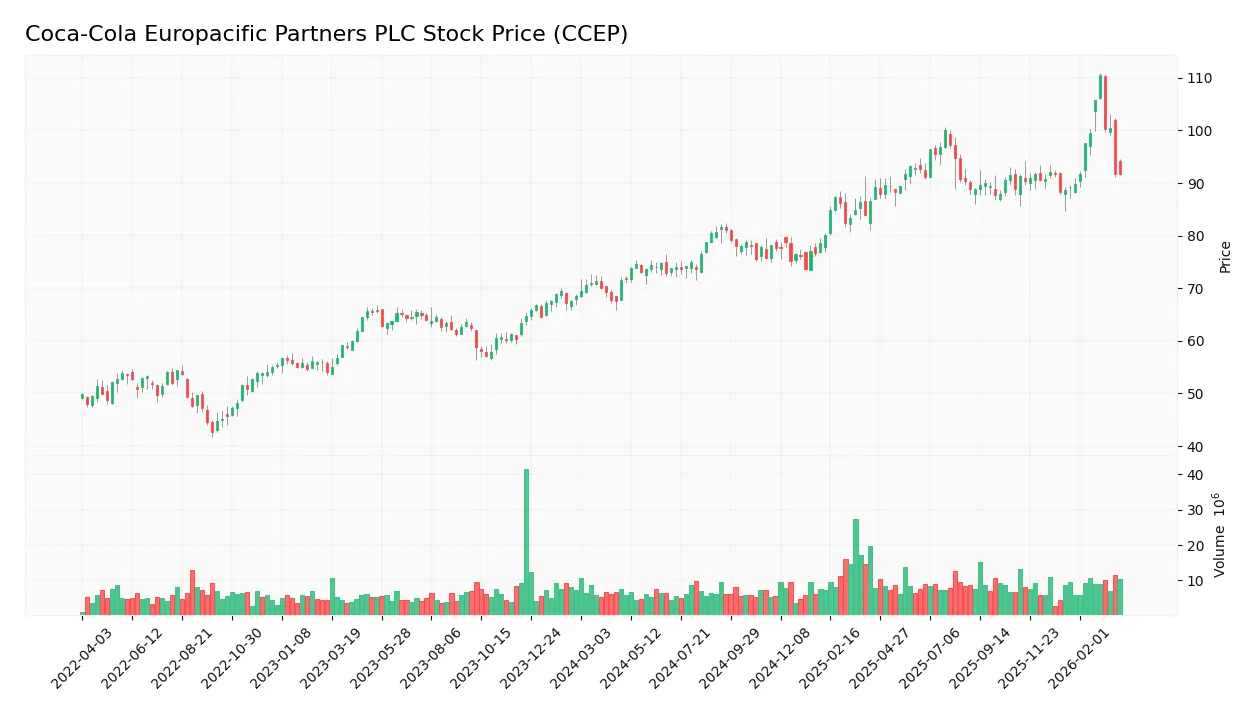
The weekly stock chart for Coca-Cola Europacific Partners PLC (CCEP) displays price movements over the last 12 months, highlighting key highs and lows:
Trend Analysis
Over the past year, CCEP’s stock price rose 27.61%, indicating a bullish trend with acceleration. The price ranged from 71.81 to a high of 110.43, showing strong upward momentum. The standard deviation of 8.48 suggests moderate volatility within this positive trend.
Volume Analysis
Trading volume has increased, with buyers dominating 60.08% of total activity over the year. In the recent three months, buyer volume surged to 79.76%, indicating strong buyer dominance and heightened market participation. This signals growing investor confidence and demand for the stock.
Target Prices
Analysts set a clear target consensus for Coca-Cola Europacific Partners PLC, reflecting steady confidence.
| Target Low | Target High | Consensus |
|---|---|---|
| 110 | 118 | 113 |
The target range between 110 and 118 signals moderate upside potential. The consensus at 113 suggests analysts expect solid but measured growth.

Don’t Let Luck Decide Your Entry Point
Optimize your entry points with our advanced ProRealTime indicators. You’ll get efficient buy signals with precise price targets for maximum performance. Start outperforming now!
Analyst & Consumer Opinions
This section reviews recent analyst grades and consumer feedback to provide insight into Coca-Cola Europacific Partners PLC’s market perception.
Stock Grades
Here are the latest verified stock grades for Coca-Cola Europacific Partners PLC from leading financial institutions:
| Grading Company | Action | New Grade | Date |
|---|---|---|---|
| Barclays | Maintain | Overweight | 2026-02-19 |
| JP Morgan | Maintain | Neutral | 2026-02-18 |
| Goldman Sachs | Maintain | Buy | 2026-02-18 |
| UBS | Maintain | Buy | 2026-02-18 |
| Evercore ISI Group | Maintain | Outperform | 2026-02-18 |
| B of A Securities | Downgrade | Neutral | 2026-01-14 |
| UBS | Maintain | Buy | 2026-01-08 |
The overall trend shows a predominantly positive outlook, with multiple firms maintaining Buy or Outperform ratings. Notably, only one downgrade to Neutral occurred, indicating general confidence in the stock’s prospects.
Consumer Opinions
Consumers express a mixed but generally favorable view of Coca-Cola Europacific Partners PLC, reflecting its strong brand presence and product appeal.
| Positive Reviews | Negative Reviews |
|---|---|
| “Consistently refreshing beverages with great variety.” | “Packaging waste is excessive and environmentally unfriendly.” |
| “Reliable product quality and availability worldwide.” | “Prices have increased noticeably over the past year.” |
| “Strong commitment to sustainability initiatives.” | “Customer service response times can be slow.” |
Overall, consumers appreciate Coca-Cola Europacific Partners for product quality and sustainability efforts. However, packaging concerns and rising prices are common complaints, signaling areas needing attention.
Risk Analysis
Below is a concise overview of key risks affecting Coca-Cola Europacific Partners PLC’s investment profile:
| Category | Description | Probability | Impact |
|---|---|---|---|
| Liquidity Risk | Current ratio at 0.8 signals tight liquidity, risking short-term cash flow issues. | Medium | Medium |
| Leverage Risk | Debt-to-equity ratio of 1.38 is high, stressing financial flexibility. | Medium | High |
| Valuation Risk | Price-to-book ratio of 4.49 suggests potential overvaluation versus sector norms. | Medium | Medium |
| Market Volatility | Beta of 0.394 indicates low sensitivity but market shocks may still affect share price. | Low | Medium |
| Operational Risk | Exposure to raw material cost inflation and supply chain disruptions. | Medium | Medium |
Leverage risk stands out as the most impactful due to the relatively high debt load. Liquidity concerns also merit caution, given the sub-1 current and quick ratios. The firm maintains a safe Altman Z-Score above 3, reflecting sound bankruptcy risk management despite these pressures. I observe that these financial strains could limit capital allocation flexibility amid market turbulence.
Should You Buy Coca-Cola Europacific Partners PLC?
Coca-Cola Europacific Partners PLC appears to exhibit improving operational efficiency and strong value creation supported by a durable competitive moat. Despite a challenging leverage profile, its overall rating of B suggests a very favorable financial stance with moderate risk considerations.
Strength & Efficiency Pillars
Coca-Cola Europacific Partners PLC delivers solid profitability with a net margin of 9.29% and a return on equity of 24.79%. The company’s return on invested capital (ROIC) stands at 9.45%, comfortably above its weighted average cost of capital (WACC) at 5.26%, marking it as a clear value creator. This edge suggests efficient capital allocation and a sustainable competitive advantage. Additionally, a growing ROIC trend confirms improving operational efficiency and profitability over time.
Weaknesses and Drawbacks
Despite robust fundamentals, the company faces notable risks. Its price-to-book ratio of 4.49 signals a potentially expensive valuation relative to book value. Leverage is a concern with a debt-to-equity ratio of 1.38 and a weak current ratio of 0.8, indicating liquidity pressures. These metrics reveal vulnerability in cushioning against downturns. Investors should also note that while the price-to-earnings ratio remains moderate at 18.13, the elevated leverage and liquidity ratios warrant caution.
Our Final Verdict about Coca-Cola Europacific Partners PLC
Coca-Cola Europacific Partners PLC presents a fundamentally solid profile with strong profitability and value creation. The bullish overall stock trend combined with a strongly buyer-dominant recent period suggests positive market sentiment. This profile might appear attractive for long-term exposure, though investors should remain mindful of leverage and liquidity risks. Patience may be rewarded as current market dynamics evolve.
Disclaimer: This content is for informational purposes only and does not constitute financial, investment, or other professional advice. Investing in financial markets involves a significant risk of loss, and past performance is not indicative of future results.
Additional Resources
- Coca-Cola Europacific Partners conducts share buybacks across multiple markets – Investing.com (Mar 24, 2026)
- Coca-Cola Europacific (CCEP) expands buybacks and shifts to weekly reports – Stock Titan (Mar 24, 2026)
- Coca-Cola Europacific Partners grants long-term share awards to senior executives – TipRanks (Mar 27, 2026)
- Coca-Cola Europacific Partners (CCEP) Conference Redburn Atlantic Consumer Summary – Quartr (Mar 21, 2026)
- Coca-Cola Europacific Partners plc Announces Annual Financial Report – Voice of Alexandria (Mar 13, 2026)
For more information about Coca-Cola Europacific Partners PLC, please visit the official website: cocacolaep.com