Home > Analyses > Consumer Defensive > Coca-Cola Consolidated, Inc.
Coca-Cola Consolidated, Inc. quenches thirsts and shapes social moments across America. As the largest independent bottler of The Coca-Cola Company’s iconic beverages, it commands a vital role in the non-alcoholic drinks industry. Its diverse portfolio includes sparkling sodas, energy drinks, and bottled water, reflecting a commitment to innovation and quality. Now, I ask: do Coca-Cola Consolidated’s strong fundamentals still justify its premium valuation and growth outlook in 2026?

Table of contents
Business Model & Company Overview
Coca-Cola Consolidated, Inc., founded in 1980 and headquartered in Charlotte, NC, dominates the U.S. non-alcoholic beverage sector. The company orchestrates a vast ecosystem of sparkling and still beverages, including energy drinks and ready-to-drink coffees. It integrates production, marketing, and distribution to deliver a cohesive portfolio anchored by The Coca-Cola Company’s products and other major brands like Dr Pepper and Monster Energy.
Its revenue engine balances direct sales to grocery, convenience, and mass merchandise stores with a robust presence in restaurants and vending outlets. Coca-Cola Consolidated leverages recurring post-mix syrup sales alongside bottled product distribution, maintaining strategic footholds across diverse retail channels. This integrated approach crafts a formidable economic moat, securing its leadership in shaping the beverage industry’s future landscape.
Financial Performance & Fundamental Metrics
I analyze Coca-Cola Consolidated, Inc.’s income statement, key financial ratios, and dividend payout policy to assess its core financial health and shareholder value.
Income Statement
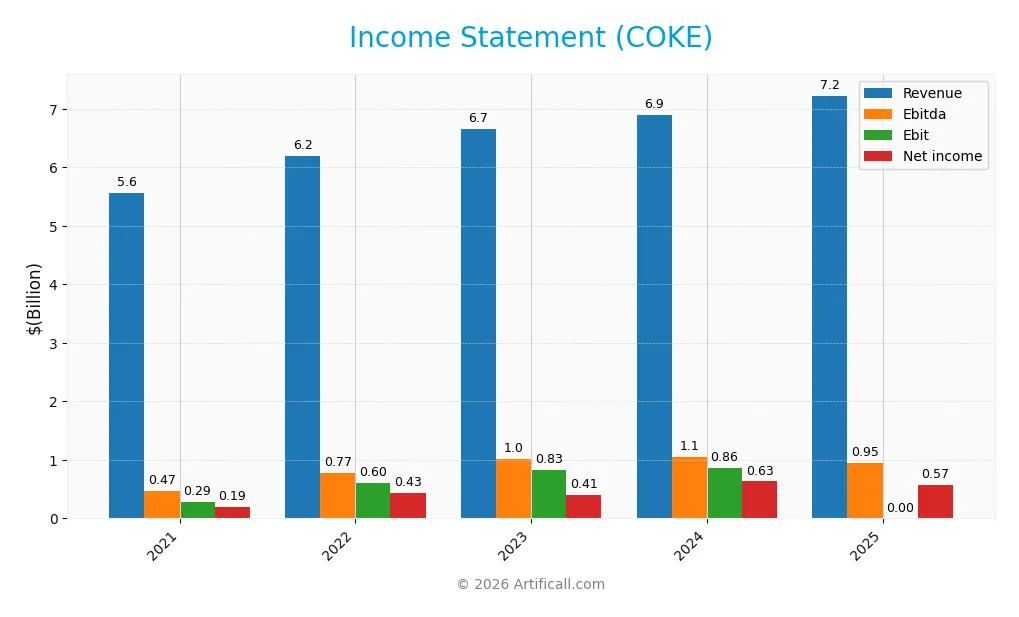
The table below summarizes Coca-Cola Consolidated, Inc.’s key income statement figures from 2021 to 2025, providing a clear view of its financial performance over five fiscal years.
| 2021 | 2022 | 2023 | 2024 | 2025 | |
|---|---|---|---|---|---|
| Revenue | 5.56B | 6.20B | 6.65B | 6.90B | 7.23B |
| Cost of Revenue | 3.61B | 3.92B | 4.06B | 4.15B | 4.36B |
| Operating Expenses | 1.52B | 1.64B | 1.76B | 1.83B | 1.92B |
| Gross Profit | 1.95B | 2.28B | 2.60B | 2.75B | 2.87B |
| EBITDA | 469M | 771M | 1.01B | 1.05B | 951M |
| EBIT | 289M | 600M | 834M | 859M | 0 |
| Interest Expense | 33M | 25M | 0 | 2M | 43M |
| Net Income | 190M | 430M | 408M | 633M | 571M |
| EPS | 2.02 | 4.59 | 4.36 | 7.01 | 7.75 |
| Filing Date | 2022-02-22 | 2023-02-22 | 2024-02-21 | 2025-02-20 | 2026-02-18 |
Income Statement Evolution
Coca-Cola Consolidated’s revenue rose steadily, growing nearly 30% from 2021 to 2025. Net income more than tripled over the same period, reflecting stronger profitability. Gross margin remained stable near 40%, while net margin improved significantly, indicating better cost control and pricing power. However, EBIT margin collapsed to zero in 2025, signaling operational challenges.
Is the Income Statement Favorable?
In 2025, revenue grew 4.8% year-over-year, but EBIT fell sharply, dragging net margin down by nearly 14%. Interest expense stayed low at 0.59% of revenue, supporting financial stability. Despite margin pressures and declining EPS by 2.6%, the overall income statement remains favorable due to sustained top-line growth and improved net profitability over the longer term.
Financial Ratios
The following table summarizes key financial ratios for Coca-Cola Consolidated, Inc. over the 2021–2025 fiscal years:
| Ratios | 2021 | 2022 | 2023 | 2024 | 2025 |
|---|---|---|---|---|---|
| Net Margin | 3.4% | 6.9% | 6.1% | 9.2% | 7.9% |
| ROE | 26.6% | 38.6% | 28.4% | 44.7% | -77.1% |
| ROIC | 12.4% | 16.9% | 18.9% | 15.5% | 21.3% |
| P/E | 30.6 | 11.2 | 21.3 | 18.0 | 19.8 |
| P/B | 8.2 | 4.3 | 6.1 | 8.0 | -15.3 |
| Current Ratio | 1.3 | 1.4 | 1.6 | 1.9 | 1.3 |
| Quick Ratio | 0.9 | 1.0 | 1.3 | 1.7 | 1.0 |
| D/E | 1.3 | 0.7 | 0.5 | 1.3 | -3.9 |
| Debt-to-Assets | 27.2% | 20.4% | 17.1% | 35.9% | 67.6% |
| Interest Coverage | 13.1 | 25.9 | 0 | 498.0 | 22.3 |
| Asset Turnover | 1.6 | 1.7 | 1.6 | 1.3 | 1.7 |
| Fixed Asset Turnover | 4.5 | 4.7 | 4.6 | 4.3 | 4.2 |
| Dividend Yield | 0.16% | 0.20% | 0.54% | 1.63% | 0.77% |
Evolution of Financial Ratios
From 2021 to 2025, Coca-Cola Consolidated’s ROE showed volatility, peaking positively in 2024 before plunging to -77% in 2025. The current ratio declined from 1.94 in 2024 to 1.26 in 2025, indicating reduced short-term liquidity. Debt-to-equity shifted from positive 1.35 in 2024 to -3.93 in 2025, reflecting unusual capital structure changes. Profitability stabilized at a neutral net margin of 7.9% in 2025.
Are the Financial Ratios Favorable?
In 2025, profitability metrics presented mixed signals: a favorable ROIC of 21.3% and neutral net margin of 7.9%, but ROE was deeply negative at -77%. Liquidity ratios were neutral, with current and quick ratios around 1.26 and 0.97. Leverage was unfavorable with a high 67.6% debt-to-assets and zero interest coverage, yet debt-to-equity was favorable due to a negative value. Efficiency ratios like asset turnover (1.68) were solid, but the low dividend yield of 0.77% was unfavorable. Overall, the profile is slightly favorable with 43% favorable ratios.
Shareholder Return Policy
Coca-Cola Consolidated, Inc. maintains a moderate dividend payout ratio around 15% in 2025, with dividends per share rising to $1.18. The dividend yield remains under 1%, supported by share buybacks and free cash flow coverage, indicating a balanced capital return approach.
This policy reflects prudent capital allocation, minimizing risk of unsustainable distributions. The combination of dividends and buybacks aligns with sustainable long-term shareholder value, given stable profit margins and strong free cash flow relative to dividend payments.
Score analysis
Here is a radar chart summarizing key financial scores for Coca-Cola Consolidated, Inc.:
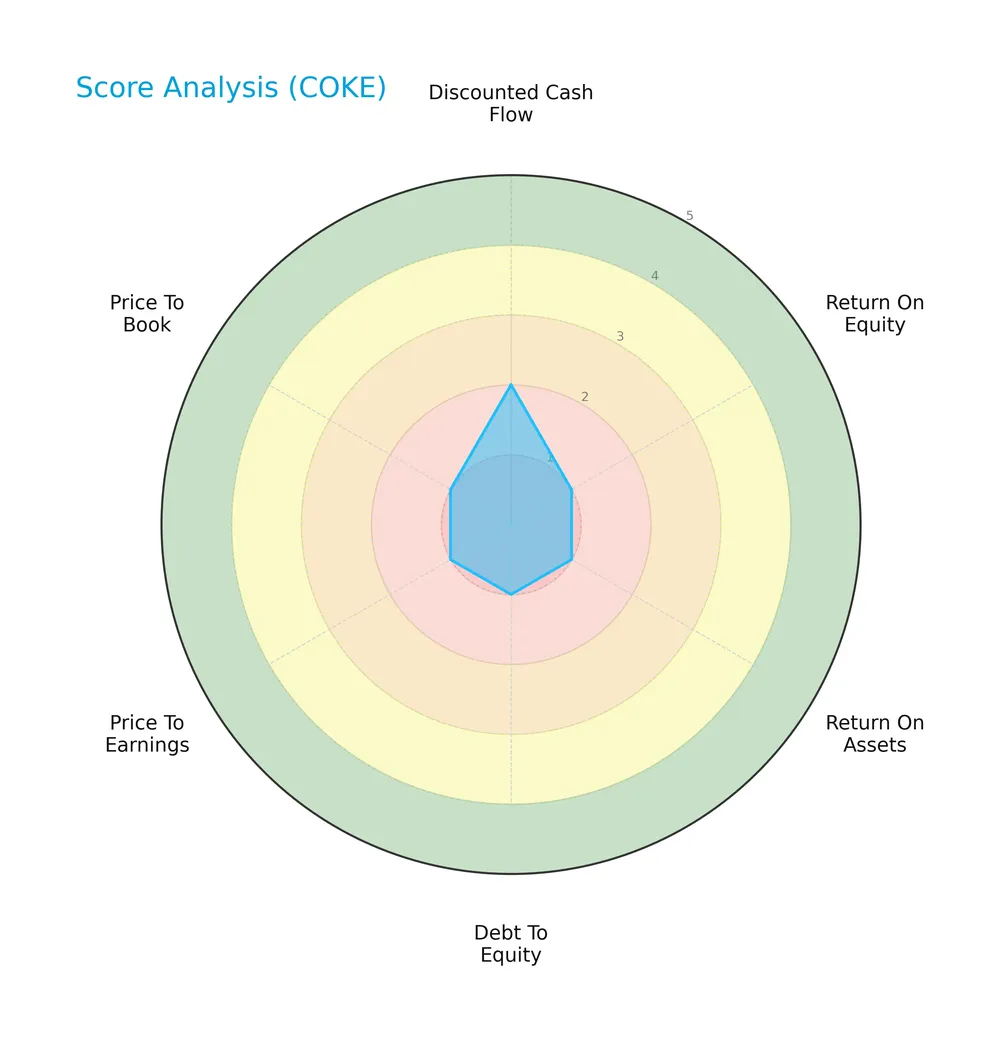
The company scores very unfavorably on return on equity, assets, debt to equity, price to earnings, and price to book ratios. Its discounted cash flow score is slightly better but still unfavorable, indicating overall weak financial metrics.
Analysis of the company’s bankruptcy risk
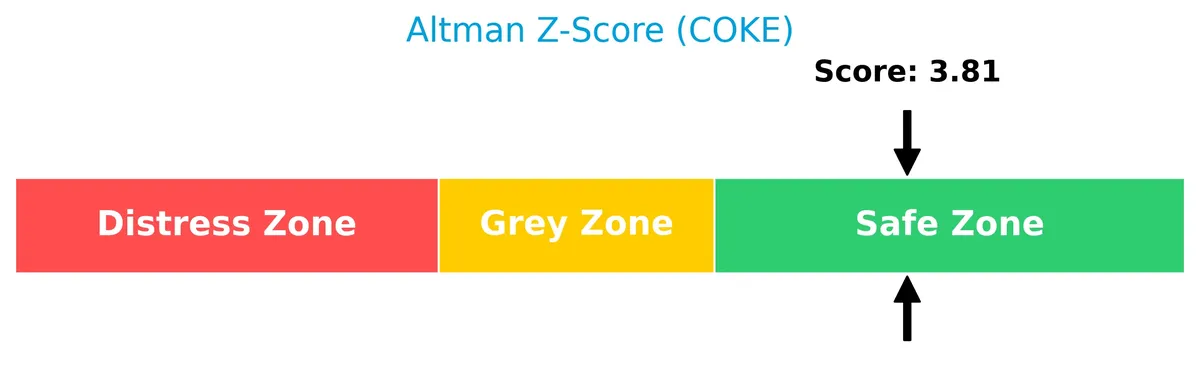
The Altman Z-Score indicates Coca-Cola Consolidated, Inc. is in the safe zone, suggesting a low risk of bankruptcy at this time:
Is the company in good financial health?
The Piotroski Score diagram provides insight into the company’s financial condition:

With a score of 6, Coca-Cola Consolidated, Inc. falls into the average range. This suggests moderate financial health, reflecting neither strong nor weak fundamentals.
Competitive Landscape & Sector Positioning
This analysis explores Coca-Cola Consolidated, Inc.’s sector positioning and competitive environment in non-alcoholic beverages. I will assess whether the company holds a competitive advantage over its main rivals.
Strategic Positioning
Coca-Cola Consolidated, Inc. focuses predominantly on nonalcoholic beverages, generating over $7.1B in 2025, complemented by a smaller, diversified segment of other operating revenues near $326M. Its geographic exposure remains concentrated in the US, emphasizing direct distribution to retail and commercial outlets.
Revenue by Segment
This pie chart depicts Coca-Cola Consolidated, Inc.’s revenue breakdown by segment for the fiscal year 2025, highlighting its business composition and revenue sources.
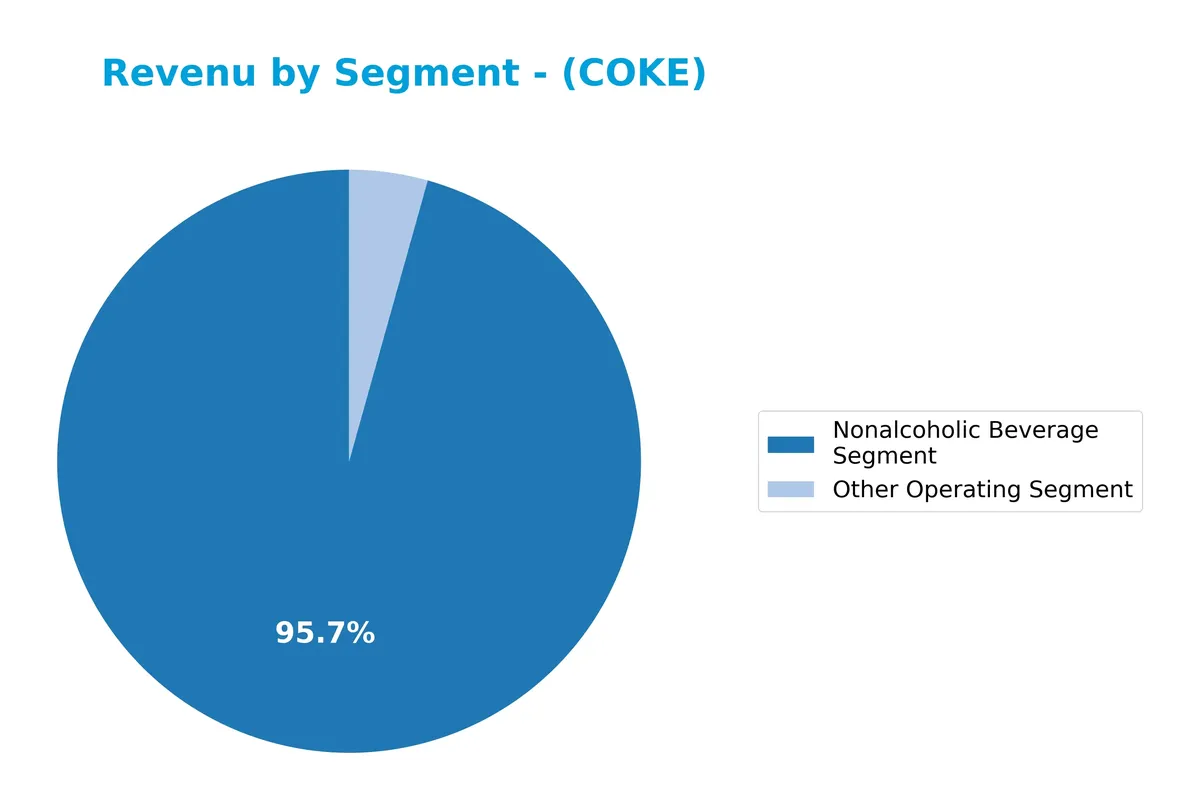
The Nonalcoholic Beverage Segment remains the dominant revenue driver at $7.18B in 2025, showing steady growth from $6.84B in 2024. The Other Operating Segment contributes a modest $326M, slightly declining from prior years. This concentration underscores Coca-Cola Consolidated’s reliance on its core beverage business, with no significant diversification yet. The upward revenue trend signals operational strength but raises concentration risk on the beverage segment.
Key Products & Brands
The company’s product portfolio centers on nonalcoholic beverages and complementary distribution services:
| Product | Description |
|---|---|
| Sparkling Beverages | Carbonated drinks, primarily Coca-Cola branded, sold in bottles and cans. |
| Still Beverages | Noncarbonated drinks including bottled water, ready-to-drink coffee and tea, enhanced water, juices, sports drinks, and energy products. |
| Post-Mix Products | Fountain syrup mixed with carbonated or still water for retail dispensing in cups or glasses. |
| Distribution Services | Delivery of Coca-Cola products and other beverage brands like Dr Pepper and Monster Energy to retail and foodservice customers. |
Coca-Cola Consolidated’s revenue is heavily weighted toward sparkling and still beverages. The company also plays a key role in distributing post-mix products and third-party brands, underpinning its comprehensive beverage market presence.
Main Competitors
There are 7 competitors in total, with the table displaying the top 7 leaders by market capitalization:
| Competitor | Market Cap. |
|---|---|
| The Coca-Cola Company | 297B |
| PepsiCo, Inc. | 194B |
| Monster Beverage Corporation | 74B |
| Coca-Cola Europacific Partners PLC | 42B |
| Keurig Dr Pepper Inc. | 38B |
| Coca-Cola Consolidated, Inc. | 13B |
| Celsius Holdings, Inc. | 12B |
Coca-Cola Consolidated ranks 6th among its 7 competitors. Its market cap is roughly 5% of the leader, The Coca-Cola Company. The company stands below both the average market cap of the top 10 competitors (95.8B) and the median sector market cap (41.7B). It maintains a significant 154% market cap gap above its nearest rival, Celsius Holdings.
Comparisons with competitors
Check out how we compare the company to its competitors:
Does COKE have a competitive advantage?
Coca-Cola Consolidated, Inc. demonstrates a very favorable competitive advantage, with ROIC exceeding WACC by over 15%, signaling strong value creation and efficient capital use. I observe a growing ROIC trend of 72%, indicating increasing profitability and a sustainable moat in the non-alcoholic beverage sector.
Looking ahead, the company’s diverse product portfolio, including sparkling and still beverages plus energy drinks, positions it well for expanding distribution and market penetration. Opportunities lie in leveraging brand strength to enter new retail channels and innovate within growing beverage segments.
SWOT Analysis
This analysis highlights Coca-Cola Consolidated’s core competitive factors and risks to guide strategic decisions.
Strengths
- strong market position
- growing ROIC well above WACC
- diverse product portfolio including energy and still beverages
Weaknesses
- negative return on equity
- high debt-to-assets ratio
- unfavorable interest coverage ratio
Opportunities
- expanding non-carbonated beverage demand
- growth in direct-to-retail channels
- leveraging sustainable competitive advantage
Threats
- intense industry competition
- rising input costs
- regulatory pressures on sugary drinks
Coca-Cola Consolidated’s solid moat and product diversity support long-term value creation. However, financial weaknesses and external pressures require prudent capital management and innovation to sustain growth.
Stock Price Action Analysis
The weekly stock chart below illustrates Coca-Cola Consolidated, Inc.’s price movements over the past 100 weeks, highlighting key support and resistance levels:
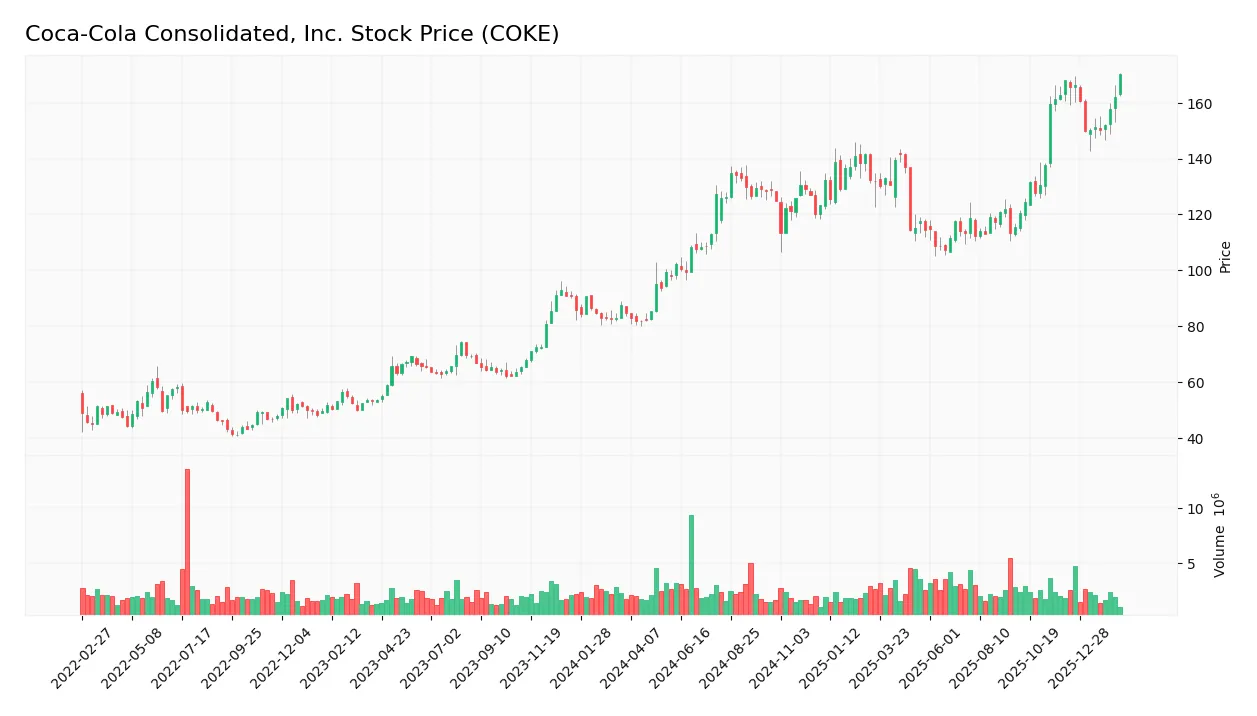
Trend Analysis
Over the past 100 weeks, COKE’s stock price rose sharply by 101.19%, confirming a bullish trend despite decelerating momentum. The price ranged between 81.69 and 170.29, with volatility measured by a 20.17 standard deviation. However, the recent 11-week period shows a neutral trend with a modest 1.31% gain and a slight negative slope.
Volume Analysis
Trading volume is increasing overall, with buyers accounting for 56.46% of 295.6M shares traded, signaling buyer dominance. In the recent 11 weeks, buyer volume surged to 69.25% of total trades, reinforcing strong market participation and bullish investor sentiment during this period.
Target Prices
No verified target price data is available from recognized analysts for Coca-Cola Consolidated, Inc. Current market sentiment appears mixed, reflecting cautious investor outlook.

Don’t Let Luck Decide Your Entry Point
Optimize your entry points with our advanced ProRealTime indicators. You’ll get efficient buy signals with precise price targets for maximum performance. Start outperforming now!
Analyst & Consumer Opinions
This section examines the recent analyst ratings and consumer feedback trends for Coca-Cola Consolidated, Inc. (COKE).
Stock Grades
Here are the recent verified stock grades from a recognized analyst for Coca-Cola Consolidated, Inc.:
| Grading Company | Action | New Grade | Date |
|---|---|---|---|
| Citigroup | Maintain | Neutral | 2016-05-20 |
| Citigroup | Maintain | Neutral | 2016-05-19 |
| Citigroup | Maintain | Neutral | 2015-07-27 |
| Citigroup | Maintain | Neutral | 2015-07-26 |
| Citigroup | Maintain | Neutral | 2015-05-07 |
| Citigroup | Maintain | Neutral | 2015-05-06 |
| Citigroup | Maintain | Neutral | 2015-03-06 |
| Citigroup | Maintain | Neutral | 2015-03-05 |
| Citigroup | Maintain | Neutral | 2014-11-13 |
| Citigroup | Maintain | Neutral | 2014-11-12 |
The grades reveal a consistent Neutral stance from Citigroup over multiple years, indicating stable but unremarkable expectations. The consensus view also aligns with a Hold rating, reflecting a cautious but steady market outlook.
Consumer Opinions
Consumers express a mix of admiration and frustration toward Coca-Cola Consolidated, Inc., reflecting its strong brand presence but occasional service hiccups.
| Positive Reviews | Negative Reviews |
|---|---|
| “Consistently fresh products with great taste.” | “Delivery delays disrupt local availability.” |
| “Friendly customer service representatives.” | “Pricing feels high compared to competitors.” |
| “Wide variety of beverages to choose from.” | “Occasional stock shortages at stores.” |
Overall, customers praise Coca-Cola Consolidated’s product quality and customer service. However, delivery delays and pricing concerns recur as notable weaknesses, suggesting room for operational improvements.
Risk Analysis
The following table highlights key risks facing Coca-Cola Consolidated, Inc., with probability and impact assessments:
| Category | Description | Probability | Impact |
|---|---|---|---|
| Financial Leverage | High debt-to-assets ratio at 67.56% increases financial risk. | High | High |
| Interest Coverage | Zero interest coverage ratio signals inability to cover interest expenses. | Moderate | High |
| Profitability | Negative ROE (-77.13%) indicates poor returns to equity holders. | Moderate | Moderate |
| Dividend Yield | Low dividend yield (0.77%) may reduce income appeal for investors. | Moderate | Low |
| Liquidity | Current ratio at 1.26 and quick ratio at 0.97 suggest adequate liquidity but no strong buffer. | Moderate | Moderate |
| Market Valuation | P/E ratio of 19.79 is neutral but price-to-book is negative, raising valuation concerns. | Low | Moderate |
The highest risk stems from Coca-Cola Consolidated’s elevated debt load and poor interest coverage, which raise default risks despite a solid Altman Z-score in the safe zone (3.81). Negative ROE further signals operational challenges. Investors must watch leverage closely as economic cycles tighten credit conditions.
Should You Buy Coca-Cola Consolidated, Inc.?
Coca-Cola Consolidated appears to be delivering robust value creation supported by a durable competitive moat and a growing ROIC. Despite a manageable leverage profile, its overall rating of D+ suggests caution, reflecting mixed operational efficiency and valuation metrics.
Strength & Efficiency Pillars
Coca-Cola Consolidated, Inc. demonstrates solid operational efficiency with a net margin of 7.89% and a growing ROIC of 21.27%. Its ROIC comfortably exceeds the WACC of 6.03%, marking the company as a clear value creator. The firm’s asset turnover ratio of 1.68 and fixed asset turnover of 4.2 further underpin its effective use of invested capital. While the return on equity stands at an unfavorable -77.13%, the overall profitability and capital efficiency signal robust operational foundations.
Weaknesses and Drawbacks
The company faces notable challenges despite operational strengths. Its debt-to-assets ratio is high at 67.56%, flagging elevated leverage risk. Interest coverage is zero, indicating difficulty servicing debt, which is a red flag for creditors. Although the price-to-earnings ratio sits at a neutral 19.79, the dividend yield is low at 0.77%, possibly dampening income-focused investor appeal. These factors, combined with a current ratio of 1.26, suggest moderate liquidity pressure, warranting cautious scrutiny.
Our Final Verdict about Coca-Cola Consolidated, Inc.
Coca-Cola Consolidated presents a fundamentally sound profile with strong value creation and a safe Altman Z-Score of 3.81, mitigating solvency concerns. The bullish long-term trend and recent buyer dominance (69.25%) suggest positive momentum. This profile might appear attractive for long-term exposure, though investors should monitor leverage and interest coverage closely to manage risk effectively.
Disclaimer: This content is for informational purposes only and does not constitute financial, investment, or other professional advice. Investing in financial markets involves a significant risk of loss, and past performance is not indicative of future results.
Additional Resources
- Coca-Cola Consolidated, Inc. $COKE Shares Acquired by Envestnet Asset Management Inc. – MarketBeat (Feb 19, 2026)
- Decoding Coca-Cola Consolidated Inc (COKE): A Strategic SWOT Ins – GuruFocus (Feb 19, 2026)
- Coca-Cola Consolidated: Q4 Earnings Snapshot – kare11.com (Feb 18, 2026)
- Coca-Cola Consolidated, Inc. Q4 Profit Drops – Nasdaq (Feb 18, 2026)
- Coca-Cola Consolidated Q4 Earnings Lower, Revenue Higher – marketscreener.com (Feb 18, 2026)
For more information about Coca-Cola Consolidated, Inc., please visit the official website: cokeconsolidated.com