Home > Analyses > Utilities > CMS Energy Corporation
CMS Energy powers nearly 4 million customers across Michigan, weaving energy into daily life with a vast, reliable network. It excels in regulated electric and gas utilities, blending traditional and renewable energy sources to deliver stability and innovation. Known for its balanced approach to clean energy and infrastructure, CMS shapes the future of power. Yet, as market dynamics evolve, I question if its fundamentals still support the current valuation and growth outlook.

Table of contents
Business Model & Company Overview
CMS Energy Corporation, founded in 1987 and headquartered in Jackson, Michigan, dominates the regulated electric sector in the US. It operates a cohesive energy ecosystem through three segments: Electric Utility, Gas Utility, and Enterprises. Serving 1.9M electric and 1.8M gas customers, the company integrates diverse energy sources like coal, wind, nuclear, and natural gas into a reliable, comprehensive utility network.
The company’s revenue engine balances electricity generation, gas distribution, and renewable energy development across its vast infrastructure—over 82K miles of electric lines and 28K miles of gas mains. Its strategic footprint in the Americas leverages recurring utility services and independent power production. CMS’s economic moat lies in its regulated market position and extensive infrastructure, anchoring its role as a vital energy provider shaping the sector’s future.
Financial Performance & Fundamental Metrics
I will analyze CMS Energy Corporation’s income statement, key financial ratios, and dividend payout policy to assess its overall financial health and shareholder value.
Income Statement
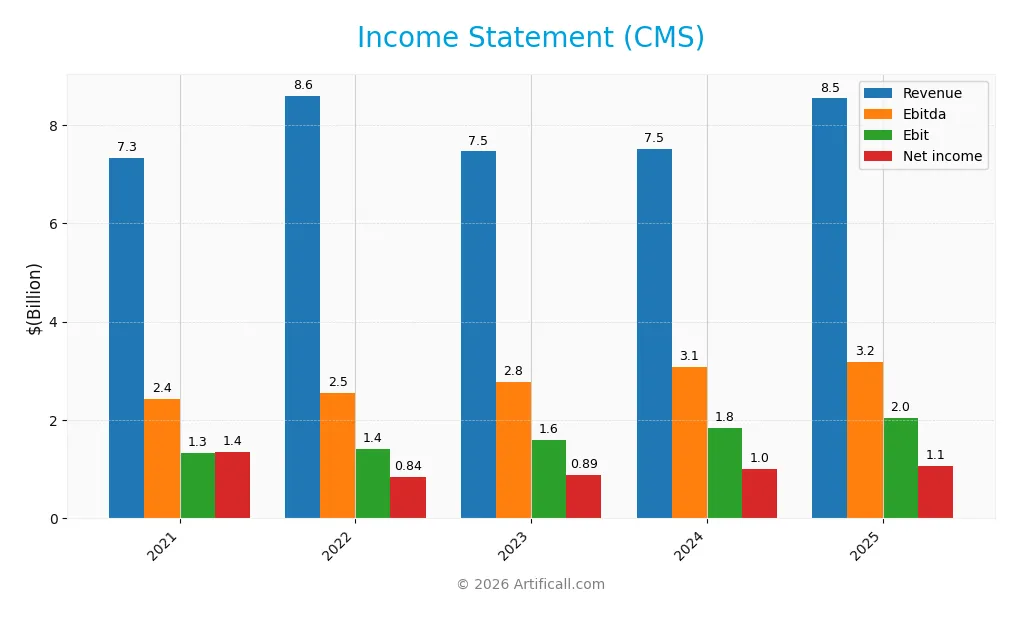
The table below summarizes CMS Energy Corporation’s key income statement metrics over the last five fiscal years, highlighting revenue, expenses, and profitability trends.
| 2021 | 2022 | 2023 | 2024 | 2025 | |
|---|---|---|---|---|---|
| Revenue | 7.33B | 8.60B | 7.46B | 7.52B | 8.54B |
| Cost of Revenue | 4.68B | 5.83B | 4.60B | 4.31B | 3.34B |
| Operating Expenses | 1.50B | 1.54B | 1.63B | 1.72B | 3.47B |
| Gross Profit | 2.65B | 2.76B | 2.86B | 3.21B | 5.20B |
| EBITDA | 2.44B | 2.55B | 2.78B | 3.07B | 3.19B |
| EBIT | 1.32B | 1.42B | 1.60B | 1.83B | 2.04B |
| Interest Expense | 500M | 519M | 643M | 708M | 789M |
| Net Income | 1.35B | 837M | 887M | 1.00B | 1.07B |
| EPS | 4.66 | 2.84 | 3.01 | 3.34 | 3.53 |
| Filing Date | 2022-02-10 | 2023-02-09 | 2024-02-08 | 2025-02-11 | 2026-02-10 |
Income Statement Evolution
From 2021 to 2025, CMS Energy’s revenue grew 16.5%, with a notable 13.6% increase in the last year. Gross profit surged 62% year-over-year, lifting gross margins to a favorable 60.9%. EBIT margin also improved to 23.9%. However, net income declined 20.8% over five years, pressured by compressing net margins falling 32%, signaling some margin erosion.
Is the Income Statement Favorable?
In 2025, CMS reported $8.54B revenue and $1.07B net income, yielding a 12.5% net margin, rated favorable. EBIT grew 11.3% last year, supported by disciplined cost control despite operating expenses rising less favorably at 13.6%. Interest expense remains neutral at 9.2% of revenue. Overall, fundamentals appear solid, although net margin and income weakness merit close monitoring.
Financial Ratios
The table below presents key financial ratios for CMS Energy Corporation over the last five fiscal years, highlighting profitability, efficiency, liquidity, leverage, and shareholder returns:
| Ratios | 2021 | 2022 | 2023 | 2024 | 2025 |
|---|---|---|---|---|---|
| Net Margin | 18% | 10% | 12% | 13% | 13% |
| ROE | 20% | 12% | 12% | 12% | 12% |
| ROIC | 4% | 4% | 3% | 4% | 4% |
| P/E | 14 | 22 | 19 | 20 | 20 |
| P/B | 2.8 | 2.6 | 2.2 | 2.4 | 2.4 |
| Current Ratio | 1.2 | 1.2 | 1.0 | 0.8 | 1.3 |
| Quick Ratio | 0.9 | 0.8 | 0.7 | 0.6 | 1.3 |
| D/E | 1.9 | 2.0 | 2.1 | 2.0 | 2.1 |
| Debt-to-Assets | 43% | 46% | 47% | 46% | 47% |
| Interest Coverage | 2.3 | 2.4 | 1.9 | 2.1 | 2.2 |
| Asset Turnover | 0.25 | 0.27 | 0.22 | 0.21 | 0.21 |
| Fixed Asset Turnover | 0.33 | 0.38 | 0.30 | 0.27 | 0.28 |
| Dividend Yield | 2.7% | 3.0% | 3.4% | 3.2% | 3.1% |
Evolution of Financial Ratios
Return on Equity (ROE) remained stable around 12% from 2021 to 2025, reflecting consistent profitability. The Current Ratio improved from below 1 in 2024 to 1.34 in 2025, indicating better liquidity. Debt-to-Equity Ratio increased slightly to 2.12 in 2025, signaling a steady but high leverage position.
Are the Financial Ratios Fovorable?
Profitability shows mixed signals: net margin is favorable at 12.54%, but ROIC lags at 3.68%, below the WACC of 5.03%. Liquidity is neutral to favorable, with a current ratio of 1.34 and quick ratio at the same level. Leverage is unfavorable given the D/E ratio of 2.12. Market multiples like P/E and P/B are neutral. Overall, the financial ratios present a neutral profile.
Shareholder Return Policy
CMS Energy Corporation maintains a dividend payout ratio near 60%, with a stable dividend per share rising from $1.76 in 2021 to $2.17 in 2025. The annual dividend yield stands around 3.1%, supported by free cash flow coverage, though capital expenditures often strain cash resources.
The company also conducts share buybacks, complementing dividends to return capital. While the payout is moderately covered by free cash flow, elevated debt levels and variable cash ratios pose risks. This balanced approach appears consistent with sustaining long-term shareholder value but warrants monitoring of financial leverage.
Score analysis
The radar chart below presents CMS Energy Corporation’s key financial scores for a comprehensive view:
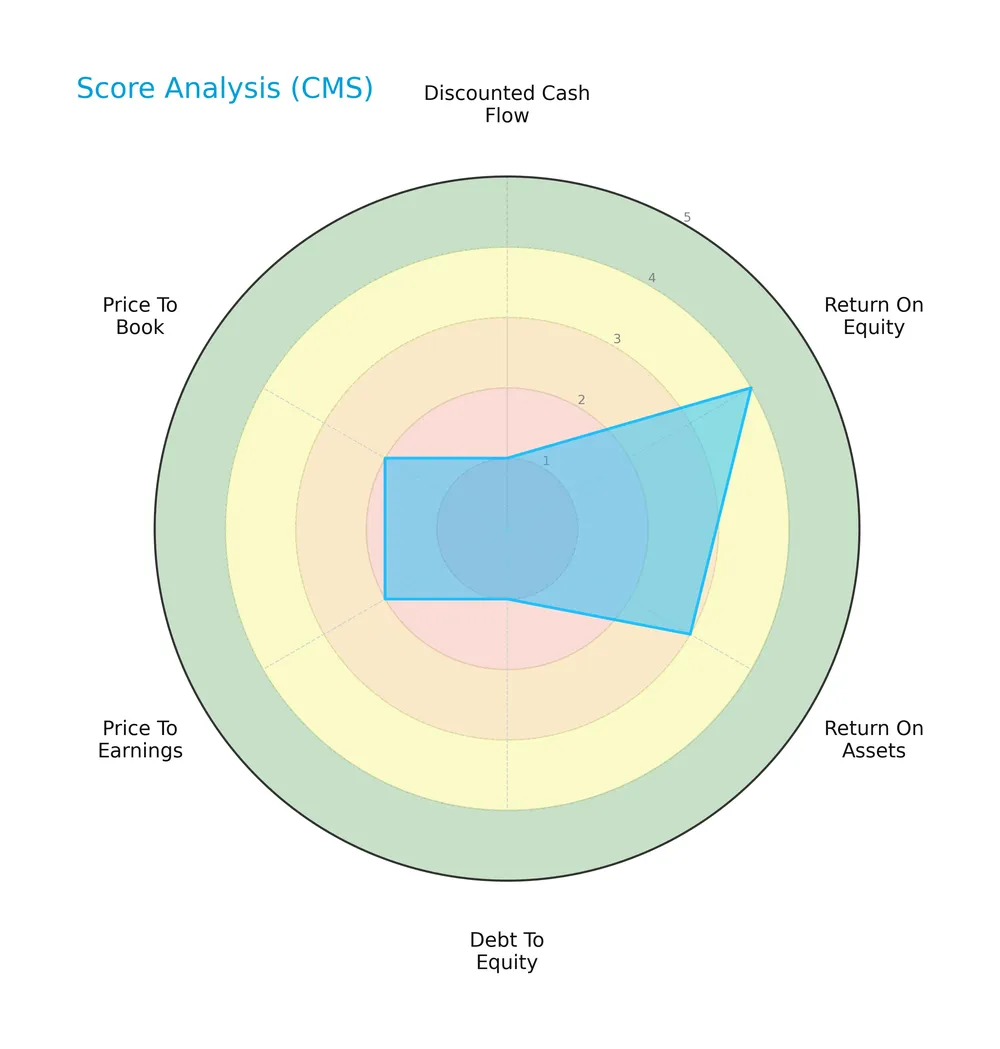
CMS demonstrates a strong return on equity (4) and moderate return on assets (3). However, it struggles with debt-to-equity (1) and discounted cash flow (1). Valuation metrics price-to-earnings (2) and price-to-book (2) remain unfavorable.
Analysis of the company’s bankruptcy risk
CMS Energy Corporation’s Altman Z-Score places it in the distress zone, signaling a high risk of financial distress and potential bankruptcy:

Is the company in good financial health?
The Piotroski Score diagram offers insight into CMS’s overall financial strength:

With a Piotroski Score of 7, CMS shows strong financial health, reflecting solid profitability and operational efficiency despite some balance sheet concerns.
Competitive Landscape & Sector Positioning
This sector analysis reviews CMS Energy Corporation’s strategic positioning, revenue breakdown, key products, and main competitors. I will evaluate whether CMS holds a competitive advantage within the regulated electric utilities sector.
Strategic Positioning
CMS Energy Corporation concentrates primarily on utility services within Michigan, generating over 8B in revenue from residential, commercial, and industrial segments. Its portfolio spans electric and gas utilities plus renewable enterprises, reflecting a focused regional presence with diversified energy sources but limited geographic expansion.
Revenue by Segment
This pie chart illustrates CMS Energy Corporation’s revenue distribution by segment for fiscal year 2025, highlighting the relative contribution of each utility service line.
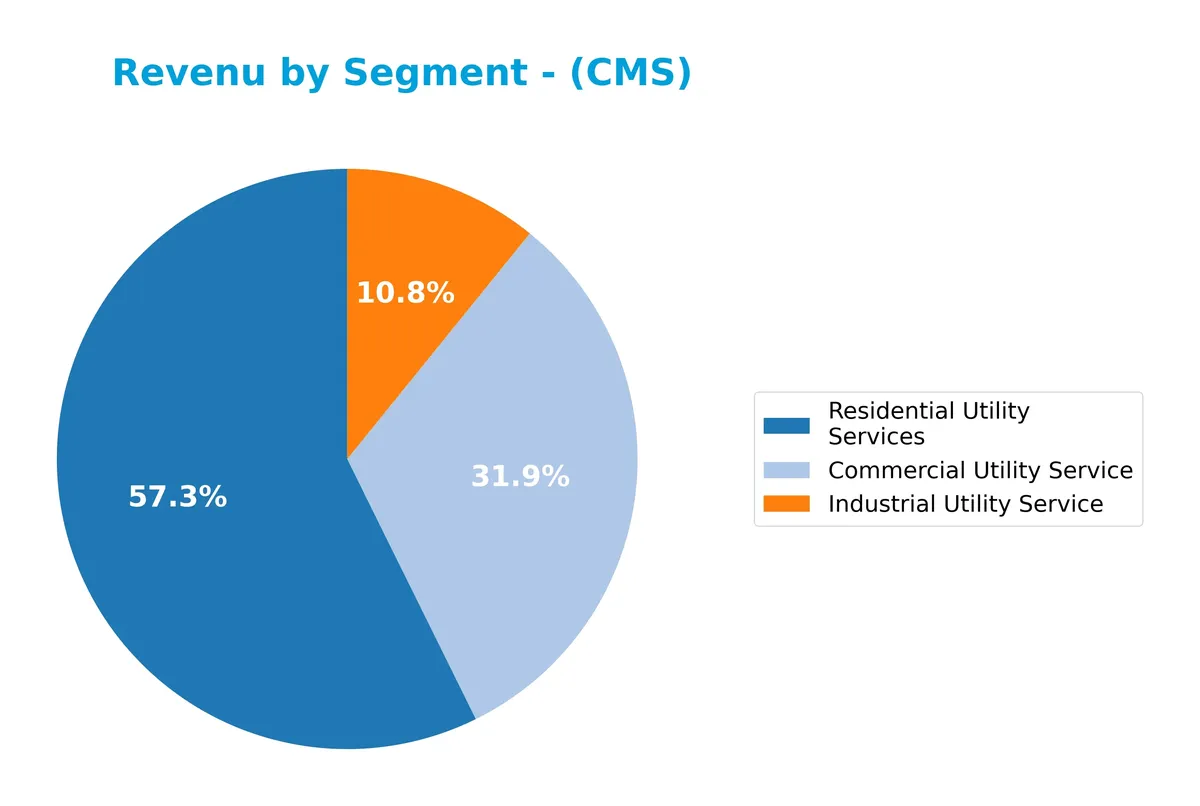
Residential Utility Services dominate CMS’s revenue at 4.36B in 2025, showing steady growth since 2018. Commercial Utility Service follows with 2.43B, accelerating notably from 2.11B in 2024. Industrial Utility Service remains the smallest core segment at 824M but also grows steadily. The rising share of Commercial services signals a strategic shift towards business clients, while Residential continues as the backbone.
Key Products & Brands
CMS Energy Corporation generates revenue primarily through regulated utility services, segmented as follows:
| Product | Description |
|---|---|
| Commercial Utility Service | Electricity and gas supply services tailored for commercial customers, generating $2.43B in 2025. |
| Industrial Utility Service | Utility services focused on industrial clients, with revenue of $824M in 2025. |
| Residential Utility Services | Electricity and gas distribution for residential customers, the largest segment at $4.36B in 2025. |
CMS Energy’s core offerings revolve around regulated electric and gas utilities serving commercial, industrial, and residential customers, reflecting a stable revenue base anchored in Michigan’s energy market.
Main Competitors
The Utilities sector includes 23 competitors, with the table below listing the top 10 leaders by market capitalization:
| Competitor | Market Cap. |
|---|---|
| NextEra Energy, Inc. | 169B |
| The Southern Company | 96B |
| Duke Energy Corporation | 91B |
| American Electric Power Company, Inc. | 62B |
| Dominion Energy, Inc. | 51B |
| Exelon Corporation | 44B |
| Xcel Energy Inc. | 44B |
| Entergy Corporation | 42B |
| Public Service Enterprise Group Incorporated | 40B |
| Consolidated Edison, Inc. | 36B |
CMS Energy Corporation ranks 19th among 23 competitors, with a market cap at just 13.45% of the leader, NextEra Energy. The company sits below both the average market cap of the top 10 competitors (67.5B) and the sector median (34B). Its market cap is only 3.38% above the next competitor, indicating a narrow gap but a clear lag behind the top tier.
Comparisons with competitors
Check out how we compare the company to its competitors:
Does CMS have a competitive advantage?
CMS Energy Corporation does not currently present a competitive advantage. Its return on invested capital (ROIC) is below its weighted average cost of capital (WACC), indicating value destruction and declining profitability.
Looking ahead, CMS focuses on expanding its renewable energy segment and maintaining a diversified energy mix. Growth opportunities lie in serving 1.9M electric and 1.8M gas customers within Michigan’s regulated market.
SWOT Analysis
This SWOT analysis highlights CMS Energy Corporation’s strategic position, identifying internal strengths and weaknesses alongside external opportunities and threats.
Strengths
- Regulated utility with stable customer base
- Diverse energy mix including renewables
- Favorable gross and EBIT margins
Weaknesses
- Declining ROIC indicates value destruction
- High debt-to-equity ratio raises financial risk
- Net margin and EPS growth negative over period
Opportunities
- Expansion in renewable energy production
- Increasing demand for clean energy solutions
- Potential regulatory incentives for green projects
Threats
- Regulatory changes impacting rates
- Rising operational costs
- Competition from alternative energy providers
CMS’s solid utility base and margin strength support steady cash flow. However, declining profitability and leverage risks demand strategic focus on debt management and operational efficiency. Growth hinges on capitalizing renewable energy trends while mitigating regulatory and market pressures.
Stock Price Action Analysis
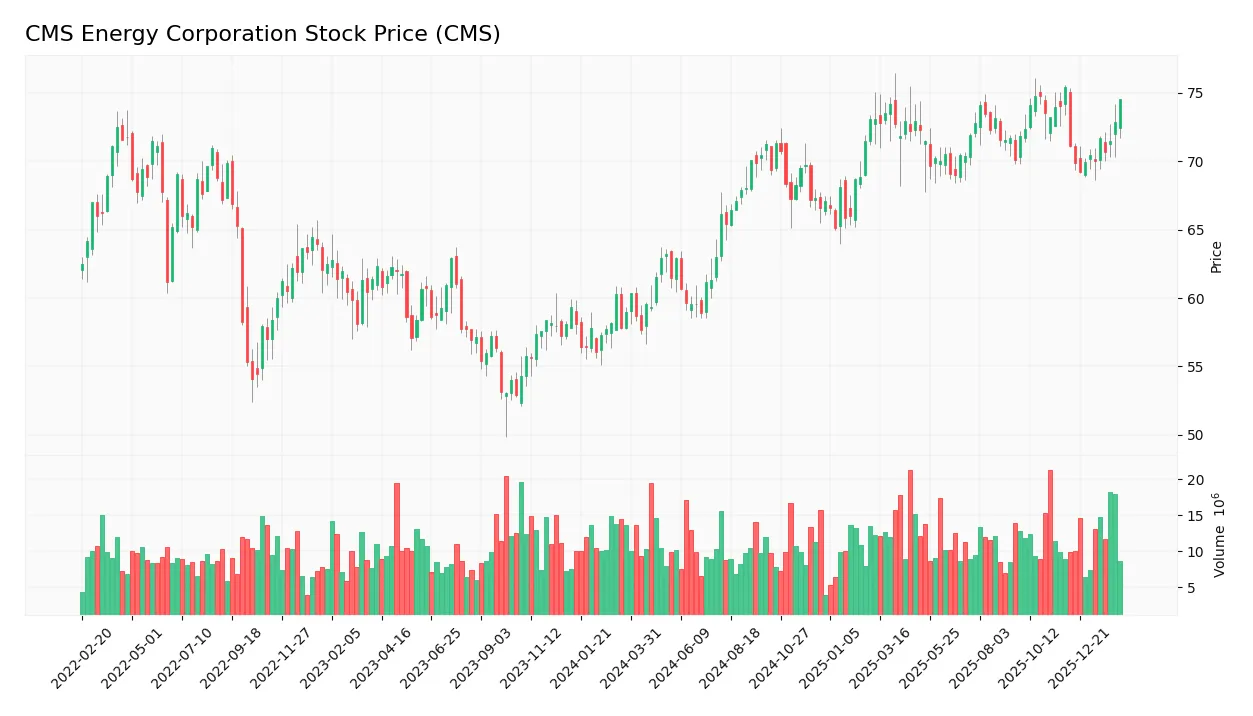
The weekly stock chart for CMS Energy Corporation reveals price movement and volatility patterns over the past 12 months, highlighting key support and resistance levels:
Trend Analysis
Over the past 12 months, CMS stock gained 26.37%, indicating a bullish trend. The price ranged from 57.66 to 75.44 but showed deceleration in upward momentum. Volatility measured by 4.62% standard deviation confirms moderate price fluctuations throughout this period.
Volume Analysis
Trading volume shows an increasing trend, with buyer volume slightly dominating at 58.16% over the last three months. This suggests growing investor interest and moderately positive market participation favoring buyers in recent sessions.
Target Prices
Analysts set a clear target consensus for CMS Energy Corporation.
| Target Low | Target High | Consensus |
|---|---|---|
| 74 | 82 | 78.38 |
The target range indicates moderate upside potential. Analysts expect CMS to trade near $78, reflecting confidence in its stable utility sector position.

Don’t Let Luck Decide Your Entry Point
Optimize your entry points with our advanced ProRealTime indicators. You’ll get efficient buy signals with precise price targets for maximum performance. Start outperforming now!
Analyst & Consumer Opinions
This section examines recent analyst grades and consumer feedback to provide a balanced view of CMS Energy Corporation.
Stock Grades
Here are the latest verified stock grades for CMS Energy Corporation from respected analysts:
| Grading Company | Action | New Grade | Date |
|---|---|---|---|
| BMO Capital | Maintain | Outperform | 2026-02-09 |
| Mizuho | Maintain | Neutral | 2026-02-06 |
| Morgan Stanley | Maintain | Equal Weight | 2026-02-02 |
| Jefferies | Maintain | Buy | 2026-01-28 |
| Wells Fargo | Maintain | Equal Weight | 2026-01-20 |
| Barclays | Maintain | Overweight | 2026-01-15 |
| JP Morgan | Maintain | Overweight | 2026-01-15 |
| Jefferies | Maintain | Buy | 2026-01-15 |
| UBS | Maintain | Neutral | 2025-12-17 |
| JP Morgan | Maintain | Overweight | 2025-12-11 |
The consensus leans toward a “Buy” rating, reflecting confidence in CMS Energy’s growth prospects. Most firms maintain their prior grades, indicating stable analyst sentiment.
Consumer Opinions
CMS Energy Corporation evokes mixed reactions from its customer base, reflecting both strong service loyalty and areas needing improvement.
| Positive Reviews | Negative Reviews |
|---|---|
| Reliable energy supply with minimal outages | Customer service response times can lag |
| Transparent billing and clear statements | Some complain about rising rates |
| Community involvement and sustainability efforts praised | Occasional delays in issue resolution |
Overall, consumers appreciate CMS Energy’s reliability and commitment to sustainability. However, slow customer support and rate hikes remain common concerns, indicating room for operational improvements.
Risk Analysis
Below is a detailed table summarizing CMS Energy Corporation’s key risks, their likelihood, and potential impact:
| Category | Description | Probability | Impact |
|---|---|---|---|
| Financial Health | Altman Z-Score of 0.95 signals high bankruptcy risk; company in distress zone financially. | High | Severe |
| Leverage Risk | Debt-to-equity ratio at 2.12 is elevated, increasing financial strain and interest burden. | Medium | High |
| Operational Efficiency | Low asset turnover (0.21) and fixed asset turnover (0.28) indicate inefficient asset use. | Medium | Medium |
| Market Volatility | Beta of 0.48 suggests lower stock volatility but limited upside during bull markets. | Low | Low |
| Regulatory Risk | Heavy regulation in the utilities sector could impact earnings and capital expenditures. | Medium | High |
| Dividend Sustainability | Dividend yield at 3.1% is attractive but depends on stable cash flows amid debt levels. | Medium | Medium |
CMS Energy faces its most critical risk from financial distress, as its Altman Z-score places it in the distress zone. This is compounded by high leverage, which tightens financial flexibility. Operational inefficiencies also limit earnings growth. Regulatory pressures remain a consistent threat in this sector. I advise cautious monitoring given these risks despite the company’s strong Piotroski score and stable dividend yield.
Should You Buy CMS Energy Corporation?
CMS Energy appears to be navigating a challenging phase with declining operational efficiency and a deteriorating moat, indicated by negative ROIC trends. Despite manageable profitability and a strong Piotroski score, its substantial leverage and low Altman Z-score suggest elevated financial risk, warranting cautious interpretation. The overall rating of C+ reflects this mixed profile.
Strength & Efficiency Pillars
CMS Energy Corporation posts a solid net margin of 12.54%, reflecting operational profitability in a challenging sector. The company maintains a neutral return on equity at 12.01%, signaling moderate shareholder value generation. However, its return on invested capital (ROIC) stands at 3.68%, below its weighted average cost of capital (WACC) at 5.03%, indicating value erosion rather than creation. Despite favorable gross margin (60.91%) and EBIT margin (23.86%), CMS struggles to convert capital into lasting value, a red flag for efficiency-focused investors.
Weaknesses and Drawbacks
CMS Energy is in financial distress, with an Altman Z-Score of 0.95 firmly placing it in the distress zone, signaling a high bankruptcy risk. This solvency concern outweighs operational strengths. The company’s debt-to-equity ratio is elevated at 2.12, indicating heavy leverage that exacerbates financial strain. Valuation metrics are neutral but not compelling, with a P/E of 19.63 and P/B of 2.36, offering limited margin of safety. Liquidity ratios are modest (current ratio 1.34), providing minimal cushion against short-term obligations.
Our Final Verdict about CMS Energy Corporation
Despite operational profitability, CMS Energy’s distress zone Z-Score of 0.95 makes its financial profile highly speculative. The solvency risk overshadows moderate margins and a bullish long-term price trend. Investors should approach with extreme caution, as this company may be too risky for conservative capital. Patience and rigorous risk monitoring are essential before considering exposure to CMS.
Disclaimer: This content is for informational purposes only and does not constitute financial, investment, or other professional advice. Investing in financial markets involves a significant risk of loss, and past performance is not indicative of future results.
Additional Resources
- Compared to Estimates, CMS Energy (CMS) Q4 Earnings: A Look at Key Metrics – Yahoo Finance (Feb 11, 2026)
- CMS Energy Corporation $CMS Shares Purchased by ING Groep NV – MarketBeat (Feb 11, 2026)
- Compared to Estimates, CMS Energy (CMS) Q4 Earnings: A Look at Key Metrics – Nasdaq (Feb 11, 2026)
- Decoding CMS Energy Corp (CMS): A Strategic SWOT Insight – GuruFocus (Feb 11, 2026)
- CMS Energy Exceeds Earnings Guidance in 2025, Raises 2026 Adjusted EPS Guidance – PR Newswire (Feb 05, 2026)
For more information about CMS Energy Corporation, please visit the official website: cmsenergy.com