Home > Analyses > Financial Services > CME Group Inc.
CME Group Inc. powers the global flow of capital by enabling trillions in futures and options trading daily. Its exchanges set benchmarks across interest rates, commodities, and equity indexes, shaping risk management worldwide. Known for innovation and robust clearing services, CME commands industry respect and loyalty from diverse market participants. As volatility and regulation evolve, I question whether CME’s fundamentals still support its premium valuation and growth ambitions in 2026.

Table of contents
Business Model & Company Overview
CME Group Inc., founded in 1898 and based in Chicago, dominates the global futures and options trading landscape. Its core business unites diverse financial instruments—interest rates, equity indexes, foreign exchange, commodities, and metals—into a seamless trading ecosystem. This integrated platform serves a broad spectrum of market participants, from professional traders to central banks, positioning CME Group as a critical infrastructure in global finance.
The company’s revenue engine balances transaction fees from futures and options with recurring income from clearing services and market data subscriptions. CME Group operates strategically across the Americas, Europe, and Asia, ensuring global market access and liquidity. Its strong competitive advantage lies in its trusted clearinghouse role and comprehensive product suite, creating a durable economic moat that shapes the future of financial trading worldwide.
Financial Performance & Fundamental Metrics
I analyze CME Group Inc.’s income statement, key financial ratios, and dividend payout policy to assess its core financial health and shareholder value.
Income Statement
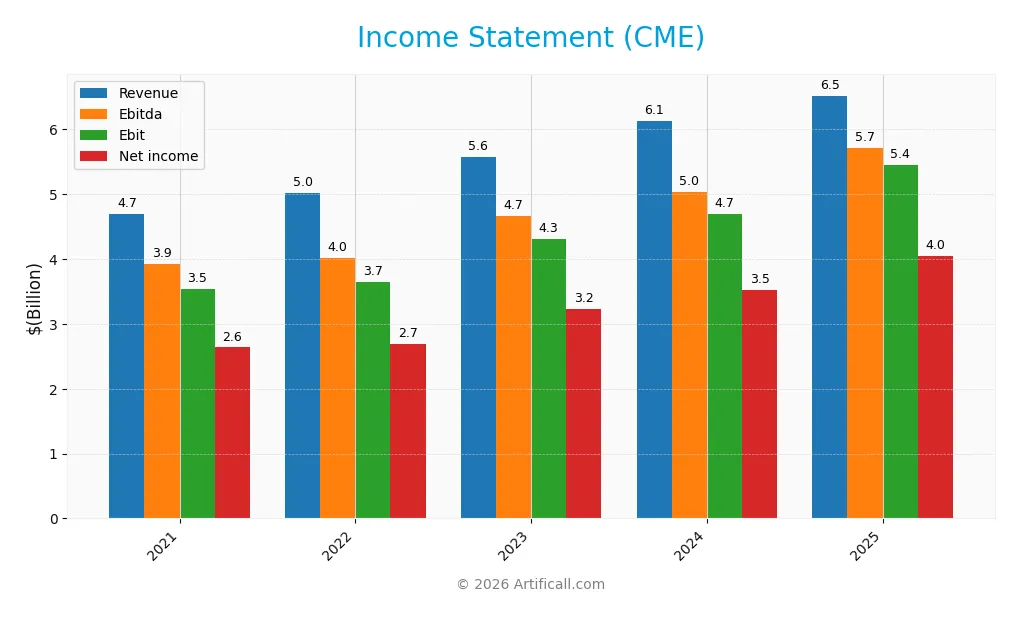
The table below presents CME Group Inc.’s income statement data for fiscal years 2021 through 2025, reported in USD.
| 2021 | 2022 | 2023 | 2024 | 2025 | |
|---|---|---|---|---|---|
| Revenue | 4.69B | 5.02B | 5.58B | 6.13B | 6.52B |
| Cost of Revenue | 837M | 753M | 829M | 850M | 907M |
| Operating Expenses | 1.21B | 1.25B | 1.31B | 1.35B | 1.38B |
| Gross Profit | 3.85B | 4.27B | 4.75B | 5.28B | 5.61B |
| EBITDA | 3.93B | 4.02B | 4.67B | 5.04B | 5.72B |
| EBIT | 3.54B | 3.65B | 4.31B | 4.70B | 5.45B |
| Interest Expense | 167M | 163M | 159M | 161M | 130M |
| Net Income | 2.64B | 2.69B | 3.23B | 3.53B | 4.04B |
| EPS | 7.30 | 7.41 | 8.87 | 9.69 | 11.18 |
| Filing Date | 2022-02-25 | 2023-02-27 | 2024-02-28 | 2025-02-27 | 2026-02-26 |
Income Statement Evolution
CME Group’s revenue rose 39% from 2021 to 2025, with a 6.4% increase in the latest year. Net income grew 53% overall, supported by a 10% margin expansion. Gross and EBIT margins remained high and stable, exceeding 80%, reflecting efficient cost controls amid rising revenues. Margins improved slightly, signaling operational strength.
Is the Income Statement Favorable?
The 2025 income statement shows robust fundamentals with a 6.4% revenue rise and 7.8% net margin growth. EBIT margin stands at an exceptional 83.5%, while net margin exceeds 62%. Interest expense is low relative to revenue. These metrics confirm a highly favorable income profile, marked by strong profitability and disciplined expense management.
Financial Ratios
The following table summarizes key financial ratios for CME Group Inc. over the last five fiscal years, highlighting profitability, valuation, liquidity, leverage, efficiency, and dividend metrics:
| Ratios | 2021 | 2022 | 2023 | 2024 | 2025 |
|---|---|---|---|---|---|
| Net Margin | 56.2% | 53.6% | 57.8% | 57.5% | 62.0% |
| ROE | 9.6% | 10.0% | 12.1% | 13.3% | 14.1% |
| ROIC | 5.6% | 6.4% | 7.4% | 8.5% | -2.0% |
| P/E | 31.1 | 22.4 | 23.4 | 23.7 | 24.3 |
| P/B | 3.0 | 2.2 | 2.8 | 3.2 | 3.4 |
| Current Ratio | 1.01 | 1.01 | 1.02 | 1.01 | 0.00 |
| Quick Ratio | 1.01 | 1.01 | 1.02 | 1.01 | 0.00 |
| D/E | 0.13 | 0.13 | 0.13 | 0.13 | 0.12 |
| Debt-to-Assets | 1.8% | 2.0% | 2.6% | 2.5% | 1.7% |
| Interest Coverage | 15.8 | 18.5 | 21.6 | 24.4 | 32.6 |
| Asset Turnover | 0.02 | 0.03 | 0.04 | 0.04 | 0.03 |
| Fixed Asset Turnover | 9.3 | 11.0 | 13.6 | 15.9 | 18.0 |
| Dividend Yield | 2.7% | 4.4% | 4.3% | 4.3% | 1.8% |
Evolution of Financial Ratios
From 2021 to 2025, CME Group’s Return on Equity (ROE) improved modestly from 9.6% to 14.1%, reflecting steady profitability growth. The Current Ratio remained around 1.0 until it dropped to zero in 2025, indicating a significant shift in liquidity reporting. The Debt-to-Equity Ratio stayed low and stable near 0.12, showing consistent conservative leverage.
Are the Financial Ratios Favorable?
In 2025, profitability appears strong with a net margin above 62%, but return on invested capital is negative, signaling inefficiencies in capital use. Liquidity ratios are unfavorable, with a Current Ratio and Quick Ratio at zero, raising red flags. Leverage is favorable, confirmed by a low debt-to-equity ratio of 0.12 and high interest coverage of 42x. Asset turnover is weak at 0.03, while fixed asset turnover remains robust at 18. Overall, the ratio profile is slightly favorable but requires caution on liquidity and capital efficiency.
Shareholder Return Policy
CME Group maintains a dividend payout ratio around 44%, with a steady dividend per share near 5 USD and a yield close to 1.8%. The company also supports shareholder returns through share buybacks, funded comfortably by free cash flow coverage exceeding 100%.
This disciplined distribution approach aligns with sustainable long-term value creation. Payouts remain well-covered by cash flow, mitigating risks of over-distribution or excessive repurchases, consistent with prudent capital allocation in the financial sector.
Score analysis
The radar chart below visualizes CME Group Inc.’s key financial metric scores for a comprehensive overview:
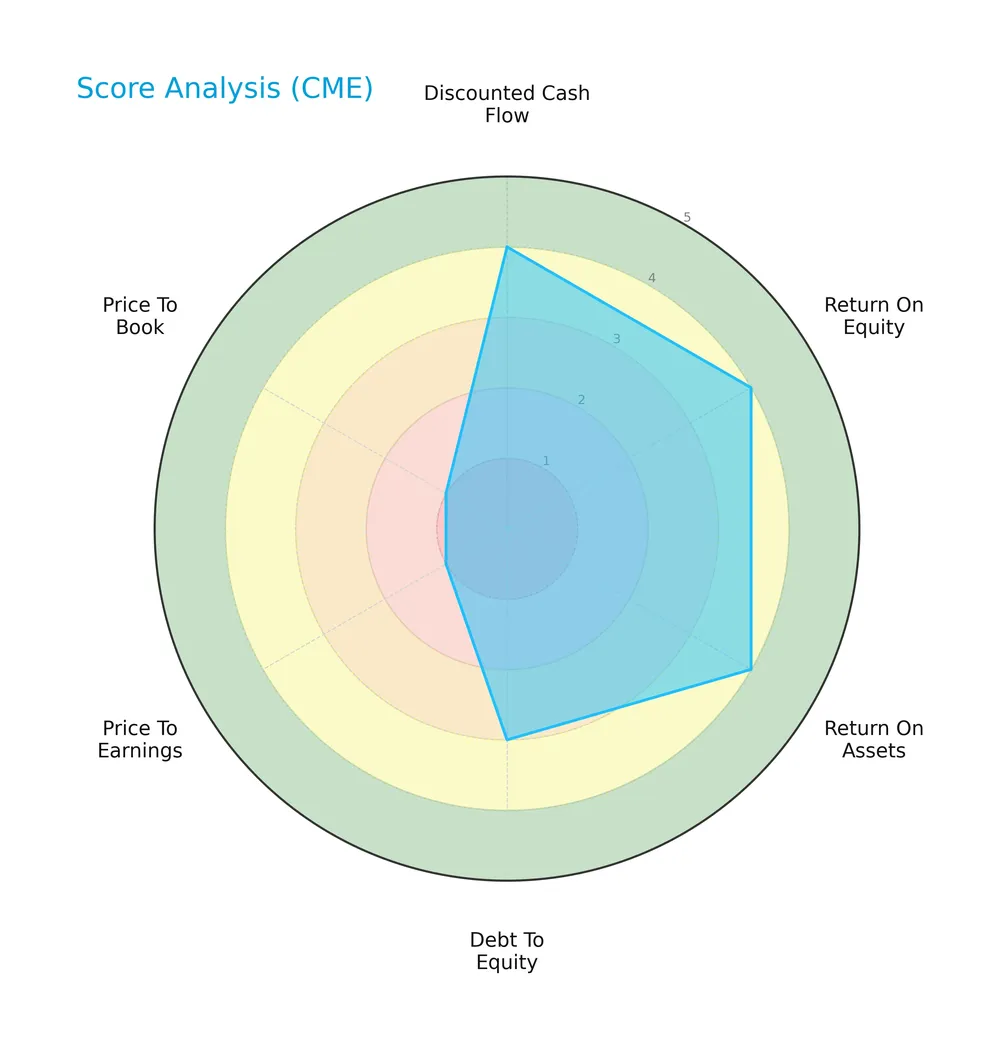
CME scores favorably on discounted cash flow, ROE, ROA, and debt-to-equity, reflecting solid profitability and capital structure. However, valuation metrics PE and PB are very unfavorable, signaling potential market pricing concerns.
Analysis of the company’s bankruptcy risk
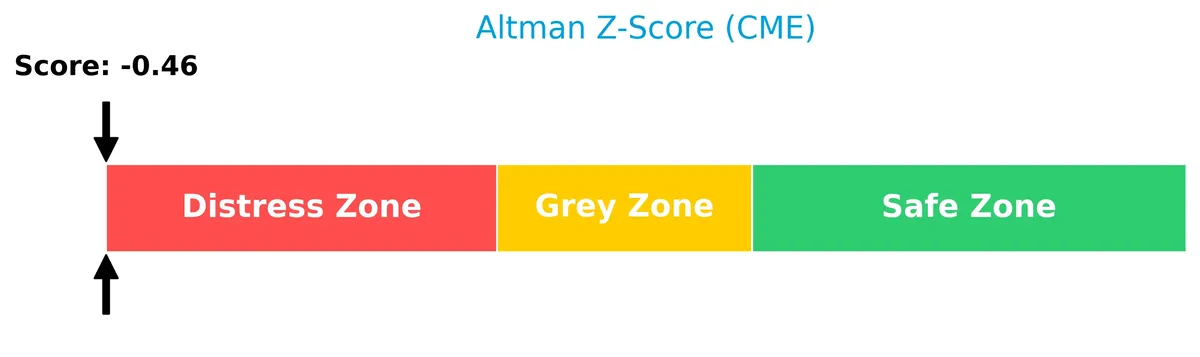
The Altman Z-Score places CME in the distress zone, indicating a high bankruptcy risk and financial instability:
Is the company in good financial health?
The Piotroski diagram illustrates CME’s financial health based on nine key performance criteria:

With a Piotroski score of 4, CME shows average financial strength, suggesting moderate operational efficiency and profitability but room for improvement in financial robustness.
Competitive Landscape & Sector Positioning
This section examines CME Group Inc.’s strategic positioning within the financial data and stock exchange sector. We will analyze its revenue breakdown, key products, and main competitors. I will assess whether CME Group holds a competitive advantage over its peers.
Strategic Positioning
CME Group diversifies across futures and options on interest rates, equity indexes, FX, commodities, and fixed income. Its revenue mix shows growing clearing and transaction fees, complemented by market data and other services. The company operates globally, serving diverse financial clients, reflecting broad product and geographic exposure.
Revenue by Segment
This pie chart illustrates CME Group Inc.’s revenue breakdown by segment for fiscal year 2025, highlighting the contribution of core business lines.
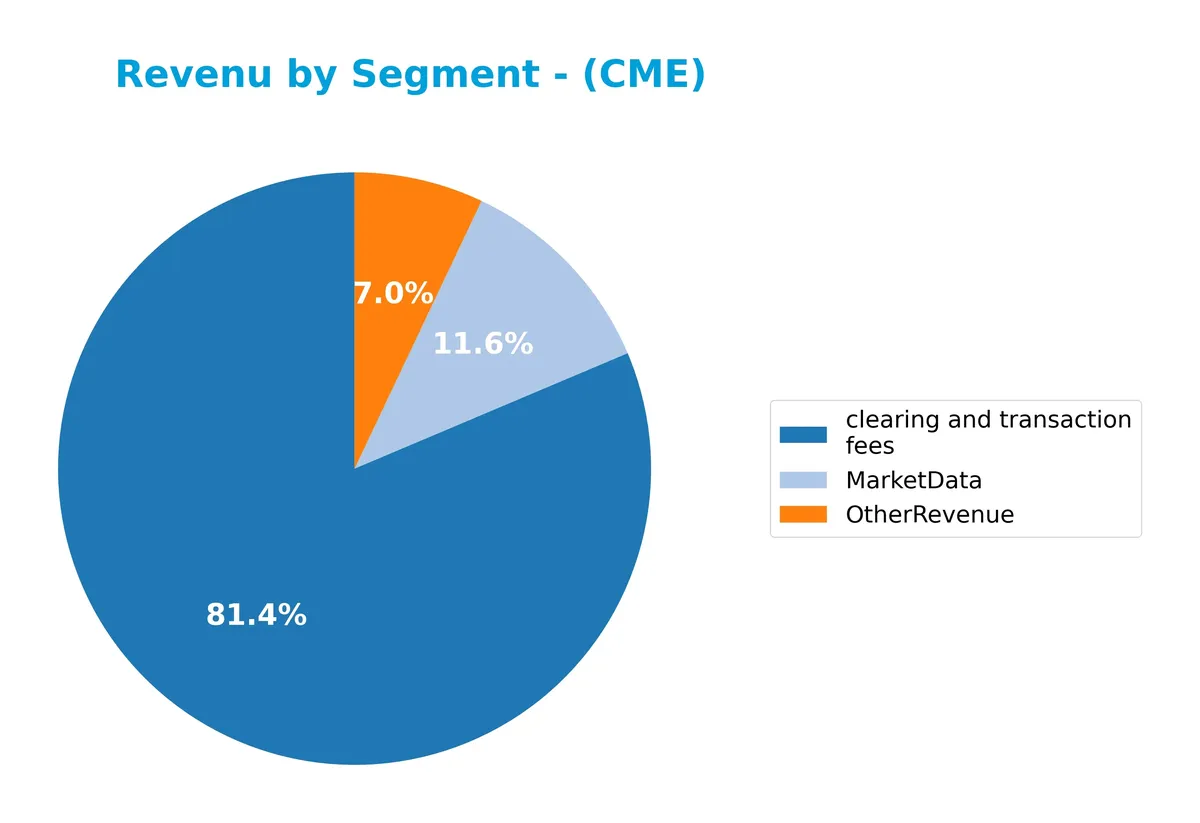
CME’s revenue centers on clearing and transaction fees, which reached $5.28B in 2025, showing steady growth from $3.67B in 2018. Market data revenue also expanded to $803M, reflecting rising demand for real-time information. Other revenue remains smaller but stable at $436M. The 2025 data reveals accelerating growth in core fees, underscoring the firm’s reliance on transaction-based income amid a dynamic market environment.
Key Products & Brands
The following table outlines CME Group Inc.’s primary products and services by category and description:
| Product | Description |
|---|---|
| Clearing and Transaction Fees | Fees from clearing, settling, and guaranteeing futures, options, and cleared swaps contracts. |
| Market Data Services | Real-time and historical market data offerings for various financial instruments. |
| Other Revenue | Includes trade processing, risk mitigation services, and additional miscellaneous revenues. |
CME Group’s revenue mainly derives from clearing and transaction fees, reflecting its core role in market infrastructure. Market data and ancillary services complement its diversified financial ecosystem.
Main Competitors
There are 9 main competitors in the Financial – Data & Stock Exchanges industry; the table lists the top 9 leaders by market capitalization:
| Competitor | Market Cap. |
|---|---|
| S&P Global Inc. | 155B |
| CME Group Inc. | 97.2B |
| Intercontinental Exchange, Inc. | 91.7B |
| Moody’s Corporation | 89.7B |
| Coinbase Global, Inc. | 60.5B |
| Nasdaq, Inc. | 55.5B |
| MSCI Inc. | 43.7B |
| Cboe Global Markets, Inc. | 26.0B |
| FactSet Research Systems Inc. | 10.8B |
CME Group Inc. ranks 2nd among its competitors with a market cap at 73% of the leader, S&P Global Inc. The company stands above both the average top 10 market cap of 70B and the sector median of 60.5B. It maintains a healthy 36.45% gap to the next competitor above, highlighting a strong position in this sector.
Comparisons with competitors
Check out how we compare the company to its competitors:
Does CME have a competitive advantage?
CME Group Inc. does not present a competitive advantage based on its return on invested capital (ROIC) compared to its weighted average cost of capital (WACC). The company is shedding value, with a very unfavorable moat status and a declining ROIC trend, indicating decreasing profitability.
Looking ahead, CME continues to offer diverse futures and options products across multiple asset classes worldwide. Its broad market data services and clearinghouse operations provide opportunities to expand market reach and enhance risk mitigation solutions in evolving financial markets.
SWOT Analysis
This analysis highlights CME Group Inc.’s key internal and external factors affecting its strategic position.
Strengths
- dominant global futures exchange
- strong net margin of 62%
- low debt-to-equity at 0.12
Weaknesses
- declining ROIC signals value destruction
- unfavorable current and quick ratios
- price-to-book ratio weak at 3.42
Opportunities
- expansion in derivatives market
- growth in market data services
- increased institutional trading demand
Threats
- regulatory risks in financial markets
- competition from alternative trading platforms
- macroeconomic volatility affecting volumes
CME Group commands a strong market position with robust profitability but faces value erosion and liquidity concerns. Strategic focus should target operational efficiency improvements and capitalizing on expanding derivatives markets while managing regulatory and competitive pressures.
Stock Price Action Analysis
The following weekly stock chart displays CME Group Inc.’s price evolution over the last 12 months, highlighting key movements and volatility:
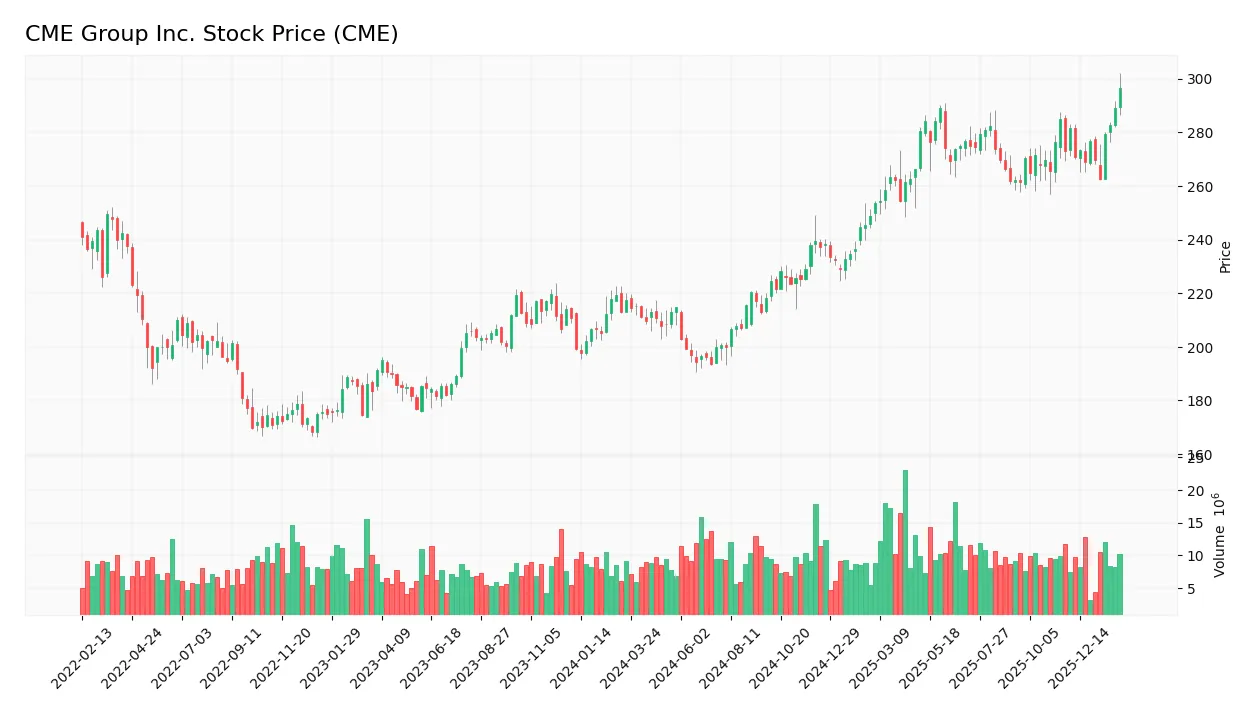
Trend Analysis
Over the past year, CME’s stock price rose 49.92%, indicating a clear bullish trend with accelerating momentum. The price ranged between 193.43 and 316.45, showing notable strength despite a high 31.15 standard deviation, reflecting significant volatility.
Volume Analysis
In the last three months, trading volumes increased with a strongly buyer-dominant profile at 75.69%. This growing buyer activity signals heightened investor confidence and robust market participation in CME’s shares.
Target Prices
Analysts show a confident consensus on CME Group Inc.’s valuation range.
| Target Low | Target High | Consensus |
|---|---|---|
| 300 | 340 | 311.83 |
The target prices suggest moderate upside potential, reflecting steady growth expectations and solid market positioning.

Don’t Let Luck Decide Your Entry Point
Optimize your entry points with our advanced ProRealTime indicators. You’ll get efficient buy signals with precise price targets for maximum performance. Start outperforming now!
Analyst & Consumer Opinions
This section reviews analyst ratings and consumer feedback to gauge market sentiment on CME Group Inc.
Stock Grades
Here are the latest verified stock grades for CME Group Inc. from leading financial institutions:
| Grading Company | Action | New Grade | Date |
|---|---|---|---|
| Morgan Stanley | Maintain | Overweight | 2026-02-05 |
| JP Morgan | Maintain | Underweight | 2026-02-05 |
| TD Cowen | Maintain | Buy | 2026-02-05 |
| RBC Capital | Maintain | Sector Perform | 2026-02-05 |
| Barclays | Maintain | Equal Weight | 2026-02-05 |
| Morgan Stanley | Maintain | Overweight | 2026-01-15 |
| TD Cowen | Upgrade | Buy | 2026-01-14 |
| Morgan Stanley | Maintain | Overweight | 2025-12-22 |
| Barclays | Maintain | Equal Weight | 2025-12-12 |
| Piper Sandler | Maintain | Overweight | 2025-11-13 |
The consensus shows a mixed but generally cautious stance, with many firms maintaining overweight or buy ratings. However, the presence of underweight and equal weight grades indicates no clear overwhelming bullish or bearish trend.
Consumer Opinions
Consumers express varied sentiments toward CME Group Inc., reflecting its complex role in financial markets.
| Positive Reviews | Negative Reviews |
|---|---|
| Robust platform with reliable market data | Interface can be unintuitive for beginners |
| Strong customer support and timely updates | High fees compared to competitors |
| Wide range of products catering to diverse traders | Occasional technical glitches reported |
Overall, users praise CME Group’s comprehensive offerings and dependable service. However, they frequently cite a steep learning curve and cost concerns as notable drawbacks.
Risk Analysis
Below is a summary table highlighting key risk factors affecting CME Group Inc.’s financial and operational outlook:
| Category | Description | Probability | Impact |
|---|---|---|---|
| Liquidity Risk | Current and quick ratios are zero, indicating potential cash flow issues. | High | High |
| Profitability Risk | Negative ROIC (-2.01%) despite strong net margin (62%). Indicates capital inefficiency. | Medium | Medium |
| Valuation Risk | High P/B (3.42) and weak price multiples signal possible overvaluation. | Medium | Medium |
| Bankruptcy Risk | Altman Z-Score in distress zone (-0.44) suggests financial distress risk. | Low-Medium | High |
| Market Risk | Low beta (0.28) limits volatility but also growth leverage in bull markets. | Low | Low |
| Debt Risk | Low debt-to-equity (0.12) and strong interest coverage (42x) reduce default risk. | Low | Low |
The most pressing risks are liquidity and bankruptcy concerns, underscored by the zero current ratio and a distress-zone Altman Z-Score. These red flags contrast with CME’s robust net margin and conservative leverage, signaling operational strength but financial rigidity. Investors should monitor cash flow closely and question capital allocation efficiency amid modest ROIC.
Should You Buy CME Group Inc.?
CME Group Inc. appears to be a company with improving operational efficiency but a deteriorating competitive moat, as indicated by declining ROIC and value destruction signals. Despite a manageable leverage profile and a B+ rating, it faces distress-zone bankruptcy risk and average financial strength.
Strength & Efficiency Pillars
CME Group Inc. posts robust operational margins, with a gross margin of 86.09% and an EBIT margin of 83.51%, signaling strong core profitability. Its net margin stands at a striking 62.02%, reflecting excellent cost control and pricing power. Return on equity at 14.08% is moderate but steady. However, the company records a negative ROIC of -2.01%, below its WACC of 4.83%. This signals that CME Group is currently shedding value rather than creating it, raising concerns about capital efficiency.
Weaknesses and Drawbacks
The company sits deeply in the financial distress zone, with an Altman Z-Score of -0.44, indicating a high risk of bankruptcy that overshadows other metrics. Valuation metrics are also unfavorable: a P/B ratio of 3.42 suggests the stock trades at a premium relative to book value, while the P/E at 24.28 is only neutral but still elevated. Liquidity ratios are worrisome; both current and quick ratios are reported as zero, flagging potential short-term cash flow constraints. Despite low debt-to-equity of 0.12, the solvency risk is paramount.
Our Final Verdict about CME Group Inc.
Despite strong operational profitability, CME Group’s negative Altman Z-Score of -0.44 places it in the distress zone, signaling significant solvency risk. Therefore, regardless of its bullish price trend and strong buyer dominance, the profile is highly speculative and too risky for conservative capital. Investors might consider waiting for clear signs of financial stabilization before committing capital.
Disclaimer: This content is for informational purposes only and does not constitute financial, investment, or other professional advice. Investing in financial markets involves a significant risk of loss, and past performance is not indicative of future results.
Additional Resources
- E-mini S&P 500 Futures Overview – CME Group (Feb 24, 2026)
- Andra AP fonden Grows Stake in CME Group Inc. $CME – MarketBeat (Feb 27, 2026)
- Decoding CME Group Inc (CME): A Strategic SWOT Insight – GuruFocus (Feb 27, 2026)
- CME GROUP INC. SEC 10-K Report – TradingView (Feb 26, 2026)
- CME Group reopens Globex metals, natural gas trading after brief technical halt – Reuters (Feb 25, 2026)
For more information about CME Group Inc., please visit the official website: cmegroup.com