Home > Analyses > Technology > Cloudflare, Inc.
Cloudflare, Inc. powers the digital backbone that keeps millions of websites secure, fast, and reliable every day. Its cutting-edge cloud infrastructure and security solutions protect enterprises from cyber threats while optimizing online performance worldwide. Known for relentless innovation and a broad product suite, Cloudflare leads a critical segment of the software infrastructure industry. As market dynamics evolve, I ask: do its fundamentals sustain its premium valuation and future growth prospects?

Table of contents
Business Model & Company Overview
Cloudflare, Inc., founded in 2009 and based in San Francisco, commands a leading position in cloud infrastructure software. The company’s core mission integrates security, performance, and reliability into a unified cloud platform. Its comprehensive ecosystem protects and optimizes public clouds, private clouds, SaaS, IoT devices, and on-premises networks, serving diverse sectors like technology, healthcare, and finance.
Cloudflare’s revenue engine balances scalable security services—firewalls, DDoS protection, bot management—with performance solutions like content delivery and intelligent routing. It operates globally across the Americas, Europe, and Asia, leveraging its expansive network to deliver low-latency connections. The strength of its economic moat lies in this integrated platform and its critical role in shaping secure, efficient internet infrastructure worldwide.
Financial Performance & Fundamental Metrics
I analyze Cloudflare, Inc.’s income statement, key financial ratios, and dividend payout policy to assess its core profitability and capital allocation efficiency.
Income Statement
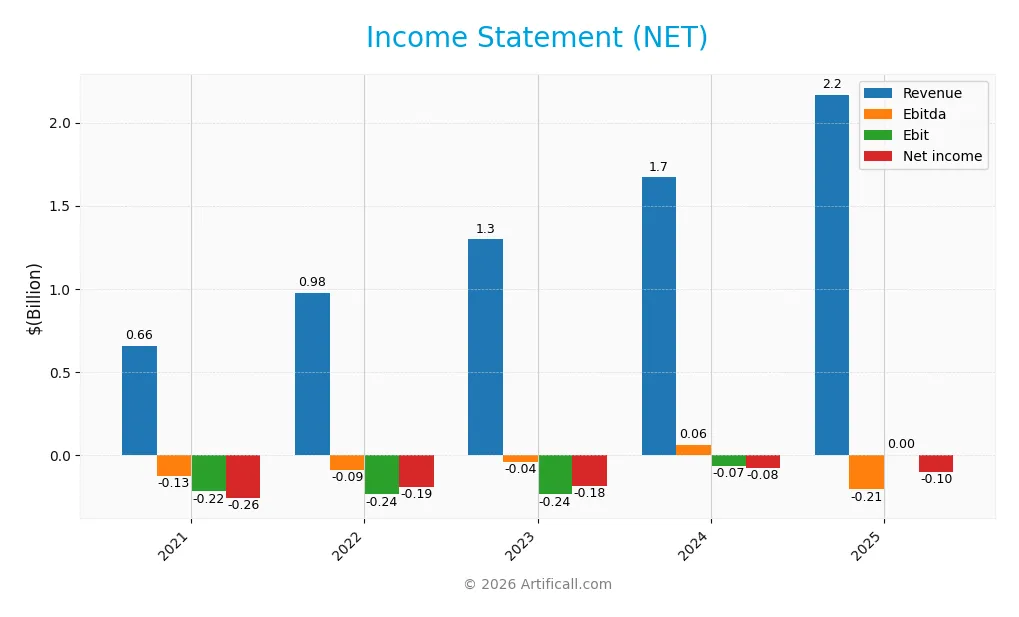
The table below summarizes Cloudflare, Inc.’s key income statement figures for fiscal years 2021 through 2025, reflecting revenue growth and persistent net losses.
| 2021 | 2022 | 2023 | 2024 | 2025 | |
|---|---|---|---|---|---|
| Revenue | 656M | 975M | 1.3B | 1.7B | 2.2B |
| Cost of Revenue | 147M | 233M | 307M | 379M | 554M |
| Operating Expenses | 657M | 991M | 1.2B | 1.4B | 1.8B |
| Gross Profit | 509M | 743M | 990M | 1.3B | 1.6B |
| EBITDA | -125M | -92M | -43M | 62M | 88M |
| EBIT | -220M | -237M | -237M | -66M | -203M |
| Interest Expense | 49M | 5M | 6M | 5M | 9M |
| Net Income | -260M | -193M | -184M | -79M | -102M |
| EPS | -0.83 | -0.59 | -0.55 | -0.23 | -0.29 |
| Filing Date | 2022-03-01 | 2023-02-24 | 2024-02-21 | 2025-02-20 | 2026-02-26 |
Income Statement Evolution
Cloudflare’s revenue surged 230% from 2021 to 2025, with a strong 30% increase in the latest year. Gross margins remained robust near 74%, reflecting consistent cost control. However, EBIT margins deteriorated, turning more negative despite revenue gains, signaling rising operating expenses outpacing income growth. Net income losses narrowed overall, improving margin trends modestly.
Is the Income Statement Favorable?
In 2025, Cloudflare posted $2.17B revenue with a gross profit of $1.61B, maintaining a favorable 74% margin. Despite a negative EBIT of -$203M, net interest income of $122M softened losses, yielding a smaller net loss of $102M and a -4.7% net margin. The fundamentals show solid top-line growth and margin strength offset by persistent operating losses, generating a generally favorable but cautious outlook.
Financial Ratios
The following table summarizes key financial ratios for Cloudflare, Inc. over the past five fiscal years:
| Ratios | 2021 | 2022 | 2023 | 2024 | 2025 |
|---|---|---|---|---|---|
| Net Margin | -39.7% | -19.8% | -14.2% | -4.7% | -4.7% |
| ROE | -31.9% | -31.0% | -24.1% | -7.5% | -7.0% |
| ROIC | -6.8% | -8.9% | -8.5% | -6.1% | -4.0% |
| P/E | -158 | -76 | -151 | -467 | -672 |
| P/B | 50.3 | 23.6 | 36.4 | 35.1 | 47.1 |
| Current Ratio | 6.8 | 4.7 | 3.5 | 2.9 | 2.0 |
| Quick Ratio | 6.8 | 4.7 | 3.5 | 2.9 | 2.0 |
| D/E | 1.59 | 2.53 | 1.88 | 1.40 | 2.54 |
| Debt-to-Assets | 54.5% | 61.0% | 52.0% | 44.3% | 61.3% |
| Interest Coverage | -3.0 | -49.9 | -42.7 | -29.8 | -23.2 |
| Asset Turnover | 0.28 | 0.38 | 0.47 | 0.51 | 0.36 |
| Fixed Asset Turnover | 2.1 | 2.3 | 2.8 | 2.6 | 2.5 |
| Dividend Yield | 0 | 0 | 0 | 0 | 0 |
Evolution of Financial Ratios
From 2021 to 2025, Cloudflare’s Return on Equity (ROE) remained negative, showing some fluctuation but no clear improvement. The Current Ratio steadily declined from 6.77 in 2021 to 1.98 in 2025, indicating reduced liquidity. The Debt-to-Equity Ratio increased overall, reaching 2.54 in 2025, reflecting higher leverage. Profitability margins stayed negative but showed a slight narrowing trend.
Are the Financial Ratios Fovorable?
In 2025, Cloudflare’s profitability ratios, including ROE at -7.01% and net margin at -4.72%, remain unfavorable compared to sector averages. Liquidity ratios like the Current and Quick Ratios near 2.0 are favorable, suggesting adequate short-term coverage. However, leverage is high with a Debt-to-Equity Ratio of 2.54 and interest coverage deeply negative at -23.19. Asset turnover is low, while valuation metrics such as Price-to-Book at 47.08 are unfavorable. Overall, the financial ratios indicate more risks than strengths.
Shareholder Return Policy
Cloudflare, Inc. does not pay dividends, reflecting its ongoing net losses and reinvestment focus. The company prioritizes growth and R&D over distributions, consistent with its negative net income per share since 2021.
The firm does not engage in share buybacks either, indicating a strategy centered on capital allocation toward expansion rather than returning cash. This approach aligns with long-term value creation but requires monitoring as profitability evolves.
Score analysis
The following radar chart illustrates Cloudflare, Inc.’s key financial scores across valuation, profitability, and leverage metrics:
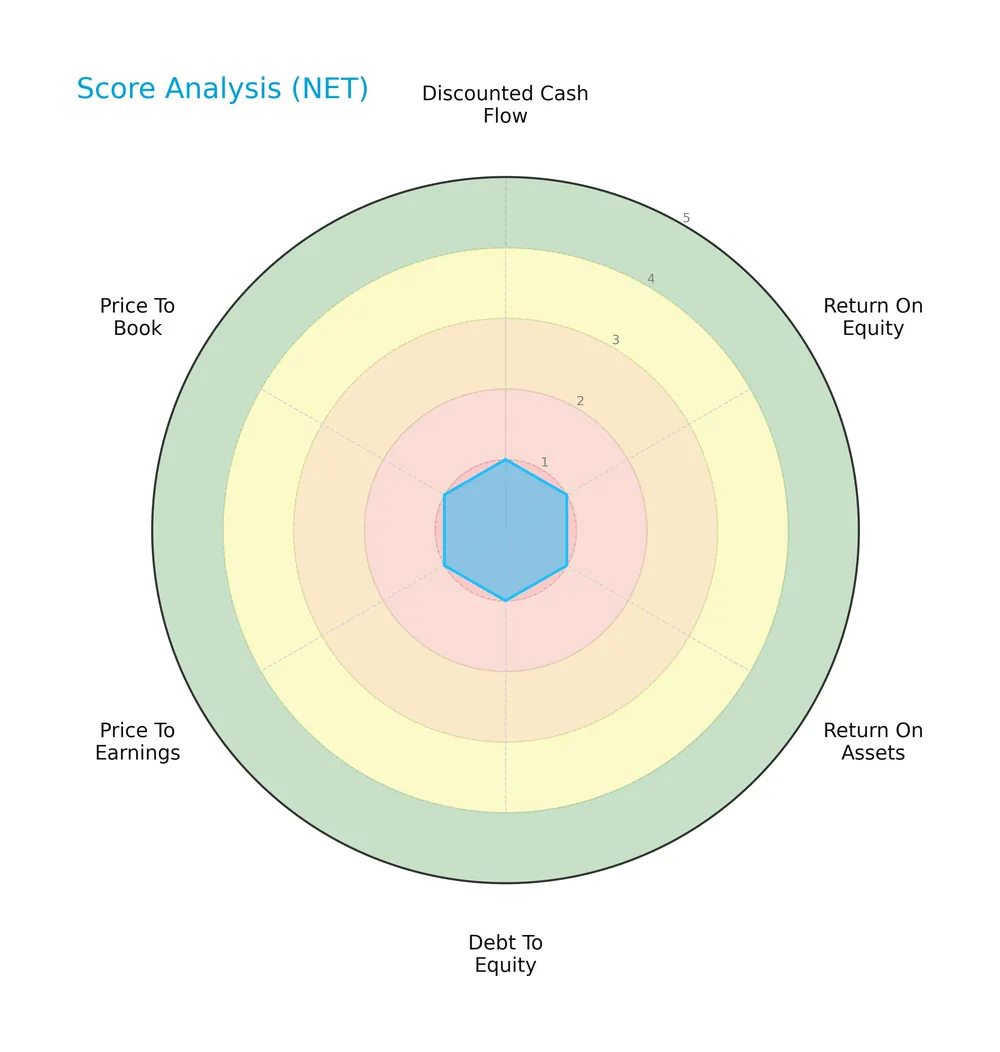
Cloudflare’s scores reflect significant challenges. The discounted cash flow is unfavorable at 2, while all other metrics, including return on equity, assets, debt to equity, PE, and PB ratios, score very unfavorably at 1. This signals weak profitability and valuation metrics.
Analysis of the company’s bankruptcy risk
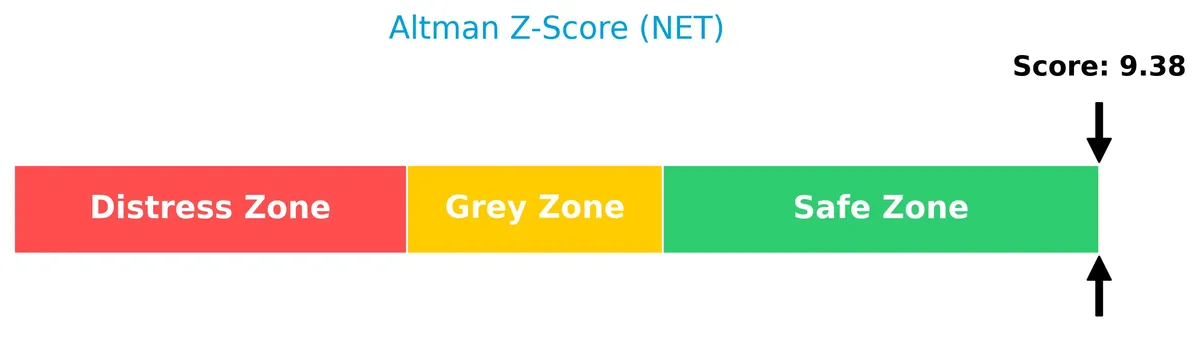
Cloudflare’s Altman Z-Score places it firmly in the safe zone, indicating a low risk of bankruptcy at present:
Is the company in good financial health?
The Piotroski Score chart highlights Cloudflare’s financial health based on nine criteria:

With a Piotroski Score of 2, Cloudflare ranks as very weak financially. This suggests the company struggles with profitability, liquidity, and operational efficiency, raising concerns about its underlying financial strength.
Competitive Landscape & Sector Positioning
This analysis reviews Cloudflare, Inc.’s sector positioning, strategic focus, and revenue streams. I will evaluate whether Cloudflare holds a sustainable competitive advantage over its peers.
Strategic Positioning
Cloudflare, Inc. operates a diversified product portfolio spanning cloud security, performance, and reliability solutions. Its geographic exposure is broad, with significant revenue from the US (1.07B), EMEA (599M), Asia Pacific (330M), and other regions in 2025, reflecting balanced global reach in software infrastructure.
Revenue by Segment
This pie chart illustrates Cloudflare, Inc.’s revenue distribution for the reportable segment during fiscal years 2024 and 2025, highlighting segment contribution over these two years.
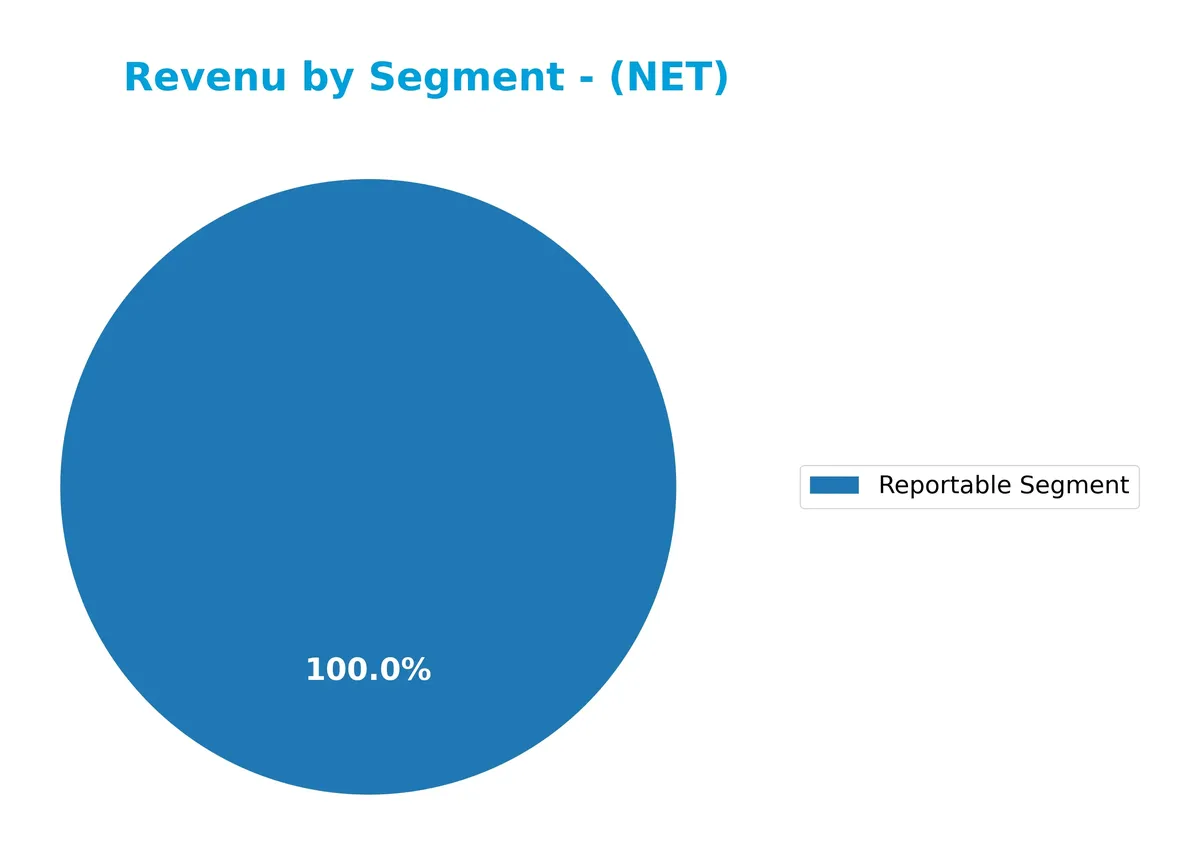
Cloudflare’s revenue from the reportable segment grew from $1.67B in 2024 to $2.17B in 2025, signaling strong acceleration. This segment singularly drives the company’s top-line growth with no diversification visible. The concentration risk remains elevated due to dependence on one main segment, but the rapid growth indicates effective capital allocation and market positioning within its niche.
Key Products & Brands
Cloudflare offers a diverse portfolio of cloud-based security, performance, and developer solutions:
| Product | Description |
|---|---|
| Cloud Firewall | Protects platforms from unauthorized access and cyber threats across public, private, and on-premise clouds. |
| Bot Management | Identifies and mitigates malicious automated traffic to ensure service integrity. |
| Distributed Denial of Service (DDoS) Protection | Shields networks and applications from large-scale attack traffic. |
| IoT Security | Secures Internet of Things devices through tailored protection and monitoring. |
| SSL/TLS Encryption | Provides secure connections to protect data in transit. |
| Secure Origin Connection | Ensures trusted communication between Cloudflare and origin servers. |
| Rate Limiting | Controls traffic volume to prevent abuse and service degradation. |
| Content Delivery & Intelligent Routing | Enhances website and application speed globally through optimized data flow. |
| Content, Mobile, & Image Optimization | Improves user experience by optimizing loading and display of content on multiple devices. |
| Load Balancing & Anycast Network | Maintains application availability and resilience through traffic distribution techniques. |
| DNS & DNS Resolver | Provides domain name resolution and consumer DNS services for reliable internet navigation. |
| Virtual Backbone & Online Waiting Room | Manages internet traffic and access during high demand or events to prevent downtime. |
| Developer Solutions | Includes serverless computing, programmable networks, website development tools, and analytics. |
| Domain Registration | Offers domain name services integrated with Cloudflare’s platform. |
| Consumer VPN & DNS Resolver Apps | Provides mobile security and accelerated internet access for individual users. |
Cloudflare’s product suite spans security, performance, and developer tools, serving diverse industries with integrated cloud infrastructure solutions. Its 2025 revenue reached $2.17B, reflecting strong demand for cloud security and optimization services.
Main Competitors
The Technology sector includes 32 competitors, with the table below listing the top 10 leaders by market capitalization:
| Competitor | Market Cap. |
|---|---|
| Microsoft Corporation | 3.52T |
| Oracle Corporation | 553B |
| Palantir Technologies Inc. | 383B |
| Adobe Inc. | 140B |
| Palo Alto Networks, Inc. | 120B |
| CrowdStrike Holdings, Inc. | 113B |
| Synopsys, Inc. | 92B |
| Cloudflare, Inc. | 69B |
| Fortinet, Inc. | 59B |
| Block, Inc. | 40B |
Cloudflare ranks 8th among 32 competitors. Its market cap is just 1.75% of the sector leader, Microsoft. The company sits below the average market cap of the top 10 (508B) but above the sector median of 19B. It holds a 49.54% market cap gap from its next closest competitor above, Synopsys.
Comparisons with competitors
Check out how we compare the company to its competitors:
Does Cloudflare have a competitive advantage?
Cloudflare currently lacks a strong competitive advantage, as its ROIC falls below WACC, indicating value destruction despite growing profitability. The company faces challenges in generating returns above its capital costs.
Looking ahead, Cloudflare’s integrated cloud security and performance solutions position it well to capitalize on expanding markets, including IoT and global enterprise demand. Continued innovation in developer tools and consumer VPN may offer fresh growth opportunities.
SWOT Analysis
This analysis identifies Cloudflare, Inc.’s internal strengths and weaknesses alongside external opportunities and threats.
Strengths
- Strong revenue growth of 230% (2021-2025)
- Leading integrated cloud security platform
- Wide global footprint with expanding US and EMEA sales
Weaknesses
- Negative net and EBIT margins indicating unprofitability
- High debt-to-equity ratio at 2.54 raises financial risk
- ROIC below WACC signals value destruction
Opportunities
- Rising demand for cloud security and performance solutions
- Expansion potential in Asia Pacific and emerging markets
- Growing IoT and SaaS adoption drives new service needs
Threats
- Intense competition in cloud infrastructure sector
- Regulatory and cybersecurity risks
- Macroeconomic volatility impacting IT budgets
Cloudflare benefits from robust growth and global reach but must address profitability and leverage concerns. Strategic focus on innovation and market expansion is critical to mitigate competitive and financial risks.
Stock Price Action Analysis
The weekly stock chart of Cloudflare, Inc. (NET) reveals the price movements and volatility over the last 100 weeks:
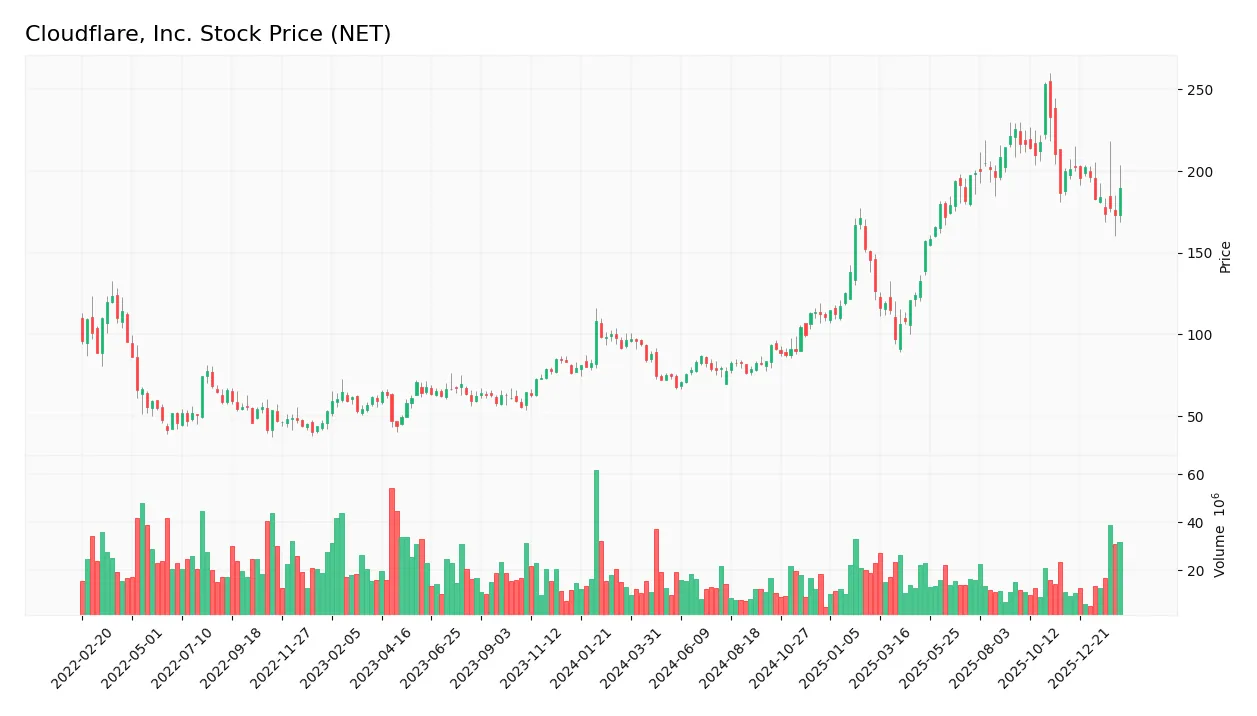
Trend Analysis
Over the past 12 months, NET price increased 81.63%, indicating a bullish trend. The stock shows deceleration despite high volatility (52.77 std dev). The highest price reached 253.3, with a low of 67.69. Recently, from Dec 2025 to Mar 2026, the trend reversed with a -13.72% decline, slope -2.31, signaling short-term weakness.
Volume Analysis
Trading volume is increasing with 1.89B total shares traded. Buyer volume leads at 54.48%, indicating a buyer-driven market overall. However, in the recent three months, buyer dominance fell to 48.98%, showing neutral buyer behavior and balanced market participation.
Target Prices
Analysts set a strong target consensus for Cloudflare, Inc., reflecting bullish expectations.
| Target Low | Target High | Consensus |
|---|---|---|
| 140 | 300 | 230.2 |
The target prices show broad confidence in Cloudflare’s growth, with a consensus well above current levels.

Don’t Let Luck Decide Your Entry Point
Optimize your entry points with our advanced ProRealTime indicators. You’ll get efficient buy signals with precise price targets for maximum performance. Start outperforming now!
Analyst & Consumer Opinions
This section examines Cloudflare, Inc. (NET) through analyst ratings and consumer feedback to gauge market sentiment.
Stock Grades
Here are the latest verified stock grades for Cloudflare, Inc. from leading financial institutions:
| Grading Company | Action | New Grade | Date |
|---|---|---|---|
| Citigroup | Maintain | Buy | 2026-02-12 |
| Piper Sandler | Maintain | Neutral | 2026-02-11 |
| Wells Fargo | Maintain | Overweight | 2026-02-11 |
| Scotiabank | Maintain | Sector Perform | 2026-02-11 |
| Barclays | Maintain | Overweight | 2026-02-11 |
| Needham | Maintain | Buy | 2026-02-11 |
| Jefferies | Maintain | Hold | 2026-02-11 |
| BTIG | Maintain | Buy | 2026-02-11 |
| Cantor Fitzgerald | Maintain | Neutral | 2026-02-11 |
| RBC Capital | Maintain | Outperform | 2026-02-11 |
The consensus reflects a stable outlook with most firms maintaining positive ratings such as Buy, Overweight, and Outperform. Neutral and Hold grades suggest cautious optimism among some analysts.
Consumer Opinions
Cloudflare, Inc. consistently earns praise for its robust performance and security, yet some users express concerns over pricing and support responsiveness.
| Positive Reviews | Negative Reviews |
|---|---|
| Reliable uptime and fast content delivery | Pricing can be steep for small businesses |
| Strong security features that protect against attacks | Customer support sometimes slow to respond |
| Easy-to-use interface with helpful analytics | Complexity in advanced feature setup for newcomers |
| Excellent global network coverage | Occasional billing issues reported by users |
Overall, consumers value Cloudflare’s security and network speed as major strengths. However, pricing and customer support remain areas needing improvement, especially for smaller clients.
Risk Analysis
Below is a table summarizing key risk categories for Cloudflare, Inc. and their assessed probability and impact:
| Category | Description | Probability | Impact |
|---|---|---|---|
| Financial | Persistent negative profitability, weak ROE and ROIC, high debt | High | High |
| Market Volatility | Stock beta near 2 indicates high price sensitivity to market swings | High | Medium |
| Operational | Reliance on cloud infrastructure; any disruption affects services | Medium | High |
| Valuation | Extremely high price-to-book ratio signals overvaluation risk | Medium | Medium |
| Liquidity | Current and quick ratios are adequate but interest coverage is poor | Medium | Medium |
| Credit | Debt-to-equity ratio above 2.5 suggests leverage risk | Medium | High |
| Bankruptcy Risk | Altman Z-Score in safe zone reduces immediate bankruptcy concern | Low | Low |
The most pressing risks are Cloudflare’s high leverage and ongoing unprofitability, which pressure cash flow and capital allocation. Despite a safe Altman Z-Score, the very weak Piotroski score signals financial fragility. The company’s beta near 2 amplifies exposure to market volatility. Investors should weigh these risks against Cloudflare’s growth potential carefully.
Should You Buy Cloudflare, Inc.?
Cloudflare appears to be shedding value despite a growing profitability trend, suggesting a slightly unfavorable moat. Its leverage profile seems substantial, while the overall rating could be seen as very unfavorable, warranting cautious interpretation of operational efficiency.
Strength & Efficiency Pillars
Cloudflare, Inc. benefits from a robust gross margin of 74.43%, signaling efficient core operations. However, profitability metrics such as net margin (-4.72%), ROE (-7.01%), and ROIC (-4.03%) remain negative. The company’s ROIC falls short of its WACC at 12.36%, indicating it currently destroys shareholder value. Despite this, Cloudflare shows strong revenue growth of 29.85% in the past year and 230.26% over the long term, highlighting operational scalability and market demand.
Weaknesses and Drawbacks
Cloudflare’s financial profile is burdened by significant weaknesses. The debt-to-equity ratio stands at 2.54, reflecting high leverage and greater risk in volatile markets. The interest coverage ratio is negative (-23.19), raising red flags about the company’s ability to service debt. Valuation metrics are stretched, with a price-to-book ratio of 47.08 signaling a premium that may not be justified by fundamentals. Recent technical trends show seller dominance with buyers at 48.98%, injecting short-term uncertainty.
Our Final Verdict about Cloudflare, Inc.
Cloudflare’s strong revenue growth and operational margins suggest potential, but its negative profitability and high leverage caution against aggressive positioning. The Altman Z-Score of 8.53 places it safely away from bankruptcy risk, yet valuation premiums and weak returns on capital may present headwinds. Despite a bullish long-term trend, recent seller pressure advises a wait-and-see stance for a more favorable entry point.
Disclaimer: This content is for informational purposes only and does not constitute financial, investment, or other professional advice. Investing in financial markets involves a significant risk of loss, and past performance is not indicative of future results.
Additional Resources
- Artisan Partners Limited Partnership Trims Stake in Cloudflare, Inc. $NET – MarketBeat (Feb 27, 2026)
- Decoding Cloudflare Inc (NET): A Strategic SWOT Insight – GuruFocus (Feb 27, 2026)
- Why Cloudflare (NET) Shares Are Getting Obliterated Today – Finviz (Feb 23, 2026)
- Cloudflare, Inc. (NET) Enters into Strategic Partnership with Mastercard Incorporated – Insider Monkey (Feb 23, 2026)
- Cloudflare, Inc. (NET) and Mastercard Incorporated Announce Strategic Cybersecurity Partnership – Yahoo Finance (Feb 20, 2026)
For more information about Cloudflare, Inc., please visit the official website: cloudflare.com