Home > Analyses > Financial Services > Citizens Financial Group, Inc.
Citizens Financial Group powers everyday financial lives across 14 states with a robust network of branches and digital platforms. Its dual focus on consumer and commercial banking delivers comprehensive products, from mortgages to corporate finance, shaping regional economic activity. Renowned for innovation and broad market reach, Citizens stands as a vital player in U.S. banking. Yet, as the industry evolves rapidly, I ask: does Citizens’ current strategy sustain its growth and justify its market valuation?

Table of contents
Business Model & Company Overview
Citizens Financial Group, Inc., founded in 1828 and headquartered in Providence, Rhode Island, stands as a leading name in regional banking. It delivers a cohesive suite of retail and commercial banking services, ranging from deposit products and mortgages to wealth management and corporate finance. Operating over 1,200 branches and 3,300 ATMs, Citizens integrates traditional banking with digital platforms, serving individuals, businesses, and institutions across a diverse spectrum.
The company’s revenue engine balances Consumer Banking—offering loans, credit cards, and digital deposits—with Commercial Banking’s specialized lending, treasury, and capital markets solutions. Its footprint spans 14 states and national markets, underpinning growth through diversified financial products. Citizens’ competitive advantage lies in its robust branch network combined with scalable digital services, cementing its role in shaping the future of regional banking.
Financial Performance & Fundamental Metrics
I analyze Citizens Financial Group’s income statement, key financial ratios, and dividend payout policy to assess its profitability, efficiency, and shareholder returns.
Income Statement
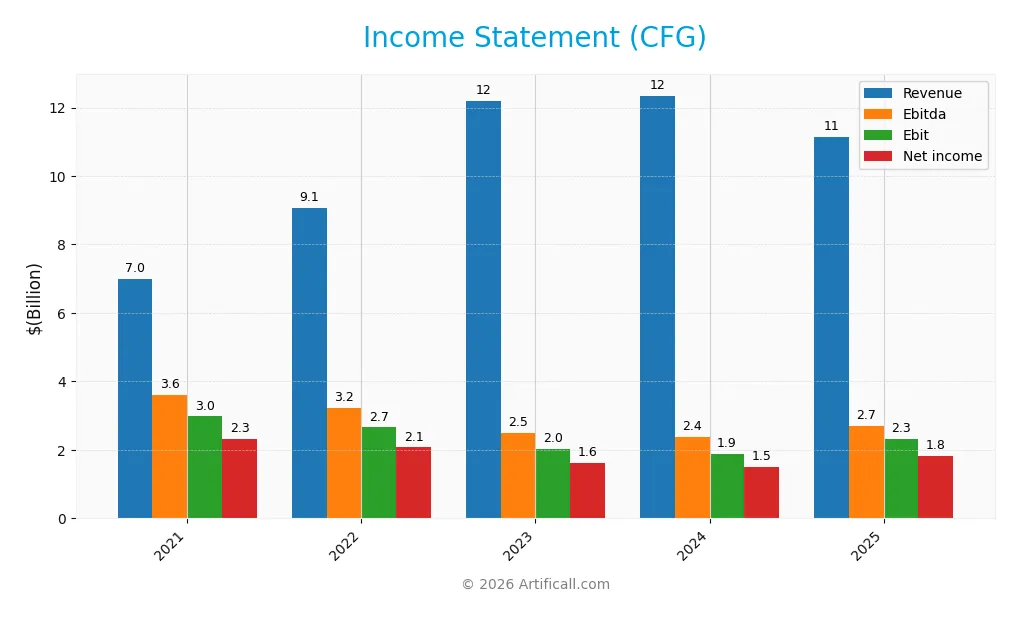
The table below summarizes Citizens Financial Group, Inc.’s key income statement figures for the fiscal years 2021 through 2025.
| 2021 | 2022 | 2023 | 2024 | 2025 | |
|---|---|---|---|---|---|
| Revenue | 6.99B | 9.07B | 12.19B | 12.35B | 11.15B |
| Cost of Revenue | -72M | 1.52B | 4.65B | 5.24B | 3.37B |
| Operating Expenses | 4.08B | 4.89B | 5.51B | 5.22B | 5.45B |
| Gross Profit | 7.06B | 7.55B | 7.54B | 7.11B | 7.78B |
| EBITDA | 3.60B | 3.22B | 2.51B | 2.39B | 2.69B |
| EBIT | 2.98B | 2.66B | 2.03B | 1.89B | 2.33B |
| Interest Expense | 339M | 1.05B | 3.96B | 4.55B | 3.81B |
| Net Income | 2.32B | 2.07B | 1.61B | 1.51B | 1.83B |
| EPS | 5.18 | 4.12 | 3.14 | 3.04 | 3.90 |
| Filing Date | 2022-02-23 | 2023-02-17 | 2024-02-16 | 2025-02-13 | 2026-02-12 |
Income Statement Evolution
Citizens Financial Group’s revenue grew 60% from 2021 to 2025 but declined 9.7% in the last year. Gross profit increased overall, with a 9.4% rise in 2025 despite revenue drop. EBIT and net margin improved by 23.3% and 34.4% respectively in 2025, reflecting stronger profitability and margin expansion despite recent revenue headwinds.
Is the Income Statement Favorable?
In 2025, CFG reported $11.1B revenue with a 69.8% gross margin, signaling operational efficiency. EBIT margin stood at 20.9%, and net margin at 16.4%, both favorable by industry standards. However, interest expense consumed 34.2% of income, posing a risk. Overall, fundamentals appear favorable with strong profitability offsetting revenue softness and elevated interest costs.
Financial Ratios
The following table presents key financial ratios for Citizens Financial Group, Inc. (CFG) over the past five fiscal years, illustrating profitability, liquidity, leverage, and efficiency trends:
| Ratios | 2021 | 2022 | 2023 | 2024 | 2025 |
|---|---|---|---|---|---|
| Net Margin | 33% | 23% | 13% | 12% | 16% |
| ROE | 10% | 9% | 7% | 6% | 7% |
| ROIC | 7% | 5% | 4% | 4% | 4% |
| P/E | 8.7 | 9.0 | 9.8 | 13.1 | 13.8 |
| P/B | 0.86 | 0.79 | 0.65 | 0.81 | 0.96 |
| Current Ratio | 0.24 | 0.20 | 0.24 | 0.25 | 1.04 |
| Quick Ratio | 0.24 | 0.20 | 0.24 | 0.25 | 1.04 |
| D/E | 0.30 | 0.67 | 0.57 | 0.51 | 0.43 |
| Debt-to-Assets | 4% | 7% | 6% | 6% | 5% |
| Interest Coverage | 8.8 | 2.5 | 0.5 | 0.4 | 0.6 |
| Asset Turnover | 0.04 | 0.04 | 0.05 | 0.06 | 0.05 |
| Fixed Asset Turnover | 9.1 | 10.7 | 13.6 | 14.1 | 12.2 |
| Dividend Yield | 3.9% | 4.8% | 5.9% | 4.6% | 3.0% |
Evolution of Financial Ratios
Return on Equity (ROE) declined steadily from 9.9% in 2021 to 7.0% in 2025, indicating reduced profitability. The Current Ratio improved from 0.24 in 2021 to 1.04 in 2025, showing enhanced liquidity. Debt-to-Equity Ratio decreased from 0.57 in 2023 to 0.43 in 2025, reflecting a modest reduction in leverage. Profitability margins showed mixed trends with net margin rising in 2025.
Are the Financial Ratios Fovorable?
In 2025, Citizens Financial Group’s profitability is mixed: net margin (16.4%) is favorable but ROE (7.0%) and ROIC (4.3%) fall below the 13.8% WACC, signaling weak capital returns. Liquidity ratios are mostly neutral to favorable, with a Current Ratio of 1.04. Leverage is favorable, with a low Debt-to-Equity of 0.43 and Debt-to-Assets at 5.0%. Market valuations appear reasonable, supported by a P/E of 13.8 and P/B under 1. Dividend yield at 3.0% also supports income stability.
Shareholder Return Policy
Citizens Financial Group, Inc. maintains a dividend payout ratio around 41-60%, with a stable dividend per share near $1.75-$2.00 and an annual yield close to 3-6%. The payout is generally covered by free cash flow, though buyback activity is not explicitly reported.
This dividend approach aligns with sustainable long-term value creation, balancing shareholder returns with capital retention. The consistent payout ratio and dividend yield suggest prudent capital allocation without risking excessive distributions or overleveraging.
Score analysis
The following radar chart illustrates Citizens Financial Group, Inc.’s key financial scores for a comprehensive overview:
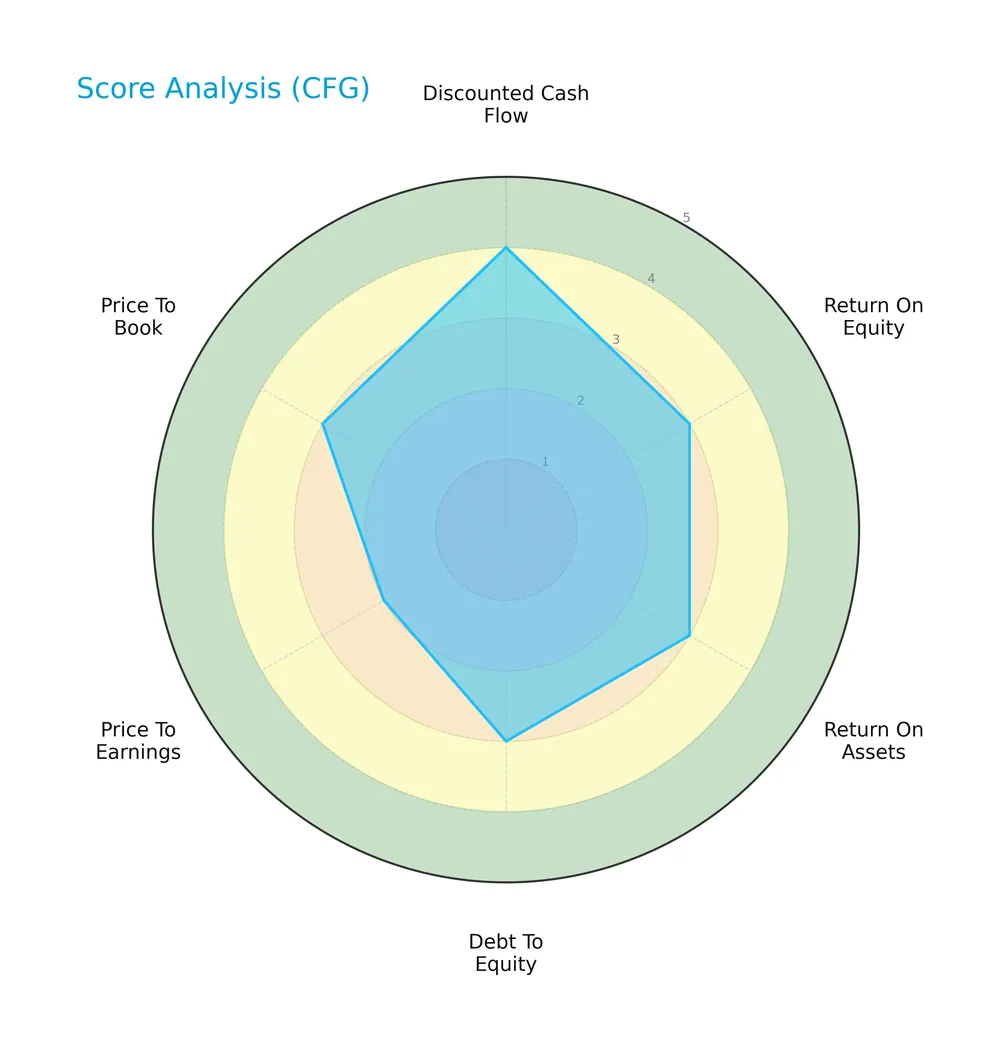
The company shows a favorable discounted cash flow score of 4, with moderate scores of 3 in return on equity, return on assets, debt to equity, and price to book. The price to earnings score lags at 2, indicating relative valuation challenges.
Analysis of the company’s bankruptcy risk
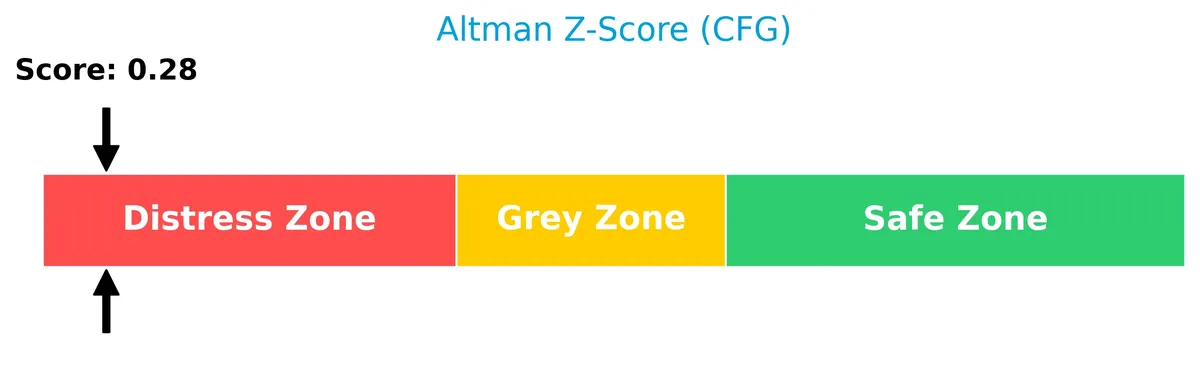
Citizens Financial Group’s Altman Z-Score of 0.28 places it firmly in the distress zone, signaling a high risk of financial distress and potential bankruptcy:
Is the company in good financial health?
This Piotroski diagram highlights the company’s financial strength based on nine key criteria:

With a Piotroski score of 7, Citizens Financial Group demonstrates strong financial health, reflecting solid profitability, leverage, and liquidity metrics despite bankruptcy risk concerns.
Competitive Landscape & Sector Positioning
This section examines Citizens Financial Group’s strategic positioning, revenue streams, and key products within the regional banking sector. I will assess whether the company holds a competitive advantage over its main rivals.
Strategic Positioning
Citizens Financial Group operates a diversified portfolio with Consumer and Commercial Banking segments. It serves various industries and offers retail, mortgage, wealth, and corporate finance products. Its geographic focus remains regional, with 1,200 branches in 14 U.S. states plus D.C.
Revenue by Segment
The pie chart illustrates Citizens Financial Group’s revenue distribution across major segments for fiscal year 2025, highlighting fee-based income streams.
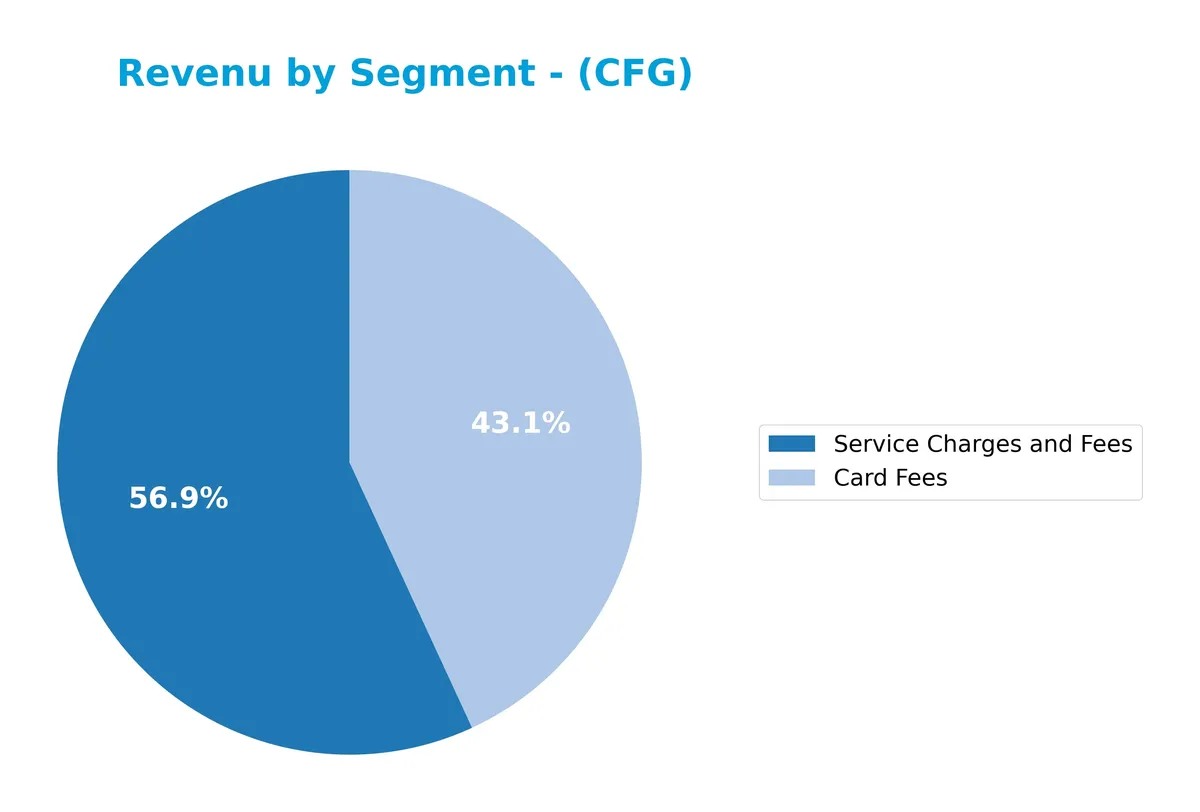
In 2025, Citizens’ revenue centers on Service Charges and Fees at $442M and Card Fees at $335M. Compared to prior years, Service Charges and Fees grew modestly, while Card Fees declined from $362M in 2024. The absence of Commercial and Consumer Banking figures in recent data signals a shift toward fee-driven income. This concentration may increase vulnerability to regulatory changes or consumer spending trends.
Key Products & Brands
The following table summarizes Citizens Financial Group’s main products and services across its business segments:
| Product | Description |
|---|---|
| Consumer Banking | Retail banking products including deposits, mortgages, credit cards, business loans, and wealth management. |
| Commercial Banking | Financial solutions for businesses, including lending, leasing, treasury management, and capital markets. |
| Card Fees | Revenue generated from fees on credit and debit card transactions. |
| Service Charges and Fees | Income from various account maintenance fees and transaction-related charges. |
| Trust and Investment Services Fees | Fees earned from trust management and investment advisory services. |
Citizens Financial Group operates a diversified banking portfolio, balancing consumer and commercial offerings. Revenue from card fees and service charges provides steady fee income, while trust and investment services add a growing advisory dimension.
Main Competitors
There are 9 main competitors in the sector, with the table listing the top 9 leaders by market capitalization:
| Competitor | Market Cap. |
|---|---|
| U.S. Bancorp | 83.8B |
| The PNC Financial Services Group, Inc. | 82.9B |
| Truist Financial Corporation | 64.6B |
| Fifth Third Bancorp | 31.5B |
| M&T Bank Corporation | 31.4B |
| Huntington Bancshares Incorporated | 25.5B |
| Citizens Financial Group, Inc. | 25.5B |
| Regions Financial Corporation | 24.9B |
| KeyCorp | 22.9B |
Citizens Financial Group ranks 7th among its 9 competitors. It holds 33.35% of the market cap of the sector leader, U.S. Bancorp. The company is positioned below both the average market cap of the top 10 (43.7B) and the median market cap of the sector (31.4B). Its market cap is roughly 8.76% below the competitor directly above it, Huntington Bancshares.
Comparisons with competitors
Check out how we compare the company to its competitors:
Does CFG have a competitive advantage?
Citizens Financial Group, Inc. does not present a competitive advantage based on its negative ROIC compared to WACC and a declining ROIC trend from 2021 to 2025. The company is shedding value and experiencing decreasing profitability, which signals a very unfavorable moat status.
Looking ahead, Citizens Financial Group operates across diverse banking segments with digital and branch networks in 14 states. Its future opportunities lie in expanding consumer and commercial banking products and leveraging technological platforms to capture new markets and improve service delivery.
SWOT Analysis
This SWOT analysis highlights Citizens Financial Group’s core competitive position and challenges to guide strategic decisions.
Strengths
- strong net margin at 16.4%
- favorable gross profit growth of 9.4%
- solid dividend yield of 3.0%
Weaknesses
- declining ROIC below WACC indicating value destruction
- revenue dropped 9.7% in last year
- Altman Z-Score in distress zone signals financial risk
Opportunities
- digital banking expansion potential
- growing commercial banking services
- opportunity to improve asset turnover efficiency
Threats
- rising interest expense pressure at 34.2% of revenue
- intense regional banking competition
- macroeconomic uncertainties impacting loan demand
Citizens Financial shows resilience in profitability and dividends but struggles with declining returns and revenue shrinkage. Strategic focus must prioritize restoring ROIC, boosting revenue, and managing financial risk to regain investor confidence.
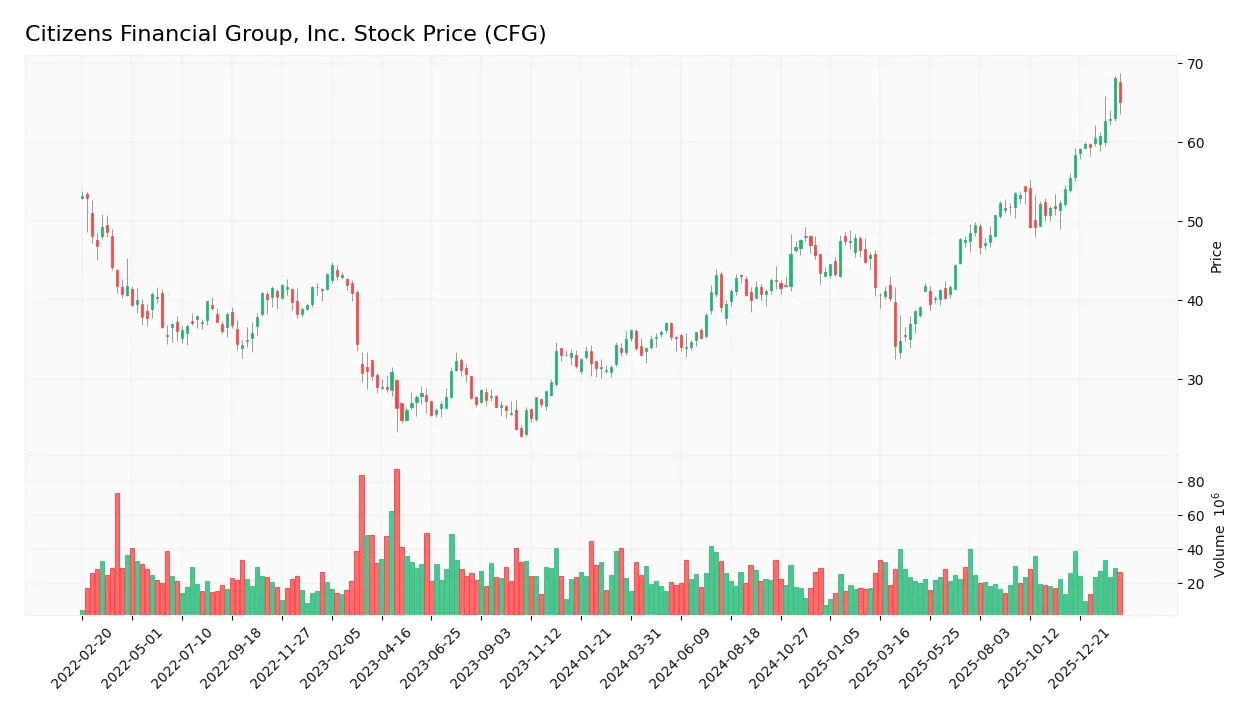
Stock Price Action Analysis
The weekly stock chart of Citizens Financial Group, Inc. (CFG) illustrates significant price movements and volatility over the past 100 weeks:
Trend Analysis
Over the past 100 weeks, CFG’s stock price rose 85.21%, confirming a bullish trend with accelerating momentum. The stock traded between 33.14 and 68.12, showing robust upward movement. Recent 11-week data shows a 20.33% gain, slope 1.01, and reduced volatility (3.7 std dev), reinforcing positive momentum.
Volume Analysis
Trading volume totals 2.86B shares, with buyers accounting for 63.3%, but volume is decreasing overall. In the recent period, buyer dominance surged to 86.1%, indicating strong buyer-driven activity. This suggests growing investor confidence despite declining market participation.
Target Prices
Analysts set a target consensus of $70.08 for Citizens Financial Group, Inc. (CFG).
| Target Low | Target High | Consensus |
|---|---|---|
| 60 | 80 | 70.08 |
This range reflects moderate confidence, indicating expectations of steady growth but some valuation uncertainty.

Don’t Let Luck Decide Your Entry Point
Optimize your entry points with our advanced ProRealTime indicators. You’ll get efficient buy signals with precise price targets for maximum performance. Start outperforming now!
Analyst & Consumer Opinions
This section examines the latest analyst grades and consumer feedback on Citizens Financial Group, Inc. (CFG).
Stock Grades
Here are the latest verified grades from leading financial institutions for Citizens Financial Group, Inc.:
| Grading Company | Action | New Grade | Date |
|---|---|---|---|
| JP Morgan | Maintain | Overweight | 2026-02-09 |
| Evercore ISI Group | Maintain | Outperform | 2026-02-05 |
| Truist Securities | Maintain | Hold | 2026-01-26 |
| Citigroup | Maintain | Buy | 2026-01-26 |
| Argus Research | Maintain | Buy | 2026-01-23 |
| B of A Securities | Maintain | Buy | 2026-01-22 |
| Morgan Stanley | Maintain | Overweight | 2026-01-22 |
| DA Davidson | Maintain | Buy | 2026-01-22 |
| RBC Capital | Maintain | Outperform | 2026-01-22 |
| Keefe, Bruyette & Woods | Maintain | Outperform | 2026-01-22 |
The consensus leans strongly toward buying, with the majority maintaining positive outlooks. Only a minority suggest a hold, and there are no downgrades or sell ratings, indicating steady confidence across top analysts.
Consumer Opinions
Consumers express mixed feelings about Citizens Financial Group, Inc., reflecting its strengths in service and areas needing improvement.
| Positive Reviews | Negative Reviews |
|---|---|
| Friendly and helpful customer service | Lengthy wait times on phone support |
| Easy-to-use mobile banking app | Occasional glitches in online transactions |
| Competitive mortgage rates | Branch availability limited in some regions |
| Transparent fee structure | Slow resolution of disputes |
Overall, customers appreciate CFG’s service quality and competitive rates but frequently cite delays in support and tech issues as key drawbacks. This feedback suggests room for operational improvements despite solid core offerings.
Risk Analysis
The following table summarizes key risks facing Citizens Financial Group, Inc., including their likelihood and potential impact:
| Category | Description | Probability | Impact |
|---|---|---|---|
| Financial Distress | Altman Z-Score in distress zone indicates elevated bankruptcy risk. | High | High |
| Profitability | Low ROE (6.96%) and ROIC (4.25%) below WACC (13.77%) signal weak returns. | High | Medium |
| Interest Coverage | Interest coverage ratio of 0.61 warns of potential difficulty servicing debt. | Medium | High |
| Market Volatility | Beta of 1.07 suggests stock price sensitive to market swings. | Medium | Medium |
| Asset Efficiency | Low asset turnover (0.05) reflects inefficient use of assets. | Medium | Medium |
Citizens faces elevated bankruptcy risk, as the Altman Z-Score remains deep in the distress zone. Its returns on capital trail the cost of capital, signaling value destruction. Interest coverage below 1 raises concern about debt servicing amid rising rates. These financial weaknesses overshadow favorable dividend yield and moderate valuation.
Should You Buy Citizens Financial Group, Inc.?
Citizens Financial Group, Inc. appears to be facing a challenging profile with declining operational efficiency and a deteriorating moat, suggesting value destruction. Despite manageable leverage and a strong Piotroski score, its Altman Z-Score signals financial distress. Overall rating is B+.
Strength & Efficiency Pillars
Citizens Financial Group, Inc. delivers solid operational margins, with a gross margin of 69.75%, an EBIT margin of 20.88%, and a net margin of 16.42%. These figures reflect effective cost management and profitable core activities. However, the company’s ROIC stands at 4.25%, below its WACC of 13.77%, indicating it is currently destroying value rather than creating it. Despite profitability, Citizens’ declining ROIC trend signals weakening capital efficiency.
Weaknesses and Drawbacks
The company is in financial distress, as shown by an Altman Z-Score of 0.28, signaling a high bankruptcy risk. This solvency concern overshadows its profitable margins. Interest coverage is weak at 0.61, revealing difficulty in servicing debt. Although the P/E ratio of 13.76 is moderate, recent revenue growth is negative (-9.71%), and asset turnover is notably low (0.05), limiting operational scalability. These weaknesses warrant caution.
Our Final Verdict about Citizens Financial Group, Inc.
Despite operational profitability, Citizens Financial Group’s distress-zone Altman Z-Score makes its financial profile highly speculative. The solvency risk fundamentally undermines confidence, suggesting this investment might be too risky for conservative capital. Investors should weigh this significant risk against any operational strengths before considering exposure.
Disclaimer: This content is for informational purposes only and does not constitute financial, investment, or other professional advice. Investing in financial markets involves a significant risk of loss, and past performance is not indicative of future results.
Additional Resources
- 22,980 Shares in Citizens Financial Group, Inc. $CFG Bought by Krilogy Financial LLC – MarketBeat (Feb 13, 2026)
- Citizens Financial Group, Inc. Declares Dividends on Preferred Stock – Yahoo Finance (Feb 11, 2026)
- Assessing Citizens Financial Group (CFG) Valuation After Subordinated Note Redemptions Are Announced – Sahm (Feb 11, 2026)
- Citizens Financial Group Inc (CFG) Stock Price Down 3.35% on Feb 12 – GuruFocus (Feb 12, 2026)
- Key facts: JP Morgan Raises Citizens Financial Price Target to $71; CFG Expands Nationally – TradingView (Feb 10, 2026)
For more information about Citizens Financial Group, Inc., please visit the official website: citizensbank.com