Home > Analyses > Technology > Cisco Systems, Inc.
Cisco Systems, Inc. powers the backbone of global communication by enabling seamless connectivity across enterprises and service providers. Renowned for its cutting-edge networking equipment and security solutions, Cisco leads the communication technology industry with flagship products like its campus and data center switches, routers, and the Webex collaboration suite. As the digital landscape rapidly evolves, the question remains: can Cisco’s innovation and market strength continue to drive sustainable growth and justify its current market valuation?

Table of contents
Business Model & Company Overview
Cisco Systems, Inc., founded in 1984 and headquartered in San Jose, California, stands as a dominant player in the communication equipment industry. Its ecosystem integrates Internet Protocol-based networking, switching, routing, wireless, security, and collaboration products, creating seamless connectivity solutions for enterprises, governments, and service providers worldwide. This comprehensive portfolio underpins Cisco’s mission to enable secure, reliable communication and data exchange across diverse environments.
The company’s revenue engine balances hardware sales with high-margin software and recurring services, including advanced security and cloud collaboration offerings. Cisco’s strategic footprint spans the Americas, Europe, Asia, and beyond, supported by direct sales and extensive partner networks. Its competitive advantage lies in its broad product suite combined with service and support, securing a robust economic moat as it shapes the future of global networking infrastructure.
Financial Performance & Fundamental Metrics
In this section, I analyze Cisco Systems, Inc.’s income statement, key financial ratios, and dividend payout policy to evaluate its financial health and investment potential.
Income Statement
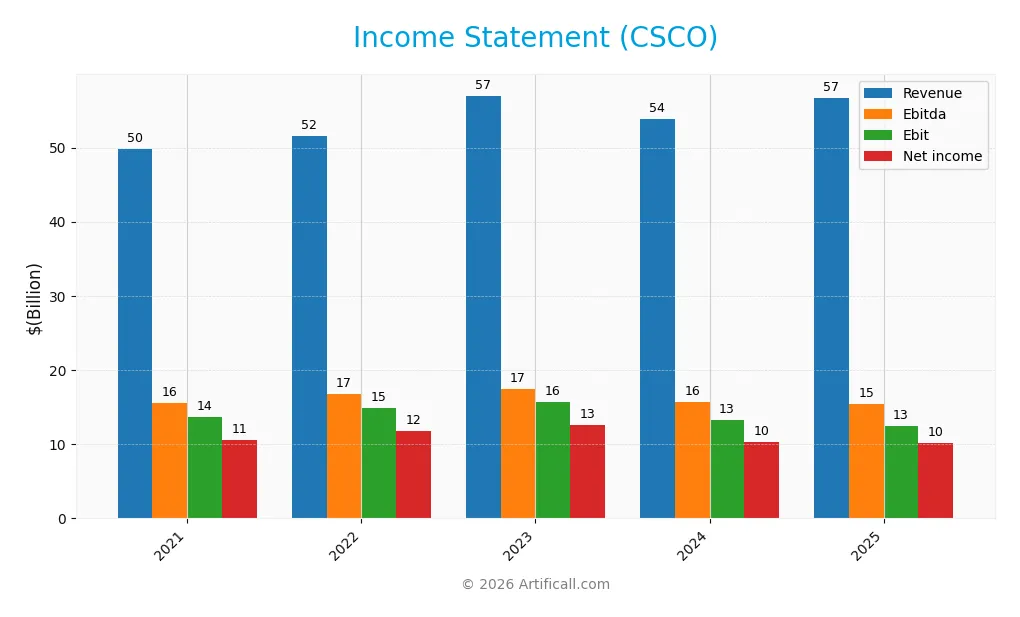
The table below outlines Cisco Systems, Inc.’s key income statement figures for the fiscal years 2021 through 2025, providing a clear view of its financial performance trends.
| 2021 | 2022 | 2023 | 2024 | 2025 | |
|---|---|---|---|---|---|
| Revenue | 49.8B | 51.6B | 57.0B | 53.8B | 56.7B |
| Cost of Revenue | 17.9B | 19.3B | 21.2B | 18.9B | 19.9B |
| Operating Expenses | 19.1B | 18.3B | 20.7B | 22.6B | 25.0B |
| Gross Profit | 31.9B | 32.2B | 35.8B | 34.8B | 36.8B |
| EBITDA | 15.6B | 16.8B | 17.5B | 15.7B | 15.4B |
| EBIT | 13.7B | 14.8B | 15.7B | 13.2B | 12.5B |
| Interest Expense | 0.43B | 0.36B | 0.43B | 1.01B | 1.59B |
| Net Income | 10.6B | 11.8B | 12.6B | 10.3B | 10.2B |
| EPS | 2.51 | 2.83 | 3.08 | 2.55 | 2.56 |
| Filing Date | 2021-09-09 | 2022-09-08 | 2023-09-07 | 2024-09-05 | 2025-09-03 |
Income Statement Evolution
From 2021 to 2025, Cisco Systems’ revenue grew by 13.7%, showing a favorable trend, while net income declined by 3.9%, indicating some pressure on profitability. Gross margins remained stable and favorable at 64.9%, but net margins contracted by 15.5%, reflecting increased operating expenses and a weaker bottom line. The EBIT margin also showed a slight unfavorable trend in the last year.
Is the Income Statement Favorable?
In fiscal 2025, Cisco reported $56.7B in revenue, up 5.3% from 2024, but net income decreased by 1.4% to $10.2B with a net margin of 18.0%, still favorable. Operating expenses grew faster than revenue, impacting EBIT which declined by 5.5%. Despite these headwinds, key profitability metrics remain solid, and interest expenses are well-managed, contributing to an overall favorable income statement assessment.
Financial Ratios
The table below presents a selection of key financial ratios for Cisco Systems, Inc. over recent fiscal years, highlighting profitability, valuation, liquidity, leverage, and efficiency metrics:
| Ratios | 2021 | 2022 | 2023 | 2024 | 2025 |
|---|---|---|---|---|---|
| Net Margin | 21% | 23% | 22% | 19% | 18% |
| ROE | 26% | 30% | 28% | 23% | 22% |
| ROIC | 14% | 16% | 17% | 11% | 12% |
| P/E | 22.1 | 16.0 | 16.9 | 19.0 | 26.8 |
| P/B | 5.66 | 4.75 | 4.80 | 4.31 | 5.83 |
| Current Ratio | 1.49 | 1.43 | 1.38 | 0.91 | 1.00 |
| Quick Ratio | 1.43 | 1.33 | 1.27 | 0.83 | 0.91 |
| D/E | 0.28 | 0.27 | 0.19 | 0.71 | 0.63 |
| Debt-to-Assets | 12% | 11% | 8% | 26% | 24% |
| Interest Coverage | 29.6 | 38.8 | 35.2 | 12.1 | 7.38 |
| Asset Turnover | 0.51 | 0.55 | 0.56 | 0.43 | 0.46 |
| Fixed Asset Turnover | 21.3 | 25.8 | 27.3 | 25.7 | 16.6 |
| Dividend Yield | 2.64% | 3.30% | 3.00% | 3.26% | 2.36% |
Evolution of Financial Ratios
Over the period, Cisco’s Return on Equity (ROE) showed fluctuations, peaking at 28.44% in 2023 before settling at 21.73% in 2025, indicating some moderation in profitability. The Current Ratio declined steadily from 1.49 in 2021 to nearly 1.0 in 2025, suggesting decreasing short-term liquidity. The Debt-to-Equity Ratio increased markedly from 0.19 in 2023 to 0.63 in 2025, reflecting higher leverage over time.
Are the Financial Ratios Favorable?
In 2025, Cisco’s profitability ratios such as net margin (17.97%) and ROE (21.73%) are favorable, supported by solid return on invested capital (11.62%). Liquidity ratios are mixed: the Current Ratio is unfavorable at 1.0, while the Quick Ratio is neutral at 0.91. Leverage appears moderate with a neutral Debt-to-Equity ratio of 0.63 and favorable debt-to-assets at 24.24%. Market valuations show some concerns, with high Price-to-Earnings and Price-to-Book ratios deemed unfavorable. Overall, 57% of ratios are favorable, indicating a generally positive financial profile.
Shareholder Return Policy
Cisco Systems, Inc. maintains a consistent dividend payout ratio around 50-63%, with a dividend yield near 2.4-3.3%. The dividend per share has gradually increased over recent years, supported by free cash flow coverage close to 1. The company also engages in share buybacks, balancing distributions with capital expenditures.
This approach reflects a stable return policy, combining dividends and buybacks funded by sound cash flow generation. It appears designed to support sustainable long-term shareholder value without excessive risk from unsustainable distributions or repurchases.
Score analysis
The following radar chart presents an overview of key financial scores for Cisco Systems, Inc., highlighting various valuation and performance metrics:
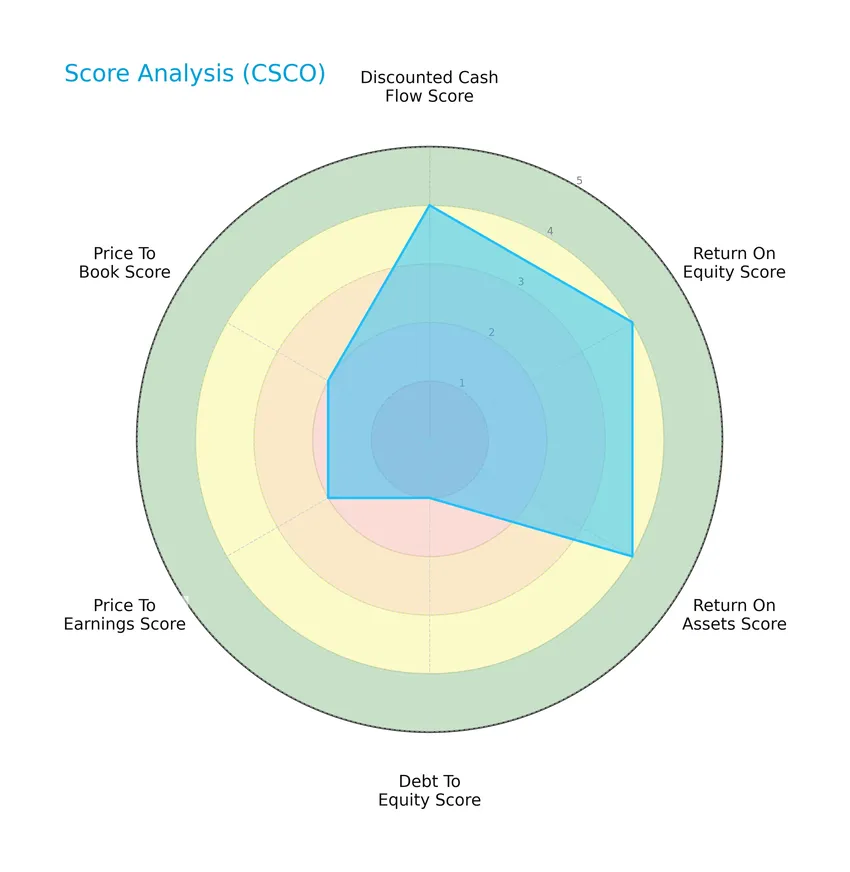
Cisco Systems shows favorable scores in discounted cash flow, return on equity, and return on assets, each rated 4. However, its debt-to-equity score is very unfavorable at 1, while price-to-earnings and price-to-book scores are moderate at 2, reflecting mixed valuation signals.
Analysis of the company’s bankruptcy risk
Cisco Systems’ Altman Z-Score places it in the safe zone, indicating a low risk of bankruptcy and financial distress:

Is the company in good financial health?
The Piotroski Score chart provides insight into Cisco Systems’ overall financial strength and operational efficiency:

With a Piotroski Score of 7, Cisco demonstrates strong financial health, suggesting solid profitability, liquidity, and leverage metrics, though not in the very strong category.
Competitive Landscape & Sector Positioning
This sector analysis will examine Cisco Systems, Inc.’s strategic positioning, revenue by segment, key products, main competitors, and competitive advantages. I will also assess whether Cisco holds a competitive advantage over its industry peers.
Strategic Positioning
Cisco Systems, Inc. maintains a diversified product portfolio focused on networking ($28.3B), services ($21.9B), security ($8.1B), and collaboration ($4.2B) segments. Geographically, it operates globally with significant revenue from the United States ($33.7B), Europe, Middle East, Africa ($14.8B), and Asia Pacific including Japan and China ($8.2B).
Revenue by Segment
This pie chart illustrates Cisco Systems, Inc.’s revenue distribution by segment for the fiscal year 2025, highlighting key areas of business focus and their respective contributions.
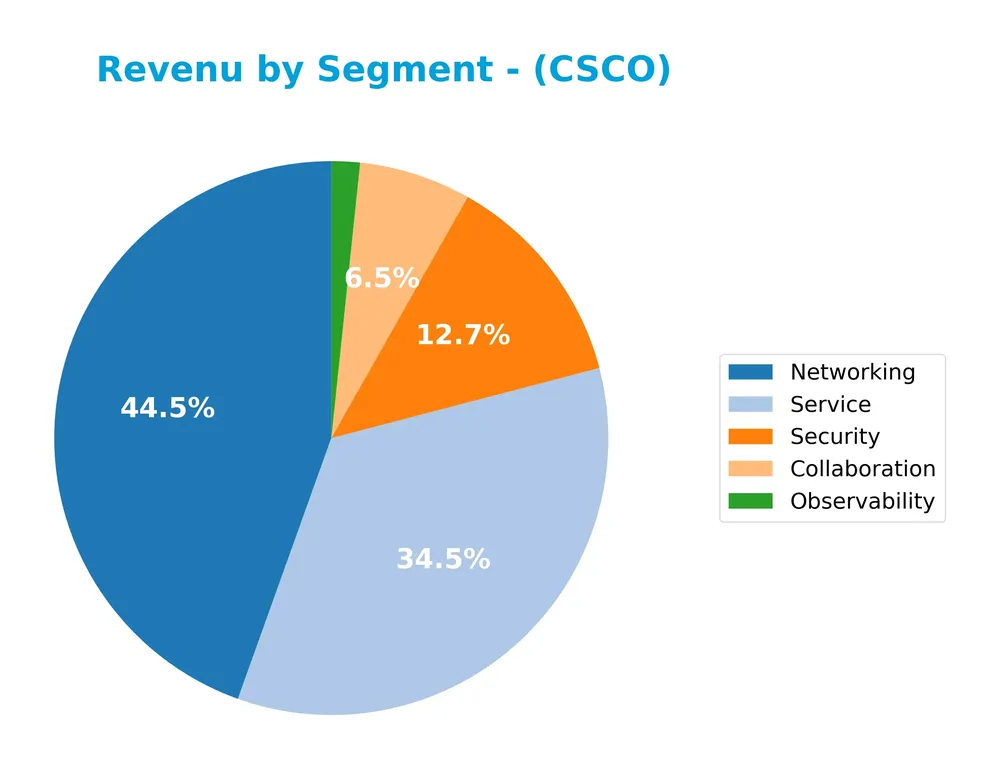
In 2025, Networking remains the dominant segment with $28.3B, slightly down from the previous year but still the main revenue driver. Service revenue shows a strong increase to $21.96B, signaling a growing emphasis on service-based offerings. Security also surged to $8.1B, reflecting heightened demand for cybersecurity solutions. Collaboration and Observability contribute smaller but stable shares, indicating diversification without over-concentration risk. Overall, Cisco shows a balanced portfolio with strategic growth in services and security.
Key Products & Brands
The table below presents Cisco Systems, Inc.’s main products and brands with concise descriptions:
| Product | Description |
|---|---|
| Networking | Internet Protocol-based networking products including campus switching, data center switching, and enterprise routing ensuring secure and reliable connectivity. |
| Security | Network security solutions encompassing identity and access management, secure access service edge, and threat intelligence, detection, and response offerings. |
| Collaboration | Products like Webex Suite, collaboration devices, contact center, and communication platform as a service, supporting cloud, on-premise, and hybrid environments. |
| Observability | Network assurance, monitoring, analytics, and observability suite for comprehensive network insight. |
| Service | Technical support, advanced services, and advisory services provided to customers globally. |
Cisco’s portfolio is diversified across networking infrastructure, security, collaboration tools, observability solutions, and extensive support services, serving a wide range of clients worldwide.
Main Competitors
There are 7 competitors in total, with the table below listing the top 7 leaders by market capitalization:
| Competitor | Market Cap. |
|---|---|
| Cisco Systems, Inc. | 300.4B |
| Motorola Solutions, Inc. | 63.5B |
| Nokia Oyj | 34.9B |
| Hewlett Packard Enterprise Company | 32.0B |
| Credo Technology Group Holding Ltd | 24.7B |
| Zebra Technologies Corporation | 12.6B |
| AudioCodes Ltd. | 255M |
Cisco Systems, Inc. ranks 1st among its 7 competitors, with a market cap nearly equal to the top player (relative market cap 0.9809). The company’s market capitalization is well above both the average market cap of the top 10 competitors (approximately 66.9B) and the median market cap within the sector (32.0B). Cisco holds a significant lead over its closest competitor below, Motorola Solutions, by a margin of -364.4%.
Comparisons with competitors
Check out how we compare the company to its competitors:
Does CSCO have a competitive advantage?
Cisco Systems, Inc. presents a slight competitive advantage as it creates value with a ROIC exceeding WACC by 4%, indicating efficient capital use and profitability despite a declining ROIC trend. Its income statement shows favorable margins and overall value creation, though recent EBIT and net margin growth have been unfavorable.
Looking ahead, Cisco’s future opportunities lie in expanding its Internet Protocol-based networking products and cloud collaboration solutions across diverse global markets, including the US, Europe, and Asia-Pacific. The company’s strategic alliances and broad product portfolio position it to capitalize on evolving communication technology demands.
SWOT Analysis
This SWOT analysis highlights the key internal and external factors affecting Cisco Systems, Inc. to guide investment decisions.
Strengths
- strong market position with 294B market cap
- diverse product portfolio including networking, security, and collaboration
- favorable profitability metrics with 18% net margin
Weaknesses
- declining ROIC trend indicating weakening profitability
- moderate revenue growth of 5.3% in last year
- moderate liquidity ratios with current ratio at 1.0
Opportunities
- expansion in cloud and hybrid collaboration solutions
- growing demand in emerging markets like Asia Pacific
- increasing cybersecurity needs driving security product growth
Threats
- intense competition in tech and networking sectors
- economic uncertainty impacting enterprise IT spending
- pricing pressure due to high valuation multiples (PE 26.8, PB 5.8)
Cisco’s strong market presence and diversified offerings position it well for growth, but investors should watch the declining profitability trend and valuation premium. Strategic focus on innovation and market expansion is critical to mitigate risks and enhance shareholder value.
Stock Price Action Analysis
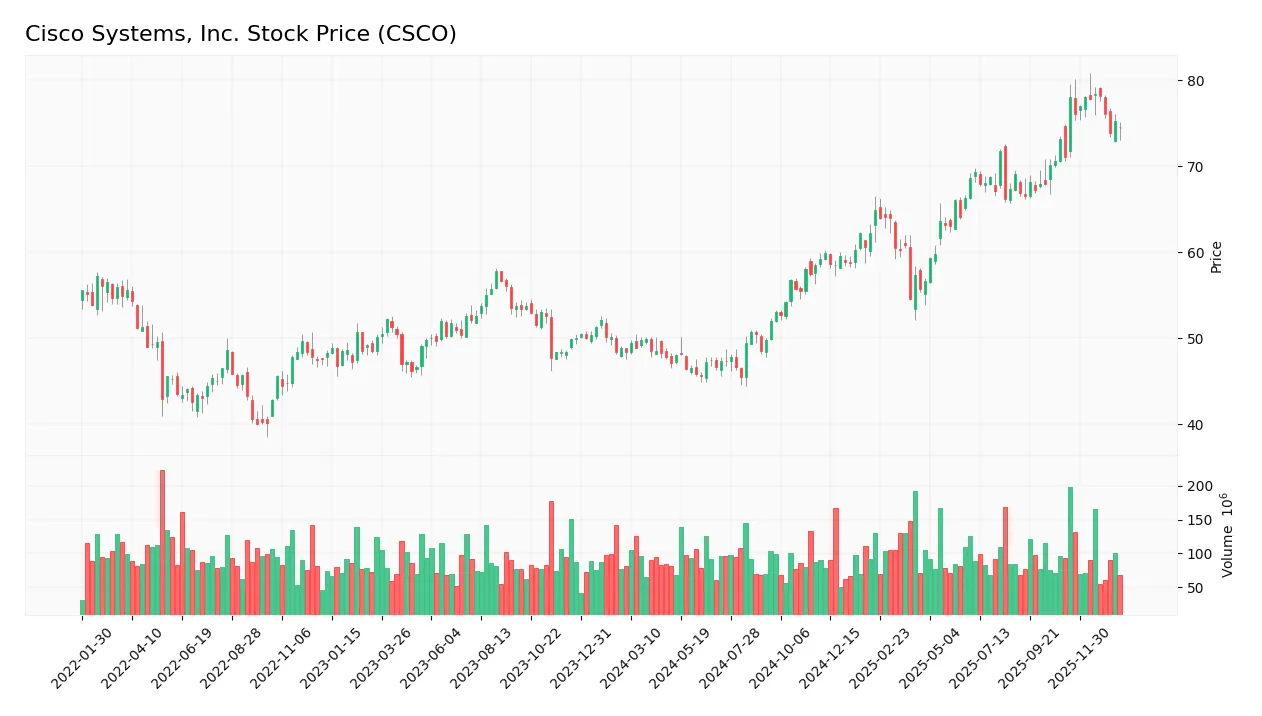
The weekly stock chart for Cisco Systems, Inc. (CSCO) illustrates price movements over the past 100 weeks, highlighting key support and resistance levels:
Trend Analysis
Over the past 12 months, CSCO’s stock price increased by 54.11%, indicating a bullish trend with deceleration in momentum. The price fluctuated between a low of 45.47 and a high of 78.42, showing notable volatility with a standard deviation of 9.7%. Recent price action from November 2025 to January 2026 shows a more neutral trend, up 4.95% with a slight negative slope and lower volatility at 2.11%.
Volume Analysis
Over the last three months, trading volume for CSCO has been increasing, with a total buyer volume of 604M versus seller volume of 588M, reflecting a nearly balanced, neutral buyer dominance of 50.67%. This suggests steady market participation without strong directional conviction among investors.
Target Prices
The consensus target prices for Cisco Systems, Inc. indicate moderate upside potential.
| Target High | Target Low | Consensus |
|---|---|---|
| 91 | 69 | 82.67 |
Analysts expect Cisco’s stock to trade between $69 and $91, with an average consensus target near $82.67, reflecting cautious optimism in its near-term valuation.

Don’t Let Luck Decide Your Entry Point
Optimize your entry points with our advanced ProRealTime indicators. You’ll get efficient buy signals with precise price targets for maximum performance. Start outperforming now!
Analyst & Consumer Opinions
This section reviews recent analyst ratings and consumer feedback to assess Cisco Systems, Inc.’s market perception.
Stock Grades
Here is the latest summary of Cisco Systems, Inc. stock grades from prominent financial institutions as of late 2025:
| Grading Company | Action | New Grade | Date |
|---|---|---|---|
| Morgan Stanley | Maintain | Overweight | 2025-12-17 |
| B of A Securities | Maintain | Buy | 2025-11-13 |
| Barclays | Maintain | Equal Weight | 2025-11-13 |
| Wells Fargo | Maintain | Overweight | 2025-11-13 |
| Keybanc | Maintain | Overweight | 2025-11-13 |
| Rosenblatt | Maintain | Buy | 2025-11-13 |
| JP Morgan | Maintain | Overweight | 2025-11-13 |
| Melius Research | Maintain | Buy | 2025-11-13 |
| UBS | Maintain | Buy | 2025-11-13 |
| Morgan Stanley | Maintain | Overweight | 2025-11-13 |
The consensus among these major analysts remains predominantly positive, with a strong prevalence of buy or overweight ratings and very few hold ratings. This indicates steady confidence in the stock’s performance outlook during this period.
Consumer Opinions
Consumer sentiment around Cisco Systems, Inc. reflects a blend of appreciation for its innovation and concerns about pricing and support responsiveness.
| Positive Reviews | Negative Reviews |
|---|---|
| Reliable networking products with strong performance | Customer service can be slow to respond |
| Consistently high-quality hardware and software | Solutions sometimes come with a high price tag |
| Robust security features that meet enterprise needs | Complex setup process for some products |
| Frequent updates and improvements | Limited flexibility in some product configurations |
Overall, consumers praise Cisco for its dependable and secure networking solutions, though some express frustration with customer support delays and premium pricing.
Risk Analysis
The following table summarizes key risks related to Cisco Systems, Inc., highlighting their likelihood and potential impact on investment returns:
| Category | Description | Probability | Impact |
|---|---|---|---|
| Market Valuation | Elevated P/E (26.83) and P/B (5.83) ratios suggest the stock may be overvalued in a volatile market. | Medium | High |
| Liquidity Risk | Current ratio at 1.0 indicates tight short-term liquidity, possibly affecting operational flexibility. | Medium | Medium |
| Debt Management | Debt-to-equity ratio shows unfavorable score, increasing financial leverage risks in downturns. | Medium | Medium |
| Competitive Pressure | Intense competition in communication equipment may pressure margins and slow growth. | High | High |
| Technology Change | Rapid innovation requires constant investment; failure to adapt could reduce market share. | Medium | High |
| Geopolitical Risk | Exposure to global markets including China entails risks from trade tensions and regulatory changes. | Medium | Medium |
Cisco’s financial strength is supported by a safe Altman Z-Score (3.16) and a strong Piotroski Score (7), indicating solid financial health and low bankruptcy risk. However, valuation concerns and competitive dynamics remain the most significant risks to monitor closely.
Should You Buy Cisco Systems, Inc.?
Cisco Systems, Inc. appears to be creating value with robust profitability metrics, though its declining ROIC suggests some erosion in competitive advantage. Despite a manageable leverage profile, the company’s overall rating is a solid B, indicating a very favorable financial health profile.
Strength & Efficiency Pillars
Cisco Systems, Inc. presents a robust financial profile underscored by a net margin of 17.97% and a return on equity (ROE) of 21.73%, reflecting solid profitability and shareholder value creation. Its return on invested capital (ROIC) stands at 11.62%, exceeding the weighted average cost of capital (WACC) of 7.61%, confirming the company as a clear value creator. Financial health is reinforced by a strong Altman Z-Score of 3.16, placing Cisco securely in the safe zone, and a Piotroski score of 7, indicative of strong operational fundamentals.
Weaknesses and Drawbacks
Despite these strengths, Cisco faces valuation challenges with a price-to-earnings (P/E) ratio of 26.83 and a price-to-book (P/B) ratio of 5.83, both marked as unfavorable, implying a premium valuation that may limit upside potential. The company’s liquidity position reveals concerns, with a current ratio at a precarious 1.0, signaling tight short-term financial flexibility. Asset turnover is relatively low at 0.46, suggesting inefficiencies in asset utilization. These factors combined introduce risks related to market pressure and operational leverage.
Our Verdict about Cisco Systems, Inc.
Cisco’s long-term fundamental profile appears favorable, supported by strong profitability and financial health metrics. The overall stock trend remains bullish, though recent price movements show a slight deceleration and a neutral buyer dominance of 50.67%. This suggests that despite the company’s intrinsic strength, investors might consider a cautiously optimistic stance, as current market dynamics could warrant a wait-and-see approach for a more attractive entry point.
Disclaimer: This content is for informational purposes only and does not constitute financial, investment, or other professional advice. Investing in financial markets involves a significant risk of loss, and past performance is not indicative of future results.
Additional Resources
- Rakuten Investment Management Inc. Invests $3.02 Million in Cisco Systems, Inc. $CSCO – MarketBeat (Jan 24, 2026)
- Cisco Systems, Inc. (CSCO) Announces its Multi-Year Partnership with Georgetown University – Yahoo Finance (Jan 23, 2026)
- Cisco Systems, Inc. (CSCO) Announces its Multi-Year Partnership with Georgetown University – Insider Monkey (Jan 23, 2026)
- Cisco-backed World Labs in talks to raise funding at $5B valuation: report (CSCO:NASDAQ) – Seeking Alpha (Jan 23, 2026)
- Teacher Retirement System of Texas Reduces Stake in Cisco Systems, Inc. $CSCO – MarketBeat (Jan 23, 2026)
For more information about Cisco Systems, Inc., please visit the official website: cisco.com