Home > Analyses > Industrials > Cintas Corporation
Cintas Corporation fundamentally shapes workplace environments by providing essential uniforms and facility services that countless businesses rely on daily. As a leading provider in the specialty business services sector, Cintas is renowned for its comprehensive uniform rental, first aid, and safety solutions, underpinned by a strong reputation for quality and innovation. With a vast distribution network and a diverse client base, the question remains: does Cintas’s current market position and operational strength justify its growth prospects and valuation in 2026?

Table of contents
Business Model & Company Overview
Cintas Corporation, founded in 1968 and headquartered in Cincinnati, Ohio, stands as a leader in the specialty business services sector. It offers a cohesive ecosystem centered on corporate identity uniforms and related services, including uniform rental and facility services, first aid and safety, and fire protection. Its operations span the United States, Canada, and Latin America, serving a broad client base from small businesses to major corporations.
The company’s revenue engine combines uniform rental, sales, and ancillary facility services with first aid and fire safety products, delivered through an extensive distribution and local delivery network. This diversified model supports steady recurring income while maintaining strategic market penetration across the Americas. Cintas’ integrated service platform and strong market position create a durable economic moat, reinforcing its influence in shaping the future of corporate identity and facility services.
Financial Performance & Fundamental Metrics
This section provides a fundamental analysis of Cintas Corporation, focusing on its income statement, key financial ratios, and dividend payout policy.
Income Statement
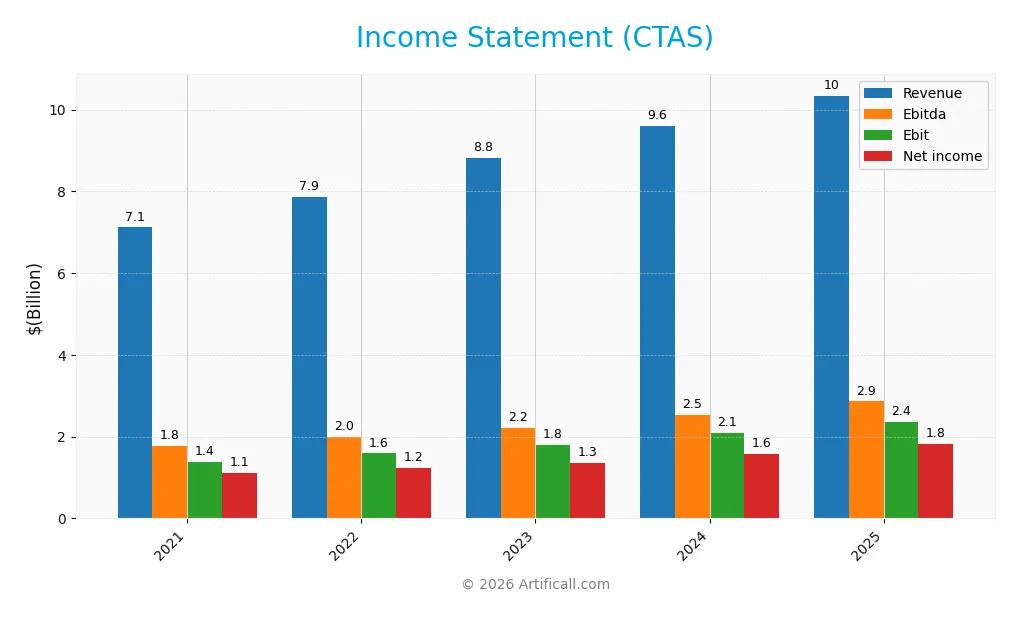
The table below presents Cintas Corporation’s key income statement figures for fiscal years 2021 through 2025, offering a clear overview of revenue, expenses, and profitability metrics.
| 2021 | 2022 | 2023 | 2024 | 2025 | |
|---|---|---|---|---|---|
| Revenue | 7.12B | 7.85B | 8.82B | 9.60B | 10.34B |
| Cost of Revenue | 3.80B | 4.22B | 4.64B | 4.91B | 5.17B |
| Operating Expenses | 1.93B | 2.04B | 2.37B | 2.62B | 2.81B |
| Gross Profit | 3.31B | 3.63B | 4.17B | 4.69B | 5.17B |
| EBITDA | 1.77B | 1.99B | 2.22B | 2.52B | 2.86B |
| EBIT | 1.39B | 1.59B | 1.80B | 2.08B | 2.37B |
| Interest Expense | 98.2M | 88.8M | 111.2M | 100.7M | 101.1M |
| Net Income | 1.11B | 1.24B | 1.35B | 1.57B | 1.81B |
| EPS | 2.63 | 2.98 | 3.30 | 3.85 | 4.48 |
| Filing Date | 2021-07-28 | 2022-07-27 | 2023-07-27 | 2024-07-25 | 2025-07-28 |
Income Statement Evolution
From 2021 to 2025, Cintas Corporation’s revenue increased by 45.3%, reaching $10.3B in 2025. Net income grew even faster by 63.1%, to $1.81B, reflecting improved profitability. Margins showed favorable trends, with gross margin at 50.0% and net margin at 17.5%, both expanding steadily. Operating expenses grew in line with revenue, supporting margin stability and EBIT margin improvement to 22.9%.
Is the Income Statement Favorable?
The 2025 income statement reveals solid fundamentals with a 7.8% revenue growth and 7.0% net margin increase year-over-year. EBITDA rose 13.6%, signaling efficient cost management despite rising expenses. Interest expense remains low at under 1% of revenue, supporting net income growth and EPS up 16.1%. Overall, 92.9% of income metrics are favorable, indicating strong earnings quality and margin resilience.
Financial Ratios
The table below presents key financial ratios of Cintas Corporation (CTAS) for the fiscal years 2021 through 2025, providing a clear overview of profitability, valuation, liquidity, leverage, and efficiency metrics:
| Ratios | 2021 | 2022 | 2023 | 2024 | 2025 |
|---|---|---|---|---|---|
| Net Margin | 16% | 16% | 15% | 16% | 18% |
| ROE | 30% | 37% | 35% | 36% | 39% |
| ROIC | 16% | 18% | 19% | 20% | 23% |
| P/E | 33.3 | 33.3 | 35.6 | 43.9 | 50.4 |
| P/B | 10.0 | 12.4 | 12.4 | 16.0 | 19.5 |
| Current Ratio | 1.01 | 1.14 | 1.49 | 1.12 | 2.09 |
| Quick Ratio | 0.76 | 0.81 | 1.08 | 0.90 | 1.82 |
| D/E | 0.74 | 0.90 | 0.69 | 0.62 | 0.57 |
| Debt-to-Assets | 32% | 35% | 30% | 28% | 27% |
| Interest Coverage | 14.1 | 17.9 | 16.2 | 20.5 | 23.3 |
| Asset Turnover | 0.83 | 0.93 | 1.00 | 1.01 | 1.05 |
| Fixed Asset Turnover | 4.79 | 5.26 | 5.60 | 5.57 | 5.51 |
| Dividend Yield | 1.22% | 0.91% | 0.94% | 0.77% | 0.67% |
Evolution of Financial Ratios
From 2021 to 2025, Cintas Corporation’s Return on Equity (ROE) showed a clear upward trend, rising from 30.13% to 38.69%, indicating improving profitability. The Current Ratio also improved significantly, moving from around 1.01 in 2021 to 2.09 in 2025, reflecting enhanced liquidity. The Debt-to-Equity Ratio trended downward from 0.74 in 2021 to 0.57 in 2025, signaling reduced leverage and more conservative financial management.
Are the Financial Ratios Favorable?
In 2025, Cintas exhibits generally favorable financial ratios, with strong profitability metrics such as a 17.53% net margin and a 38.69% ROE. Liquidity ratios are solid, with a Current Ratio of 2.09 and Quick Ratio of 1.82, supporting short-term financial health. Leverage is neutral at a 0.57 Debt-to-Equity ratio, while coverage ratios like interest coverage at 23.39 suggest low default risk. However, valuation ratios such as a Price-to-Earnings of 50.43 and Price-to-Book of 19.51 are unfavorable, and the dividend yield at 0.67% is relatively low. Overall, 64.29% of ratios are favorable, confirming a generally positive financial profile.
Shareholder Return Policy
Cintas Corporation maintains a stable dividend payout ratio of around 33-40%, with dividend per share steadily increasing from $1.08 in 2021 to $1.52 in 2025. The annual dividend yield hovers below 1.3%, supported by coverage ratios above 2x, indicating dividends are well covered by free cash flow. Share buybacks are not explicitly detailed but remain a relevant factor to monitor given the company’s solid cash flow metrics.
This disciplined distribution policy appears balanced, with dividends sustainably financed by operating and free cash flow, mitigating risks of excessive payouts. The approach supports long-term shareholder value creation by combining steady income with prudent capital management, reflecting Cintas’ financial health and operational efficiency.
Score analysis
The following radar chart presents a comprehensive view of Cintas Corporation’s key financial scores and valuation metrics:
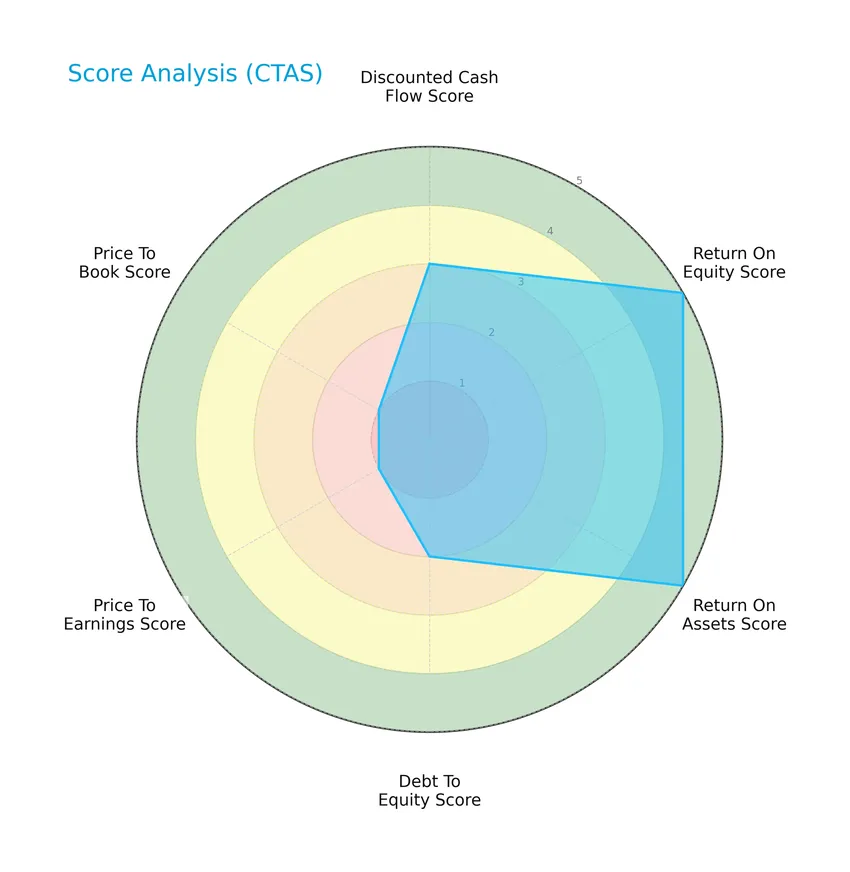
Cintas shows very favorable returns on equity and assets with scores of 5 each, indicating strong profitability and asset use. However, valuation metrics such as price-to-earnings and price-to-book scores are very unfavorable at 1, suggesting the stock may be overvalued. Debt-to-equity stands at a moderate 2, reflecting balanced leverage.
Analysis of the company’s bankruptcy risk
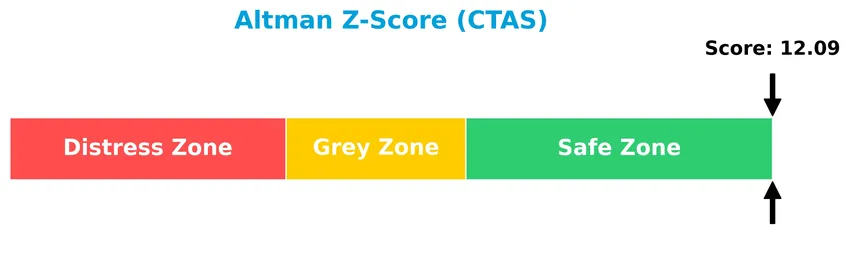
Cintas Corporation’s Altman Z-Score places it well within the safe zone, indicating a low risk of bankruptcy and solid financial stability:
Is the company in good financial health?
The Piotroski Score diagram below highlights Cintas Corporation’s strong financial health and operational efficiency:
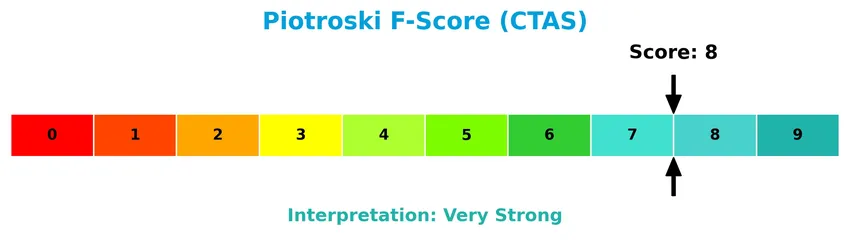
With a Piotroski Score of 8, Cintas demonstrates very strong financial strength, reflecting robust profitability, liquidity, and efficient operations, which supports its solid investment profile.
Competitive Landscape & Sector Positioning
This section presents a detailed sector analysis of Cintas Corporation, covering strategic positioning, revenue by segment, key products, main competitors, competitive advantages, and SWOT analysis. I will assess whether Cintas holds a competitive advantage relative to its industry peers.
Strategic Positioning
Cintas Corporation concentrates primarily on Uniform Rental and Facility Services, generating $7.98B in 2025, supplemented by First Aid and Safety ($1.22B) and Fire Protection Services ($817M). Its geographic exposure focuses on the US, Canada, and Latin America, reflecting a specialized service portfolio within North American markets.
Revenue by Segment
The pie chart illustrates Cintas Corporation’s revenue distribution by segment for the fiscal year 2025, highlighting the relative contributions of its key business areas.
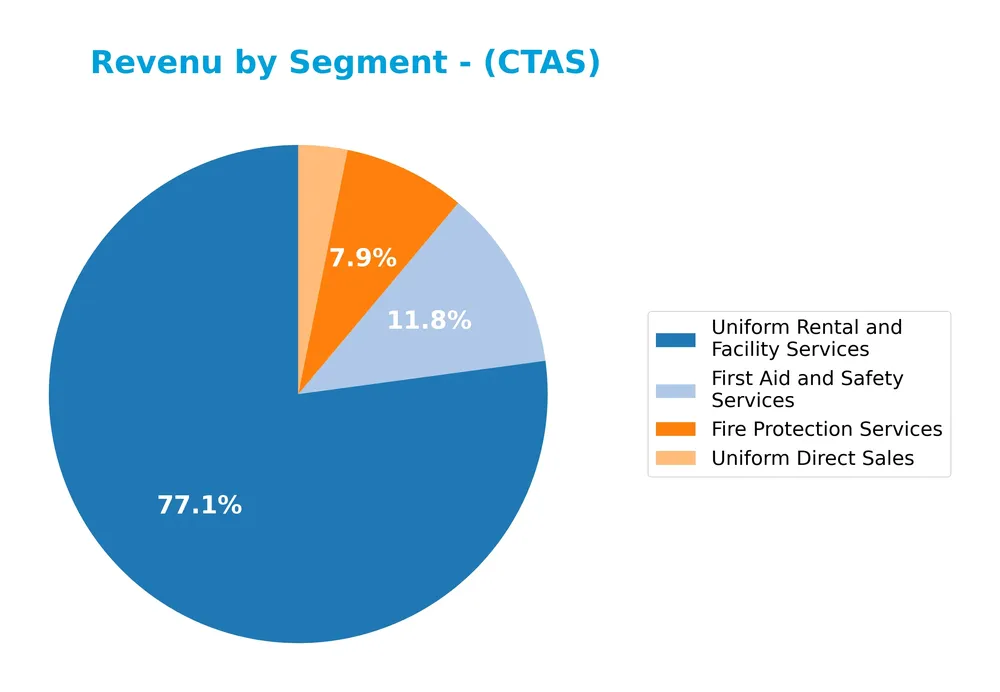
In 2025, Uniform Rental and Facility Services remained the dominant revenue driver with 7.98B, showing steady growth from previous years. First Aid and Safety Services also expanded significantly to 1.22B, indicating strengthening demand. Fire Protection Services and Uniform Direct Sales contributed smaller portions at 818M and 329M, respectively. The business shows a concentration in rental services but benefits from diversification with growing safety services.
Key Products & Brands
The table below outlines Cintas Corporation’s main products and services with brief descriptions:
| Product | Description |
|---|---|
| Uniform Rental and Facility Services | Rental and servicing of corporate uniforms, flame resistant clothing, mats, mops, shop towels, and restroom cleaning supplies. |
| First Aid and Safety Services | Provision of first aid products, safety services, and related supplies for workplace safety. |
| Fire Protection Services | Products and services focused on fire protection and safety for businesses. |
| Uniform Direct Sales | Direct sales of uniforms and related apparel to customers. |
| Other Products and Services | Additional services and products not classified under main segments, contributing to revenue. |
| Document Management | Solutions related to document handling and management (noted in earlier years). |
Cintas Corporation’s product portfolio centers on uniform rental and facility services, supplemented by first aid, fire protection, direct uniform sales, and other diverse business services. This diversified offering supports various industrial and corporate clients primarily in North America.
Main Competitors
There are 3 main competitors in the Specialty Business Services industry; the table below lists the top 3 leaders by market capitalization:
| Competitor | Market Cap. |
|---|---|
| Cintas Corporation | 74.5B |
| Thomson Reuters Corporation | 59.4B |
| Global Payments Inc. | 18.5B |
Cintas Corporation ranks 1st among its 3 competitors with a market cap 4.1% above the next leader. It stands clearly above both the average market cap of the top 10 competitors (50.8B) and the median sector market cap (59.4B). The company holds a substantial 30.6% market cap lead over its closest rival.
Comparisons with competitors
Check out how we compare the company to its competitors:
Does CTAS have a competitive advantage?
Cintas Corporation presents a clear competitive advantage, demonstrated by a very favorable moat status with a ROIC exceeding its WACC by over 14.6% and a strong upward trend in ROIC of 45.2% from 2021 to 2025. This indicates efficient capital use and durable value creation.
Looking ahead, Cintas is positioned to capitalize on growth opportunities through its diversified service segments including uniform rental, facility services, and safety products across North America. Continued innovation and expansion in these markets could support sustained profitability and competitive strength.
SWOT Analysis
This SWOT analysis highlights key internal and external factors impacting Cintas Corporation to guide strategic investment decisions.
Strengths
- strong profitability with 17.53% net margin
- durable competitive advantage reflected in growing ROIC
- solid financial health with very strong Piotroski score
Weaknesses
- high valuation multiples with PE of 50.43 and PB of 19.51
- low dividend yield at 0.67%
- moderate debt-to-equity ratio at 0.57
Opportunities
- expanding service offerings in safety and facility services
- growing demand for corporate uniforms in North America and Latin America
- potential for margin improvement via operational efficiency
Threats
- economic downturns reducing corporate spending
- rising raw material and labor costs
- intense competition in specialty business services
Cintas demonstrates robust financial strength and a durable moat, supporting continued growth. However, high valuation and moderate leverage warrant caution. Investors should balance growth prospects with valuation risks when considering Cintas for their portfolios.
Stock Price Action Analysis
The following weekly chart illustrates Cintas Corporation’s stock price fluctuations over the past 12 months, highlighting notable trend developments and price volatility:
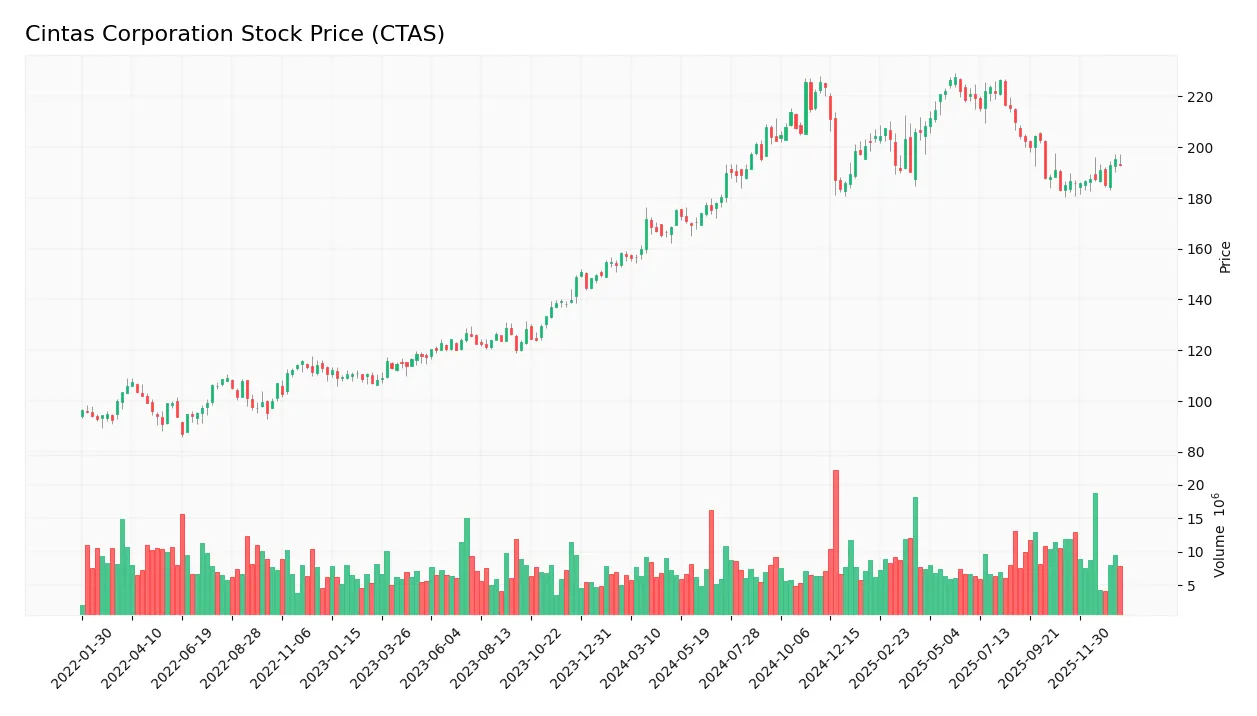
Trend Analysis
Over the past 12 months, CTAS stock increased by 22.83%, indicating a bullish trend with acceleration. The price ranged from a low of 156.34 to a high of 227.66, supported by a high volatility level with an 18.35 standard deviation. The recent 2.5-month period shows continued positive momentum with a 4.26% gain and moderate volatility at 3.44.
Volume Analysis
In the last three months, trading volume has been increasing, with a total of 114M shares traded. Buyer volume dominates at 78.29%, reflecting strong buyer-driven activity. This rising volume with buyer dominance suggests robust investor interest and positive market participation in CTAS stock.
Target Prices
Analysts present a confident target consensus for Cintas Corporation’s stock price.
| Target High | Target Low | Consensus |
|---|---|---|
| 245 | 184 | 217.5 |
The target prices suggest a positive outlook, with analysts expecting Cintas shares to trade between $184 and $245, centering around $217.5.

Don’t Let Luck Decide Your Entry Point
Optimize your entry points with our advanced ProRealTime indicators. You’ll get efficient buy signals with precise price targets for maximum performance. Start outperforming now!
Analyst & Consumer Opinions
This section examines recent analyst ratings and consumer feedback concerning Cintas Corporation (CTAS) performance and reputation.
Stock Grades
Here are the latest verified stock grades for Cintas Corporation from recognized financial institutions:
| Grading Company | Action | New Grade | Date |
|---|---|---|---|
| Wells Fargo | Upgrade | Overweight | 2026-01-14 |
| Citigroup | Maintain | Sell | 2025-12-22 |
| UBS | Maintain | Buy | 2025-12-19 |
| Baird | Maintain | Neutral | 2025-12-19 |
| Wells Fargo | Maintain | Equal Weight | 2025-12-19 |
| RBC Capital | Maintain | Sector Perform | 2025-12-19 |
| Morgan Stanley | Maintain | Equal Weight | 2025-12-17 |
| Wells Fargo | Maintain | Equal Weight | 2025-11-25 |
| Citigroup | Maintain | Sell | 2025-09-26 |
| RBC Capital | Maintain | Sector Perform | 2025-09-25 |
The overall trend shows mostly neutral to hold-oriented grades, with Wells Fargo recently upgrading to Overweight, indicating some positive sentiment amid otherwise cautious stances. The consensus remains broadly balanced between buy and hold positions with few sell ratings.
Consumer Opinions
Consumer sentiment around Cintas Corporation (CTAS) reflects a generally positive view of its product quality and customer service, though some concerns remain regarding pricing and delivery times.
| Positive Reviews | Negative Reviews |
|---|---|
| “Excellent uniform quality and durable materials.” | “Pricing feels a bit high compared to competitors.” |
| “Responsive customer service that resolves issues quickly.” | “Occasional delays in delivery affect operations.” |
| “Wide range of products meets all our business needs.” | “Some products are not as customizable as expected.” |
Overall, consumers appreciate Cintas for its reliable quality and strong customer support but often mention pricing and occasional logistical delays as areas for improvement.
Risk Analysis
Below is a concise overview of key risks associated with investing in Cintas Corporation (CTAS), focusing on their likelihood and potential impact:
| Category | Description | Probability | Impact |
|---|---|---|---|
| Valuation Risk | High P/E ratio (50.43) and P/B ratio (19.51) suggest overvaluation, increasing downside risk. | High | High |
| Market Volatility | Beta near 1 (0.972) indicates stock price moves close to market swings, affecting returns. | Moderate | Moderate |
| Competitive Pressure | Specialty Business Services is competitive; pricing power and innovation are critical. | Moderate | Moderate |
| Economic Sensitivity | Economic downturns could reduce demand for corporate uniforms and services. | Moderate | Moderate |
| Dividend Yield Risk | Low dividend yield (0.67%) may not attract income-focused investors, affecting demand. | Low | Low |
| Leverage & Debt | Moderate debt-to-equity ratio (0.57) with strong interest coverage reduces financial distress risk. | Low | Low |
Cintas shows strong financial health with a safe Altman Z-Score (12.09) and very strong Piotroski Score (8), minimizing bankruptcy risk. However, valuation risk stands out as the most significant concern due to the elevated P/E and P/B ratios. Investors should weigh this against the company’s favorable profitability and liquidity metrics in their risk management strategies.
Should You Buy Cintas Corporation?
Cintas Corporation appears to be in a very favorable position with durable competitive advantages and growing operational efficiency, supported by strong value creation and a manageable leverage profile; its overall B rating suggests a moderate risk-return profile for investors.
Strength & Efficiency Pillars
Cintas Corporation exhibits robust profitability with a net margin of 17.53% and a return on equity (ROE) of 38.69%, underpinning its operational efficiency. The company’s return on invested capital (ROIC) stands at 22.95%, significantly exceeding its weighted average cost of capital (WACC) of 8.26%, confirming Cintas as a clear value creator. Financial health metrics further reinforce this strength: an Altman Z-score of 12.09 places it well within the safe zone, while a Piotroski score of 8 indicates very strong financial fundamentals. These factors collectively demonstrate durable competitive advantages and efficient capital deployment.
Weaknesses and Drawbacks
Despite its operational strengths, Cintas faces valuation challenges with a price-to-earnings (P/E) ratio of 50.43 and a price-to-book (P/B) ratio of 19.51, both signaling a premium valuation that may heighten downside risk if earnings growth slows. Although leverage ratios are moderate—the debt-to-equity ratio is 0.57 and the current ratio is a healthy 2.09—investors should be cautious as high multiples can limit upside in volatile markets. Additionally, the dividend yield is low at 0.67%, which might be unattractive for income-focused investors seeking stable cash returns.
Our Verdict about Cintas Corporation
Cintas’s long-term fundamental profile appears favorable, underpinned by strong profitability, effective capital use, and solid financial health. Coupled with a bullish overall stock trend and strong buyer dominance in the recent period (78.29%), the company may appear attractive for long-term exposure. However, its elevated valuation metrics suggest that investors could consider a cautious, measured approach, monitoring for potential market corrections or better entry points to manage valuation risk effectively.
Disclaimer: This content is for informational purposes only and does not constitute financial, investment, or other professional advice. Investing in financial markets involves a significant risk of loss, and past performance is not indicative of future results.
Additional Resources
- Cintas Corporation (CTAS): A Bull Case Theory – Yahoo Finance (Jan 20, 2026)
- Vest Financial LLC Lowers Holdings in Cintas Corporation $CTAS – MarketBeat (Jan 21, 2026)
- Cintas Corp (NASDAQ:CTAS) Passes the “Caviar Cruise” Quality Investing Screen – Chartmill (Jan 21, 2026)
- Cintas (CTAS) Maintains Quarterly Dividend at $0.45 per Share – GuruFocus (Jan 20, 2026)
- Cintas Corp. (CTAS) Declares $0.45 Quarterly Dividend; 0.9% Yield – StreetInsider (Jan 20, 2026)
For more information about Cintas Corporation, please visit the official website: cintas.com