Home > Analyses > Financial Services > Cincinnati Financial Corporation
Cincinnati Financial Corporation underpins the safety net for countless businesses and families across the U.S. It crafts tailored property and casualty insurance solutions that protect assets and livelihoods. Known for steady innovation and disciplined underwriting, Cincinnati balances risk with opportunity in a competitive sector. As the insurance landscape evolves, I question whether Cincinnati’s solid fundamentals still justify its premium valuation and growth prospects in 2026.

Table of contents
Business Model & Company Overview
Cincinnati Financial Corporation, founded in 1950 and headquartered in Fairfield, Ohio, stands as a dominant player in the U.S. property and casualty insurance sector. Its ecosystem spans Commercial and Personal Lines Insurance, Excess and Surplus Lines, Life Insurance, and strategic Investments. These interconnected segments deliver comprehensive risk management solutions that serve businesses and individuals alike, reinforcing its robust market position.
The company’s revenue engine balances premium income from insurance policies with returns from fixed-maturity and equity investments. It leverages diversified streams across Commercial, Personal, and Life insurance, supported by brokerage and leasing services. Cincinnati’s footprint extends across the Americas, with growing influence in key commercial hubs. Its deep underwriting expertise and capital strength create a formidable economic moat, shaping the future of insurance risk management.
Financial Performance & Fundamental Metrics
I will analyze Cincinnati Financial Corporation’s income statement, key financial ratios, and dividend payout policy to assess its fundamental strength and shareholder value.
Income Statement
The table below presents Cincinnati Financial Corporation’s key income statement figures over the past five fiscal years, reflecting revenue growth and profitability trends.

| 2021 | 2022 | 2023 | 2024 | 2025 | |
|---|---|---|---|---|---|
| Revenue | 9.63B | 6.56B | 10.01B | 11.34B | 12.63B |
| Cost of Revenue | 3.91B | 5.02B | 5.27B | 5.74B | 6.30B |
| Operating Expenses | 2.02B | 2.24B | 2.46B | 2.74B | 3.37B |
| Gross Profit | 5.72B | 1.54B | 4.74B | 5.60B | 6.33B |
| EBITDA | 3.87B | -514M | 2.44B | 3.04B | 3.03B |
| EBIT | 3.75B | -641M | 2.33B | 2.91B | 3.03B |
| Interest Expense | 53M | 53M | 54M | 53M | 5.3M |
| Net Income | 2.97B | -487M | 1.84B | 2.29B | 2.39B |
| EPS | 18.30 | -3.06 | 11.74 | 14.65 | 15.17 |
| Filing Date | 2022-02-24 | 2023-02-23 | 2024-02-26 | 2025-02-24 | 2026-02-23 |
Income Statement Evolution
Cincinnati Financial’s revenue rose steadily from $9.6B in 2021 to $12.6B in 2025, marking a 31% increase over five years. Gross margin remained strong at about 50%, reflecting stable cost control. However, net income declined overall, with margins shrinking by nearly 39%, indicating pressure on profitability despite top-line growth.
Is the Income Statement Favorable?
In 2025, fundamentals show mixed signals. Revenue grew 11.4%, but operating expenses rose at the same pace, limiting EBIT growth to 4.2%. The net margin fell by 6.3%, though EPS improved 4.4%. Interest expense remains minimal at 0.04%. Overall, the income statement is favorable but shows emerging challenges in margin preservation.
Financial Ratios
The following table summarizes key financial ratios for Cincinnati Financial Corporation over the last five fiscal years:
| Ratios | 2021 | 2022 | 2023 | 2024 | 2025 |
|---|---|---|---|---|---|
| Net Margin | 31% | -7% | 18% | 20% | 19% |
| ROE | 23% | -5% | 15% | 16% | 15% |
| ROIC | 10% | -10% | 74% | 92% | 4% |
| P/E | 6.2 | -33.4 | 8.9 | 9.8 | 10.8 |
| P/B | 1.40 | 1.54 | 1.35 | 1.61 | 1.62 |
| Current Ratio | 0.61 | 0 | 0 | 0 | 1.66 |
| Quick Ratio | 0.61 | 0 | 0 | 0 | 1.66 |
| D/E | 0.07 | 0.08 | 0.07 | 0.06 | 0.06 |
| Debt-to-Assets | 3% | 3% | 3% | 2% | 2% |
| Interest Coverage | 70 | -13 | 42 | 54 | 560 |
| Asset Turnover | 0.31 | 0.22 | 0.31 | 0.31 | 0.31 |
| Fixed Asset Turnover | 47 | 32 | 48 | 53 | 58 |
| Dividend Yield | 2.2% | 2.6% | 2.8% | 2.2% | 2.0% |
Evolution of Financial Ratios
From 2021 to 2025, Cincinnati Financial’s Return on Equity (ROE) showed a recovery from a low point in 2022 to a stable 15.04% in 2025. The Current Ratio improved significantly to 1.66 in 2025, indicating better short-term liquidity. The Debt-to-Equity Ratio declined steadily, reaching a low 0.06 in 2025, reflecting conservative leverage and enhanced financial stability.
Are the Financial Ratios Fovorable?
In 2025, profitability metrics such as net margin (18.95%) and ROE (15.04%) are favorable, supported by a strong return on invested capital (402.18%) above the WACC (6.51%). Liquidity ratios (current and quick at 1.66) and low debt ratios (debt-to-equity 0.06, debt-to-assets 2.16%) signal solid financial health. Asset turnover (0.31) is the sole unfavorable metric, while price-to-book (1.62) is neutral. Overall, 85.71% of ratios are favorable, indicating a very favorable financial profile.
Shareholder Return Policy
Cincinnati Financial Corporation maintains a consistent dividend payout ratio near 22%, with dividends per share rising steadily to $3.33 in 2025. The annual dividend yield hovers around 2%, supported by free cash flow coverage and moderate share buybacks, reflecting prudent capital allocation.
This distribution approach balances shareholder income with financial stability. The payout ratio and cash flow coverage indicate sustainable dividends without excessive repurchases. Such a policy aligns with long-term value creation, mitigating risks of unsustainable distributions or capital strain.
Score analysis
Below is a radar chart illustrating Cincinnati Financial Corporation’s key financial scores:

The company scores very favorable in discounted cash flow and return on assets, favorable in return on equity and debt to equity, moderate in price to earnings, but unfavorable in price to book metrics.
Analysis of the company’s bankruptcy risk
Cincinnati Financial Corporation’s Altman Z-Score places it in the distress zone, indicating a high risk of financial distress:

Is the company in good financial health?
The Piotroski Score diagram highlights Cincinnati Financial Corporation’s solid financial strength:

With a Piotroski Score of 7, the company demonstrates strong financial health, reflecting effective profitability, leverage, and efficiency metrics.
Competitive Landscape & Sector Positioning
This section analyzes Cincinnati Financial Corporation’s strategic positioning, revenue segments, key products, competitors, and strengths. I will assess whether the company holds a competitive advantage over its industry peers.
Strategic Positioning
Cincinnati Financial Corporation concentrates on U.S. property and casualty insurance with diversified product lines, including commercial, personal, excess and surplus, and life insurance. Its broad portfolio balances risk across segments, emphasizing commercial lines which generated $4.87B in 2025 revenue, reflecting focused but varied exposure within insurance.
Revenue by Segment
This pie chart illustrates Cincinnati Financial Corporation’s revenue distribution by insurance product lines for the fiscal year 2025.
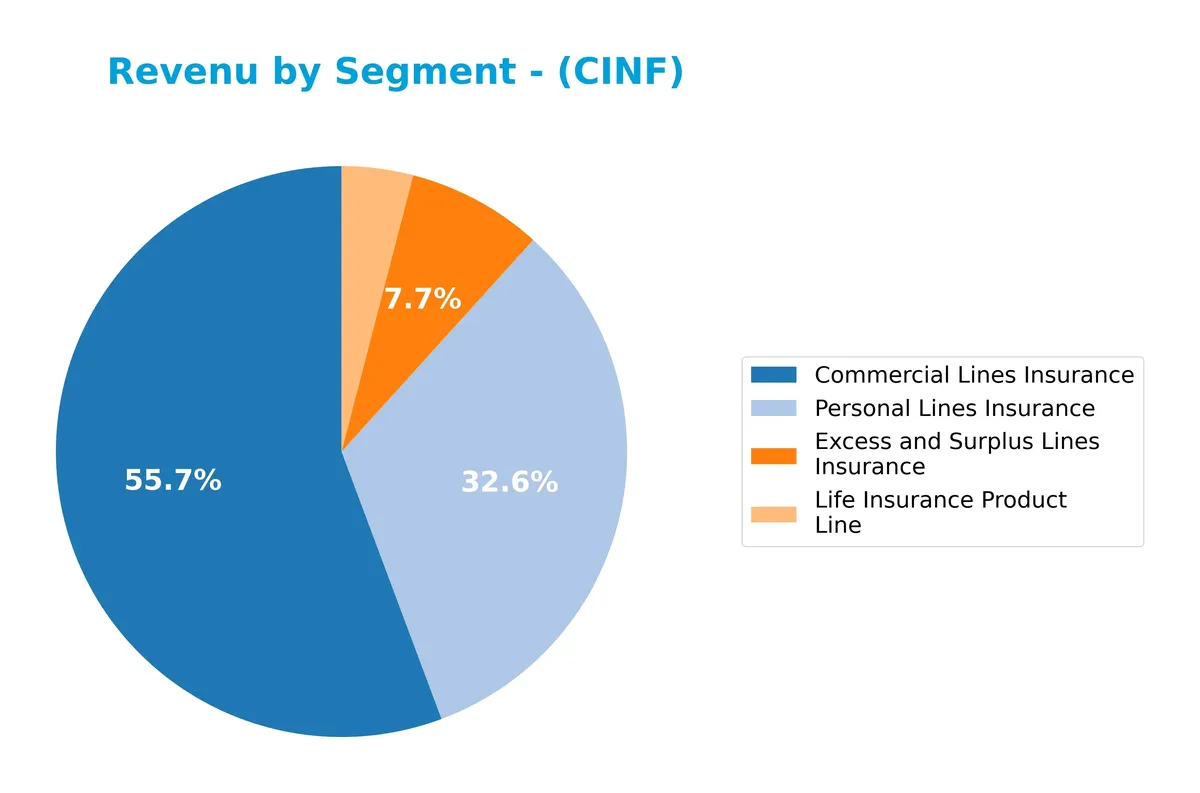
Commercial Lines Insurance dominates with $4.87B, reflecting steady growth since 2021. Personal Lines Insurance follows at $3.20B, showing notable acceleration over recent years. Excess and Surplus Lines Insurance and Life Insurance Product Line contribute $702M and $336M, respectively, maintaining steady but smaller shares. The 2025 figures emphasize strong diversification with commercial and personal lines as primary growth engines.
Key Products & Brands
The table below summarizes Cincinnati Financial Corporation’s main products and brands by line of business:
| Product | Description |
|---|---|
| Commercial Lines Insurance | Covers commercial casualty, property, auto, workers’ compensation, liability, surety bonds, and equipment coverage. |
| Personal Lines Insurance | Offers personal auto, homeowner, dwelling fire, inland marine, umbrella liability, and watercraft insurance. |
| Excess and Surplus Lines Insurance | Provides commercial casualty and property insurance for businesses, covering liability and property risks. |
| Life Insurance Product Line | Includes term, universal, whole life, and worksite life insurance products. |
| Investments Segment | Invests in fixed-maturity bonds, preferred stocks, and equities to support underwriting and company operations. |
Cincinnati Financial’s portfolio spans commercial and personal property-casualty insurance, supplemented by life insurance and investment activities. Commercial lines dominate revenue, reflecting the company’s focus on business insurance solutions.
Main Competitors
There are 7 competitors in the Insurance – Property & Casualty industry; below is the list of the top 7 leaders by market capitalization:
| Competitor | Market Cap. |
|---|---|
| The Progressive Corporation | 124B |
| Chubb Limited | 124B |
| The Travelers Companies, Inc. | 64B |
| The Allstate Corporation | 54B |
| W. R. Berkley Corporation | 26B |
| Cincinnati Financial Corporation | 25B |
| Loews Corporation | 22B |
Cincinnati Financial Corporation ranks 6th among its competitors, holding about 20% of the market cap of the leader, The Progressive Corporation. It sits below both the average market cap of the top 10 (63B) and the sector median (54B). The company is 4.99% smaller than its nearest competitor above, W. R. Berkley Corporation, indicating a narrow but meaningful gap.
Comparisons with competitors
Check out how we compare the company to its competitors:
Does Cincinnati Financial Corporation have a competitive advantage?
Cincinnati Financial demonstrates a sustainable competitive advantage, supported by a very favorable moat rating. Its ROIC exceeds WACC by nearly 396%, indicating efficient capital use and consistent value creation. Historically in insurance, such a high ROIC margin signals strong pricing power and operational discipline.
Looking ahead, Cincinnati Financial’s diverse product segments—commercial, personal, excess and surplus lines, and life insurance—offer opportunities for growth. Expansion in specialized insurance markets and leveraging investments could sustain its profitability amid evolving industry risks.
SWOT Analysis
This analysis identifies Cincinnati Financial Corporation’s key strategic factors to inform investment decisions.
Strengths
- strong ROIC well above WACC
- diversified insurance segments
- low debt and high interest coverage
Weaknesses
- declining net margin over period
- low Altman Z-score indicating financial distress risk
- moderate asset turnover
Opportunities
- growing revenue and gross profit
- expanding demand for specialty insurance
- potential to leverage investment segment
Threats
- intense competition in P&C insurance
- regulatory changes impacting underwriting
- economic downturn affecting premiums and claims
Cincinnati Financial’s strong capital allocation and diversified portfolio create durable value. However, margin erosion and financial distress signals warrant caution. Strategy should focus on margin recovery and risk mitigation.
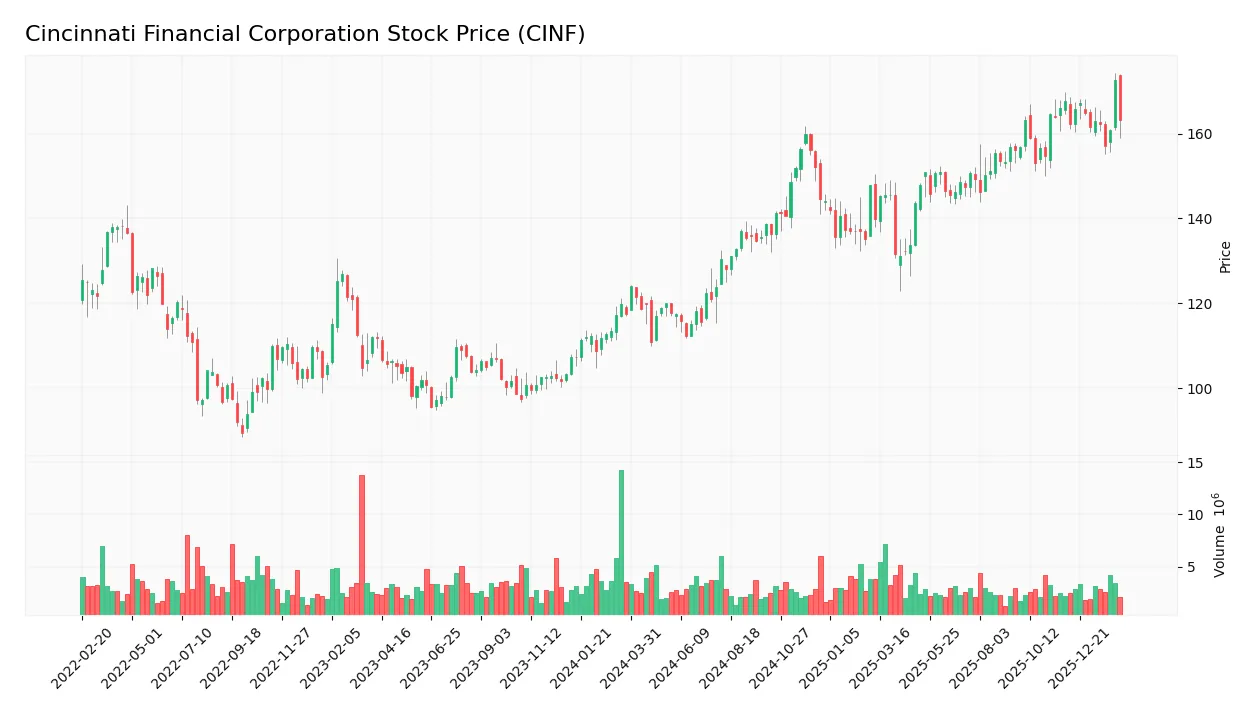
Stock Price Action Analysis
The weekly stock chart for Cincinnati Financial Corporation displays price movements over the past 100 weeks, highlighting key highs and lows:
Trend Analysis
Over the past 100 weeks, CINF’s stock price rose 32.41%, indicating a bullish trend despite deceleration. Price volatility is notable with a 15.33 standard deviation. The highest price reached 172.65, the lowest 110.88. Recent three-month trend shows a -2.98% decline, signaling a short-term bearish slope.
Volume Analysis
In the last three months, trading volume decreased with buyer volume at 19.8M and seller volume at 14.6M. Buyers hold 57.45% dominance, suggesting slightly buyer-driven activity. Declining volume indicates cautious investor participation amid recent price weakness.
Target Prices
Analysts present a confident target price consensus for Cincinnati Financial Corporation.
| Target Low | Target High | Consensus |
|---|---|---|
| 157 | 175 | 166 |
The target range indicates moderate upside potential, reflecting analysts’ positive but cautious outlook on CINF’s growth prospects.

Don’t Let Luck Decide Your Entry Point
Optimize your entry points with our advanced ProRealTime indicators. You’ll get efficient buy signals with precise price targets for maximum performance. Start outperforming now!
Analyst & Consumer Opinions
This section reviews Cincinnati Financial Corporation’s recent analyst ratings and consumer feedback to assess market sentiment.
Stock Grades
Below is a summary of recent verified analyst grades for Cincinnati Financial Corporation from established grading firms:
| Grading Company | Action | New Grade | Date |
|---|---|---|---|
| Keefe, Bruyette & Woods | Maintain | Outperform | 2026-01-06 |
| Piper Sandler | Maintain | Neutral | 2025-12-22 |
| Keefe, Bruyette & Woods | Maintain | Outperform | 2025-11-04 |
| B of A Securities | Maintain | Buy | 2025-10-28 |
| B of A Securities | Maintain | Buy | 2025-10-13 |
| Keefe, Bruyette & Woods | Maintain | Outperform | 2025-10-06 |
| Keefe, Bruyette & Woods | Maintain | Outperform | 2025-08-05 |
| Roth Capital | Maintain | Buy | 2025-07-29 |
| Keefe, Bruyette & Woods | Maintain | Outperform | 2025-07-09 |
| Keefe, Bruyette & Woods | Maintain | Outperform | 2025-04-09 |
The overall trend shows consistent positive sentiment with multiple “Outperform” and “Buy” grades maintained across the last year. Piper Sandler’s “Neutral” stance is the sole exception, indicating some divergence in analyst views.
Consumer Opinions
Cincinnati Financial Corporation evokes a mix of admiration and caution among its customers.
| Positive Reviews | Negative Reviews |
|---|---|
| Responsive customer service with knowledgeable agents. | Claims processing can be slow during peak periods. |
| Strong financial stability inspires trust. | Limited online tools compared to competitors. |
| Competitive premiums with flexible policy options. | Communication on policy changes can be unclear. |
Overall, customers praise Cincinnati Financial for its solid financial footing and attentive service. However, delays in claims and digital platform limitations emerge as consistent concerns.
Risk Analysis
Below is a summary table outlining key risks for Cincinnati Financial Corporation (CINF):
| Category | Description | Probability | Impact |
|---|---|---|---|
| Financial Health | Altman Z-score at 1.74 signals distress zone, indicating elevated bankruptcy risk. | Medium | High |
| Valuation | Price-to-Book ratio is unfavorable at 1.62, suggesting potential overvaluation. | Medium | Medium |
| Operational Efficiency | Asset turnover is low at 0.31, signaling underutilized assets and growth constraints. | Medium | Medium |
| Market Volatility | Beta of 0.65 implies lower volatility but may underperform in bullish cycles. | Low | Low |
| Industry Risk | Property & casualty insurance is cyclical and sensitive to catastrophic events. | Medium | High |
I emphasize the Altman Z-score risk, as it places CINF in the distress zone despite strong profitability metrics. This suggests potential financial strain not evident in ROE or margin. Additionally, the low asset turnover limits growth potential, a common issue in mature insurers. Investors should weigh these risks against the firm’s solid capital allocation and favorable WACC of 6.5%.
Should You Buy Cincinnati Financial Corporation?
Cincinnati Financial appears to be a robust value creator with a very favorable competitive moat, evidenced by growing ROIC well above WACC. While its leverage profile seems manageable, the Altman Z-Score suggests caution; overall, it holds an A rating reflecting solid operational efficiency.
Strength & Efficiency Pillars
Cincinnati Financial Corporation delivers robust profitability with a net margin of 18.95% and a return on equity of 15.04%. Its return on invested capital (ROIC) stands at an extraordinary 402.18%, vastly exceeding its weighted average cost of capital (WACC) of 6.51%, confirming the company as a clear value creator. Operational efficiency shines through a favorable EBIT margin of 24.01% and minimal interest expense at 0.04%. These metrics highlight a firm with strong operational control and a sustainable competitive advantage.
Weaknesses and Drawbacks
The company is in financial distress, with an Altman Z-Score of 1.74, placing it in the Distress Zone and signaling a heightened risk of bankruptcy. This solvency concern overshadows other positives despite a moderate P/E of 10.77 and a neutral P/B ratio of 1.62. While leverage remains low (debt-to-equity at 0.06) and liquidity ratios are healthy (current ratio 1.66), the distress signal demands caution. Additionally, asset turnover is unfavorable at 0.31, indicating inefficient asset use relative to peers.
Our Final Verdict about Cincinnati Financial Corporation
Despite Cincinnati Financial’s operational strengths and value-creating profile, its Altman Z-Score in the Distress Zone renders the investment highly speculative. The solvency risk introduces significant uncertainty that may outweigh profitability benefits. Conservative investors might consider this profile too risky, and even bullish long-term trends do not mitigate the immediate financial health concerns. This stock suggests a cautious stance until the solvency risk subsides.
Disclaimer: This content is for informational purposes only and does not constitute financial, investment, or other professional advice. Investing in financial markets involves a significant risk of loss, and past performance is not indicative of future results.
Additional Resources
- Decoding Cincinnati Financial Corp (CINF): A Strategic SWOT Insi – GuruFocus (Feb 24, 2026)
- CINCINNATI FINANCIAL CORP SEC 10-K Report – TradingView (Feb 23, 2026)
- Cincinnati Financial a Top Ranked SAFE Dividend Stock With 2.3% Yield (CINF) – Nasdaq (Feb 23, 2026)
- Vanguard Group Inc. Raises Position in Cincinnati Financial Corporation $CINF – MarketBeat (Feb 19, 2026)
- Do Wall Street Analysts Like Cincinnati Financial Stock? – Yahoo Finance (Feb 19, 2026)
For more information about Cincinnati Financial Corporation, please visit the official website: cinfin.com