Home > Analyses > Healthcare > Cigna Corporation
Cigna shapes how millions access healthcare by integrating insurance with innovative health services. It leads the Medical – Healthcare Plans industry with flagship offerings like Medicare Advantage and coordinated care through its Evernorth segment. Cigna’s blend of comprehensive coverage and technology-driven solutions sets a high bar for quality and efficiency. As healthcare evolves, I ask: does Cigna’s robust model still justify its premium valuation and growth outlook?

Table of contents
Business Model & Company Overview
Cigna Corporation, founded in 1792 and headquartered in Bloomfield, Connecticut, stands as a leader in the Medical – Healthcare Plans industry. It operates a comprehensive ecosystem spanning insurance and health services that connects individuals, employers, and government entities. With 71K employees, Cigna integrates medical, pharmacy, behavioral health, and vision coverage into a unified platform, reinforcing its dominant market position in the US and beyond.
Cigna’s revenue engine balances traditional insurance products with Evernorth’s coordinated health services, including benefits management and care delivery. Its global footprint spans the Americas, Europe, and Asia, serving insured, self-insured, and Medicare populations. This diversified model fuels recurring revenue streams from multiple channels, creating a robust economic moat that positions Cigna as a pivotal force shaping healthcare’s future.
Financial Performance & Fundamental Metrics
I analyze Cigna Corporation’s income statement, key financial ratios, and dividend payout policy to assess its core financial health and shareholder value.
Income Statement
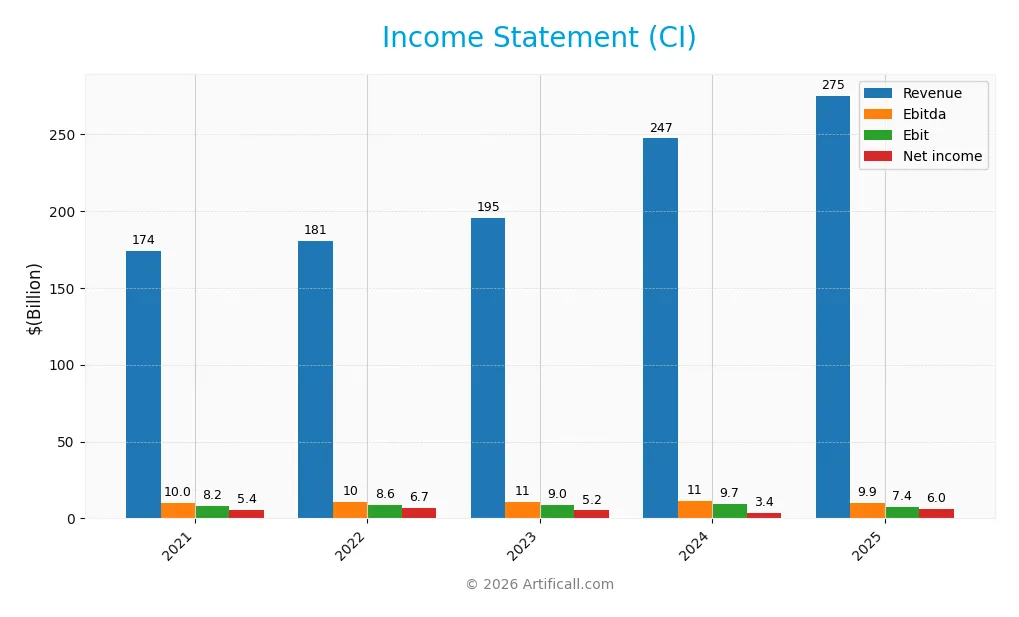
The following table presents Cigna Corporation’s key income statement figures over the last five fiscal years, highlighting revenue growth and profitability trends.
| 2021 | 2022 | 2023 | 2024 | 2025 | |
|---|---|---|---|---|---|
| Revenue | 174.1B | 180.5B | 195.3B | 247.1B | 275.0B |
| Cost of Revenue | 151.1B | 157.0B | 170.1B | 221.2B | 249.0B |
| Operating Expenses | 15.0B | 15.1B | 16.6B | 16.5B | 16.9B |
| Gross Profit | 22.9B | 23.5B | 25.2B | 25.9B | 26.0B |
| EBITDA | 10.0B | 10.4B | 10.8B | 11.4B | 12.2B |
| EBIT | 8.2B | 8.6B | 9.0B | 9.7B | 9.5B |
| Interest Expense | 1.2B | 1.2B | 1.4B | 1.4B | 1.4B |
| Net Income | 5.4B | 6.7B | 5.2B | 3.4B | 6.0B |
| EPS | 15.89 | 21.66 | 17.57 | 12.25 | 22.30 |
| Filing Date | 2022-02-24 | 2023-02-23 | 2024-02-29 | 2025-02-27 | 2026-02-26 |
Income Statement Evolution
From 2021 to 2025, Cigna’s revenue rose significantly by 58%, reaching $275B in 2025. Net income grew modestly by 11%, totaling $6B. Gross profit remained stable around $26B, keeping gross margin neutral at 9.45%. EBIT margin held steady near 3.5%, despite a slight 1.6% EBIT decline in 2025, indicating margin pressures amid rising revenues.
Is the Income Statement Favorable?
The 2025 income statement shows mixed signals. Revenue grew 11.3%, and net margin expanded sharply by 56%, boosting EPS by 83%. Interest expense is favorable at 0.5% of revenue, supporting profitability. However, EBIT declined slightly, and gross profit growth was flat. Overall, fundamentals lean favorable, reflecting strong top-line growth and improving bottom-line efficiency.
Financial Ratios
The following table presents key financial ratios for Cigna Corporation over the last five fiscal years, illustrating performance trends and financial health:
| Ratios | 2021 | 2022 | 2023 | 2024 | 2025 |
|---|---|---|---|---|---|
| Net Margin | 3.1% | 3.7% | 2.6% | 1.4% | 2.2% |
| ROE | 11.4% | 14.9% | 11.2% | 8.4% | 14.3% |
| ROIC | 5.6% | 6.5% | 7.8% | 6.7% | 7.4% |
| P/E | 14.5 | 15.5 | 17.2 | 22.5 | 12.3 |
| P/B | 1.6 | 2.3 | 1.9 | 1.9 | 1.8 |
| Current Ratio | 0.83 | 0.73 | 0.77 | 0.84 | 0.85 |
| Quick Ratio | 0.74 | 0.61 | 0.65 | 0.73 | 0.72 |
| D/E | 0.73 | 0.70 | 0.67 | 0.78 | 0.75 |
| Debt-to-Assets | 22.1% | 21.9% | 20.2% | 20.5% | 19.9% |
| Interest Coverage | 6.6 | 6.9 | 5.9 | 6.6 | 6.6 |
| Asset Turnover | 1.12 | 1.25 | 1.28 | 1.59 | 1.74 |
| Fixed Asset Turnover | 105 | 139 | 223 | 298 | 75 |
| Dividend Yield | 1.7% | 1.3% | 1.6% | 2.0% | 2.2% |
Evolution of Financial Ratios
From 2021 to 2025, Cigna’s Return on Equity (ROE) showed fluctuations, peaking near 15% and settling at 14.3% in 2025, indicating moderate profitability stability. The Current Ratio remained below 1.0 throughout, reflecting persistent liquidity constraints. Debt-to-Equity Ratio held steady around 0.7 to 0.75, suggesting consistent leverage without major shifts in financial risk.
Are the Financial Ratios Favorable?
In 2025, profitability metrics like net margin (2.17%) appear unfavorable despite a neutral ROE. Liquidity ratios (current and quick) are weak, signaling short-term cash flow concerns. Leverage ratios, including debt-to-assets (19.9%) and interest coverage (6.9x), are favorable, supporting manageable debt levels. Asset turnover and dividend yield also rate positively. Overall, the ratio profile is slightly favorable with key liquidity risks noted.
Shareholder Return Policy
Cigna Corporation pays consistent dividends, with a payout ratio around 27%, supporting a 2.2% annual yield as of 2025. Dividend coverage by free cash flow remains solid, and the company maintains share buybacks, balancing distributions with capital expenditure needs.
This approach aligns with sustainable long-term value creation, given stable net margins and prudent leverage. Risks include potential pressure on cash flows if earnings weaken, but current policy reflects disciplined capital allocation supporting shareholder returns.
Score analysis
The radar chart below highlights Cigna Corporation’s key financial scores across valuation, profitability, and leverage metrics:
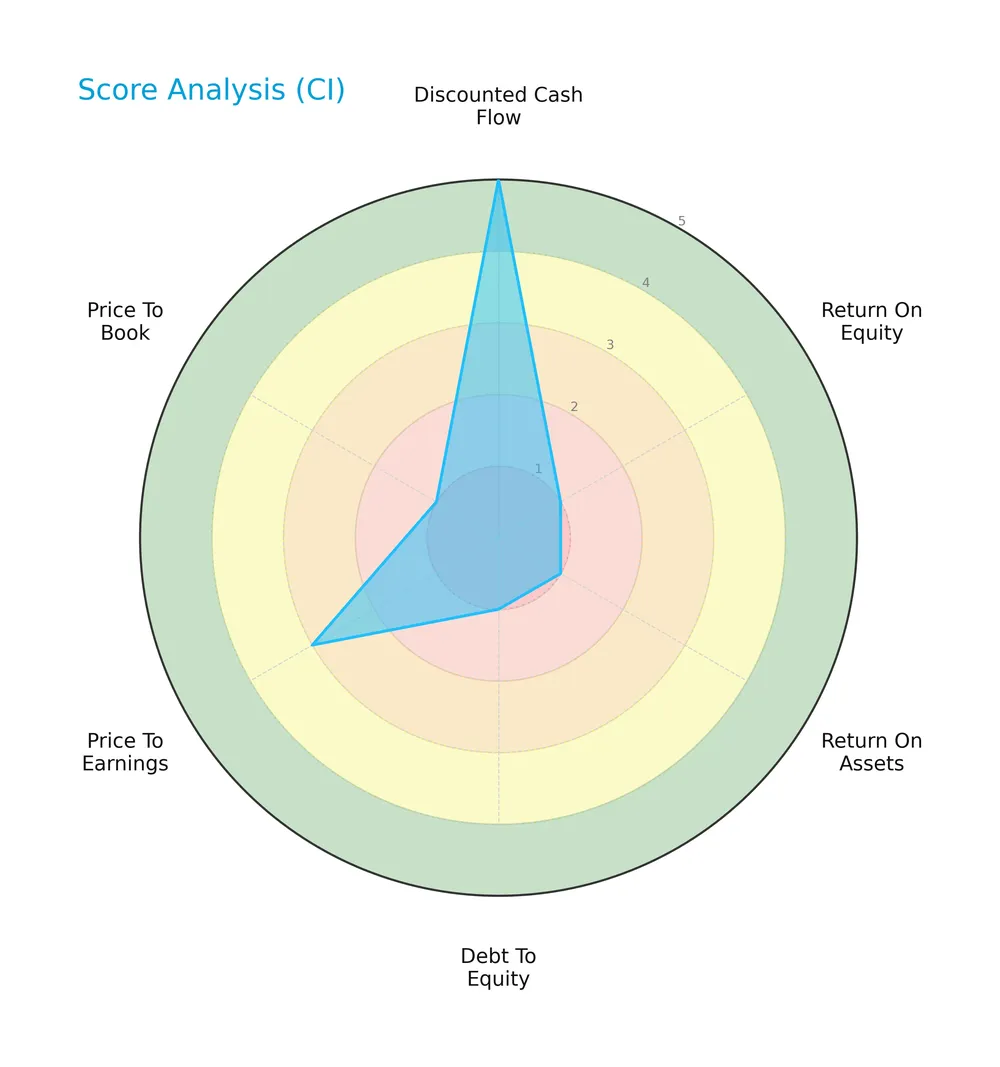
Cigna scores very favorably in discounted cash flow (5) and shows favorable returns on equity (4) and assets (4). However, its debt-to-equity score is very unfavorable (1), signaling leverage concerns. Valuation multiples (PE and PB) are moderate at 3 each.
Analysis of the company’s bankruptcy risk
Cigna’s Altman Z-Score at 2.70 places it in the grey zone, indicating moderate bankruptcy risk but not immediate distress:

Is the company in good financial health?
The Piotroski Score diagram below illustrates Cigna’s strong financial health based on profitability, leverage, and efficiency criteria:

With a Piotroski Score of 7, Cigna demonstrates solid financial strength. This score reflects above-average operational performance and prudent capital management, positioning the company well among peers.
Competitive Landscape & Sector Positioning
This sector analysis will examine Cigna Corporation’s strategic positioning, revenue streams, and key products. I will assess its main competitors and identify competitive advantages. The goal is to determine whether Cigna holds a sustainable edge over its peers.
Strategic Positioning
Cigna Corporation concentrates its revenue in two main segments: Evernorth, with $235B in 2025, and Cigna Healthcare, generating $47B. Its geographic exposure centers almost exclusively on the U.S. market, with minimal international sales under $5B, highlighting a focused domestic healthcare strategy.
Revenue by Segment
This pie chart illustrates Cigna Corporation’s revenue distribution by business segment for the fiscal year 2025, highlighting the company’s core income sources.
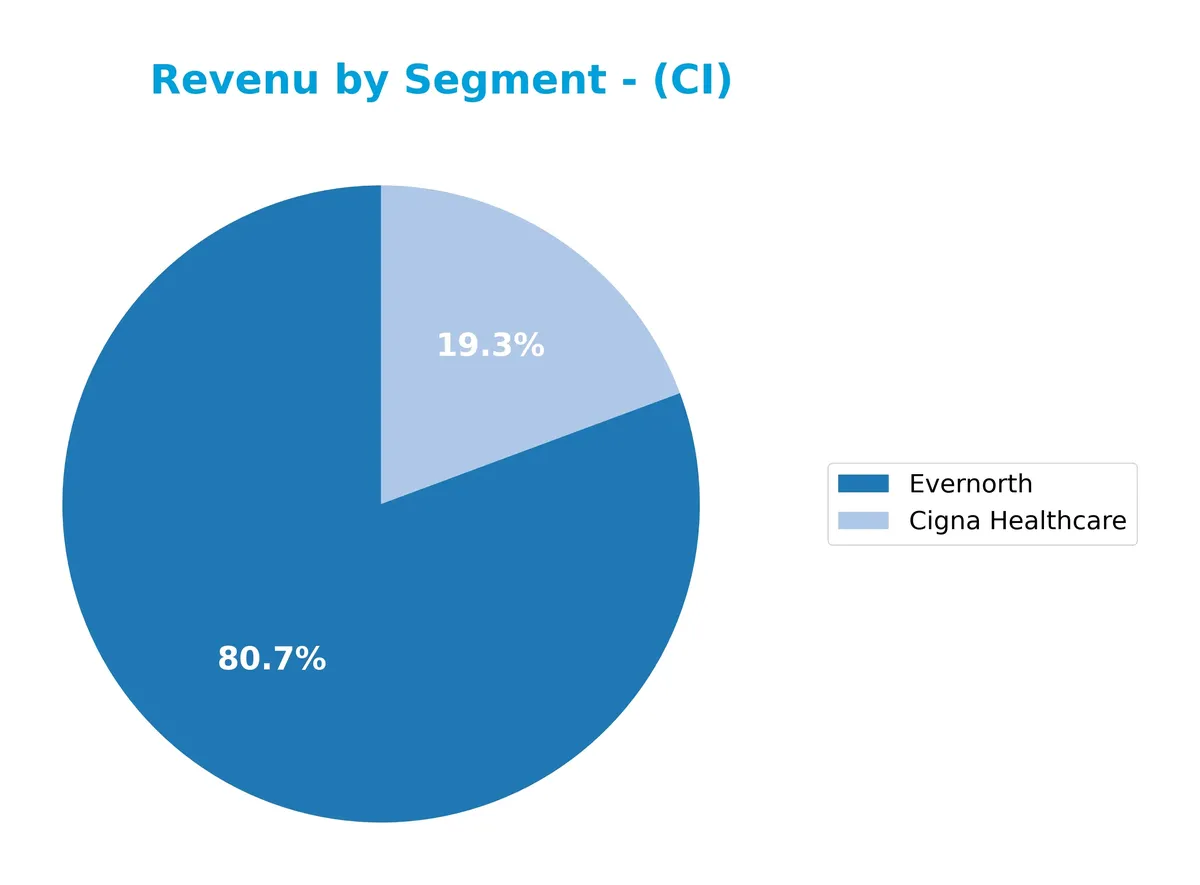
Evernorth dominates with $235B, showing robust growth from $198B in 2024, driving overall revenue expansion. Cigna Healthcare remains stable near $47B, highlighting consistent demand. The increasing concentration in Evernorth signals a strategic shift toward health services, potentially raising concentration risk but also reflecting strong segment momentum in 2025.
Key Products & Brands
Cigna Corporation’s primary business lines and their key offerings are detailed below:
| Product | Description |
|---|---|
| Evernorth | Provides coordinated health services including pharmacy, benefits management, care delivery, and intelligence solutions. |
| Cigna Healthcare | Offers medical, pharmacy, behavioral health, dental, vision, Medicare plans, individual insurance, and global health coverage. |
| Permanent Insurance | Sells permanent insurance contracts to corporations for employee benefit obligations financing. |
Cigna’s portfolio centers on integrated healthcare services through Evernorth and comprehensive insurance products via Cigna Healthcare. The company also provides corporate life insurance solutions, emphasizing diversified healthcare and insurance offerings.
Main Competitors
There are 7 main competitors in the Healthcare – Medical Healthcare Plans sector; below is a table of the top 7 leaders by market capitalization:
| Competitor | Market Cap. |
|---|---|
| UnitedHealth Group Incorporated | 305B |
| CVS Health Corporation | 102B |
| Elevance Health Inc. | 79B |
| Cigna Corporation | 75B |
| Humana Inc. | 32B |
| Centene Corporation | 21B |
| Molina Healthcare, Inc. | 9.7B |
Cigna ranks 4th among its competitors, with a market cap about 25% of UnitedHealth’s leading 305B. It sits below the average top 10 market cap of 88.8B but above the sector median of 74.6B. The company is just 2% behind Elevance Health, its closest rival above, indicating a tight mid-tier cluster.
Comparisons with competitors
Check out how we compare the company to its competitors:
Does CI have a competitive advantage?
Cigna Corporation demonstrates a sustainable competitive advantage, consistently generating returns on invested capital (ROIC) 2.86% above its weighted average cost of capital (WACC). I observe a growing ROIC trend of 32%, indicating efficient capital use and value creation over 2021-2025.
Looking ahead, Cigna’s diverse healthcare segments and expanding international presence offer opportunities for growth. Its Evernorth platform and Medicare-related products position it well to capture evolving demand in managed care and health services markets.
SWOT Analysis
This analysis highlights Cigna Corporation’s internal capabilities and external environment to guide strategic decisions.
Strengths
- strong market position in US healthcare plans
- growing ROIC with 7.35% vs. WACC 4.49%
- diversified health services through Evernorth segment
Weaknesses
- low current and quick ratios indicating liquidity concerns
- declining EBIT margin growth (-1.64%)
- moderate debt-to-equity score signaling leverage risks
Opportunities
- expanding Medicare Advantage and international markets
- increasing demand for integrated health solutions
- potential for digital health innovation and data analytics
Threats
- regulatory changes impacting insurance reimbursement
- intense competition from other healthcare insurers
- economic downturns reducing employer-sponsored health coverage
Cigna’s strengths in market leadership and sustainable profitability offer a solid foundation. However, liquidity weaknesses and margin pressures require cautious capital management. Strategic focus should leverage growth in Medicare and digital health while mitigating regulatory and competitive risks.
Stock Price Action Analysis
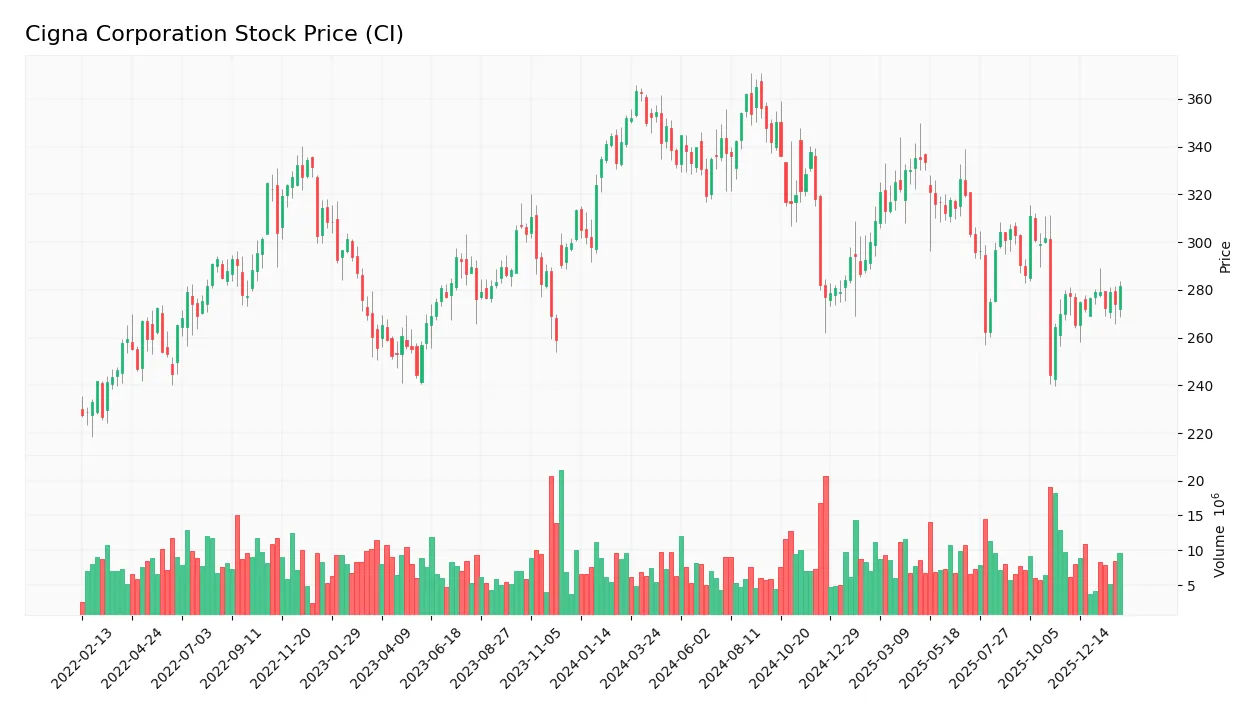
The weekly price chart displays Cigna Corporation’s stock movements over the past 12 months, highlighting key highs, lows, and trend shifts:
Trend Analysis
Over the past 12 months, Cigna’s stock declined by 20.31%, indicating a clear bearish trend with accelerating downside momentum. The price ranged from a high of 364.72 to a low of 244.41, with volatility elevated at a 27.9 standard deviation. However, a recent 2.5-month period shows a 5.14% recovery, suggesting a short-term bullish correction.
Volume Analysis
Trading volume increased overall, with a total of 1.01B shares changing hands. Seller volume slightly exceeds buyer volume at 51.1%, reflecting seller dominance. In the recent three months, volume remains elevated but shows a slight shift toward sellers, indicating cautious investor sentiment and moderate selling pressure.
Target Prices
Analysts set a consensus target price reflecting cautious optimism for Cigna Corporation.
| Target Low | Target High | Consensus |
|---|---|---|
| 300 | 375 | 325.83 |
The range from 300 to 375 indicates moderate upside potential, with the consensus near 326 signaling steady confidence in Cigna’s growth prospects.

Don’t Let Luck Decide Your Entry Point
Optimize your entry points with our advanced ProRealTime indicators. You’ll get efficient buy signals with precise price targets for maximum performance. Start outperforming now!
Analyst & Consumer Opinions
This section examines Cigna Corporation’s analyst ratings and consumer feedback to provide insight into market and customer perceptions.
Stock Grades
Here is a clear overview of recent verified analyst grades for Cigna Corporation from leading firms:
| Grading Company | Action | New Grade | Date |
|---|---|---|---|
| Truist Securities | Maintain | Buy | 2026-02-17 |
| TD Cowen | Maintain | Buy | 2026-02-09 |
| Guggenheim | Maintain | Buy | 2026-02-06 |
| RBC Capital | Maintain | Outperform | 2026-02-06 |
| Barclays | Maintain | Overweight | 2026-02-06 |
| Guggenheim | Maintain | Buy | 2026-02-02 |
| Truist Securities | Maintain | Buy | 2026-01-05 |
| Barclays | Maintain | Overweight | 2026-01-05 |
| Bernstein | Maintain | Market Perform | 2025-11-12 |
| Wells Fargo | Maintain | Equal Weight | 2025-11-05 |
The consensus leans heavily toward Buy, with multiple firms maintaining positive ratings through early 2026. Notably, no downgrades or sell ratings appear, indicating stable analyst confidence.
Consumer Opinions
Consumers express a mix of appreciation and frustration toward Cigna Corporation, reflecting its complex service landscape.
| Positive Reviews | Negative Reviews |
|---|---|
| Efficient claims processing speeds up reimbursements. | Customer service wait times often exceed expectations. |
| Wide network of healthcare providers ensures accessibility. | Premium costs have increased noticeably in recent years. |
| User-friendly digital platform simplifies policy management. | Some users report confusion over coverage details and billing. |
Overall, Cigna earns praise for its broad provider network and digital tools. However, rising premiums and customer service delays remain consistent pain points for policyholders.
Risk Analysis
Below is a table summarizing key risks facing Cigna Corporation and their assessed likelihood and potential impact:
| Category | Description | Probability | Impact |
|---|---|---|---|
| Liquidity Risk | Current ratio at 0.85 signals tight short-term liquidity, raising concerns over cash flexibility. | Medium | Medium |
| Profitability Risk | Low net margin of 2.17% reflects slim profits, exposing the company to margin pressure. | High | High |
| Leverage Risk | Debt-to-equity score is very unfavorable, indicating high reliance on debt financing. | Medium | Medium |
| Bankruptcy Risk | Altman Z-score of 2.7 places Cigna in the grey zone, implying moderate financial distress risk. | Medium | High |
| Market Volatility | Low beta (0.28) minimizes stock price swings but limits upside in bullish cycles. | Low | Low |
Liquidity and profitability risks stand out as most pressing. The weak current ratio signals cash flow constraints that could strain operations in downturns. Meanwhile, a narrow net margin makes earnings vulnerable to cost spikes or reimbursement cuts. The grey-zone Altman Z-score warns of moderate bankruptcy risk, requiring close monitoring. Overall, Cigna’s financial health is stable but fragile, demanding cautious risk management.
Should You Buy Cigna Corporation?
Cigna Corporation appears to be a profitable and operationally efficient company with a durable competitive moat, supported by growing ROIC well above WACC. Despite a manageable leverage profile flagged by its grey-zone Altman Z-score, the overall A- rating suggests a very favorable investment profile.
Strength & Efficiency Pillars
Cigna Corporation exhibits solid operational efficiency with a return on equity of 14.28% and a net margin of 2.17%. Its return on invested capital (ROIC) stands at 7.35%, comfortably above the weighted average cost of capital (WACC) at 4.49%, confirming it as a clear value creator. The company’s growing ROIC trend signals improving profitability. These metrics underscore Cigna’s sustainable competitive advantage and operational resilience in the healthcare sector.
Weaknesses and Drawbacks
Cigna’s Altman Z-Score of 2.70 places it in the grey zone, indicating moderate solvency risk that investors should monitor closely. The company faces unfavorable liquidity ratios, with a current ratio of 0.85 and quick ratio of 0.72, both below 1. This weak liquidity could pressure short-term obligations. While valuation appears reasonable with a P/E of 12.29, moderate P/B at 1.75 and a debt-to-equity ratio of 0.75 suggest cautious scrutiny of leverage and market sentiment, especially amid a slightly seller-dominant recent trend (46.97% buyers).
Our Final Verdict about Cigna Corporation
Cigna may appear attractive for investors seeking long-term value creation given its favorable ROIC-WACC spread and improving profitability. However, the grey zone Altman Z-Score signals some solvency risk, warranting a cautious stance. Despite operational strengths, recent market pressure and liquidity concerns suggest a wait-and-see approach could be prudent before adding exposure.
Disclaimer: This content is for informational purposes only and does not constitute financial, investment, or other professional advice. Investing in financial markets involves a significant risk of loss, and past performance is not indicative of future results.
Additional Resources
- Here’s What the Street Thinks About The Cigna Group (CI) Post Earnings – Insider Monkey (Feb 27, 2026)
- Deutsche Bank Has Buy Recommendation on Cigna (CI) – bitget.com (Feb 27, 2026)
- Assessing Cigna Group (CI) Valuation After Analyst Optimism And Regulatory Settlement – simplywall.st (Feb 27, 2026)
- What Cigna Group (CI)’s Alleged Rebate Diversion Class Action Means For Shareholders – Yahoo Finance (Feb 27, 2026)
- Is Cigna Group Stock Underperforming the Dow? – Barchart.com (Feb 27, 2026)
For more information about Cigna Corporation, please visit the official website: cigna.com