Home > Analyses > Financial Services > Chubb Limited
Chubb Limited shields businesses and families worldwide from financial uncertainty, shaping the insurance landscape with precision and innovation. As a global heavyweight in property and casualty insurance, Chubb offers a diverse portfolio, from commercial risk management to personal high-net-worth coverage, backed by a reputation for underwriting excellence. With its strategic reach and robust product suite, I ask: does Chubb’s current valuation reflect its growth potential in an evolving risk environment?

Table of contents
Business Model & Company Overview
Chubb Limited, founded in 1985 and headquartered in Zurich, stands as a global heavyweight in Property & Casualty insurance. Its ecosystem spans commercial, personal, agricultural, and specialty insurance lines, serving diverse clients from small businesses to high-net-worth individuals. This comprehensive coverage underpins its industry dominance, blending risk management with tailored protection worldwide.
Chubb’s revenue engine balances traditional insurance premiums with specialty reinsurance and life insurance products, creating a resilient income mix. Its strategic footprint covers the Americas, Europe, and Asia, leveraging brokers and agents to access varied markets. This multi-segment approach forms a robust economic moat, positioning Chubb as a key architect of the insurance sector’s evolving landscape.
Financial Performance & Fundamental Metrics
I analyze Chubb Limited’s income statement, key financial ratios, and dividend payout policy to assess its operational efficiency and shareholder value creation.
Income Statement
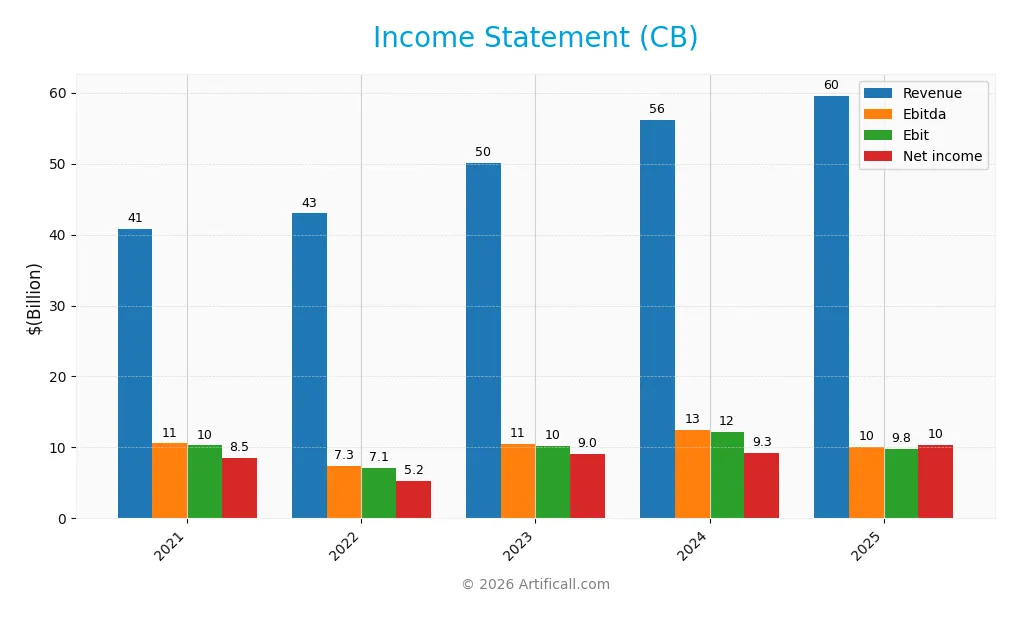
The table below presents Chubb Limited’s key income statement figures for the fiscal years 2021 through 2025, reflecting revenue, profitability, and earnings per share trends.
| 2021 | 2022 | 2023 | 2024 | 2025 | |
|---|---|---|---|---|---|
| Revenue | 40.8B | 42.9B | 50.1B | 56.2B | 59.6B |
| Cost of Revenue | 29.4B | 32.1B | 36.3B | 39.9B | 32.0B |
| Operating Expenses | 1.5B | 4.3B | 4.3B | 4.7B | 4.4B |
| Gross Profit | 11.3B | 10.8B | 13.8B | 16.2B | 27.5B |
| EBITDA | 10.6B | 7.3B | 10.5B | 12.5B | 10.1B |
| EBIT | 10.3B | 7.1B | 10.2B | 12.2B | 9.8B |
| Interest Expense | 492M | 570M | 672M | 741M | 764M |
| Net Income | 8.5B | 5.2B | 9.0B | 9.3B | 10.3B |
| EPS | 19.38 | 12.50 | 21.97 | 22.94 | 25.91 |
| Filing Date | 2022-02-24 | 2023-02-24 | 2024-02-23 | 2025-02-27 | 2026-02-27 |
Income Statement Evolution
Chubb Limited’s revenue rose steadily from $40.8B in 2021 to $59.6B in 2025, a 46% increase. Net income grew 21% overall, reaching $10.3B in 2025. Gross margin improved to 46.2%, signaling better cost control. However, EBIT margin declined slightly year-over-year despite favorable net margin growth, reflecting some pressure on operating efficiency.
Is the Income Statement Favorable?
In 2025, fundamentals remain positive with a net margin of 17.3%, supported by controlled interest expenses at 1.28% of revenue. EBIT margin at 16.4% is favorable but declined 19.8% from 2024, indicating operational challenges. Revenue and EPS growth were healthy, while net margin growth was neutral. Overall, the income statement reflects strong profitability with manageable risks.
Financial Ratios
The table below summarizes key financial ratios for Chubb Limited over the past five fiscal years, reflecting profitability, valuation, liquidity, leverage, and efficiency metrics:
| Ratios | 2021 | 2022 | 2023 | 2024 | 2025 |
|---|---|---|---|---|---|
| Net Margin | 21% | 12% | 18% | 17% | 17% |
| ROE | 14% | 10% | 15% | 14% | 14% |
| ROIC | 8.5% | 11.0% | 6.2% | 12.1% | 71% |
| P/E | 10.0 | 17.7 | 10.3 | 12.2 | 12.0 |
| P/B | 1.42 | 1.83 | 1.56 | 1.76 | 1.68 |
| Current Ratio | 0 | 0 | 0 | 0 | 0 |
| Quick Ratio | 0 | 0 | 0 | 0 | 0 |
| D/E | 0.27 | 0.29 | 0.24 | 0.24 | 0 |
| Debt-to-Assets | 8.1% | 7.5% | 6.3% | 6.2% | 0 |
| Interest Coverage | 19.9 | 11.4 | 14.2 | 15.5 | 30.3 |
| Asset Turnover | 0.20 | 0.22 | 0.22 | 0.23 | 0.22 |
| Fixed Asset Turnover | 0 | 0 | 0 | 0 | 0 |
| Dividend Yield | 1.65% | 1.48% | 1.50% | 1.27% | 1.22% |
Evolution of Financial Ratios
Chubb Limited’s Return on Equity (ROE) showed moderate fluctuations, peaking around 15.17% in 2023 before settling near 13.98% in 2025. The Current Ratio remained unreported or zero, suggesting no available liquidity data. Debt-to-Equity Ratio decreased to zero by 2025 from a range around 0.24 in previous years, indicating significant deleveraging. Profit margins generally improved, with net margin rising from 12.2% in 2022 to 17.3% in 2025.
Are the Financial Ratios Favorable?
In 2025, profitability ratios such as net margin (17.3%) and return on invested capital (71.4%) are favorable, supported by a low weighted average cost of capital (5.8%). However, liquidity ratios (current and quick ratios) are unfavorable due to zero reported values. Leverage ratios, including debt-to-equity and debt-to-assets, are favorable, reflecting minimal debt. Asset turnover is low at 0.22, suggesting efficiency challenges. Overall, the financial ratios are slightly favorable, with balanced strengths and weaknesses.
Shareholder Return Policy
Chubb Limited maintains a consistent dividend policy with a payout ratio near 15%, yielding around 1.2% annually. Dividends per share rose steadily from $3.18 in 2021 to $3.82 in 2025, supported by strong free cash flow coverage and moderate leverage.
The company also executes share buybacks, complementing its dividend distributions. This balanced approach underpins sustainable shareholder value, as payouts remain well-covered by earnings and cash flow without excessive financial strain or risk.
Score analysis
The following radar chart illustrates Chubb Limited’s key financial scores across valuation, profitability, and leverage metrics:
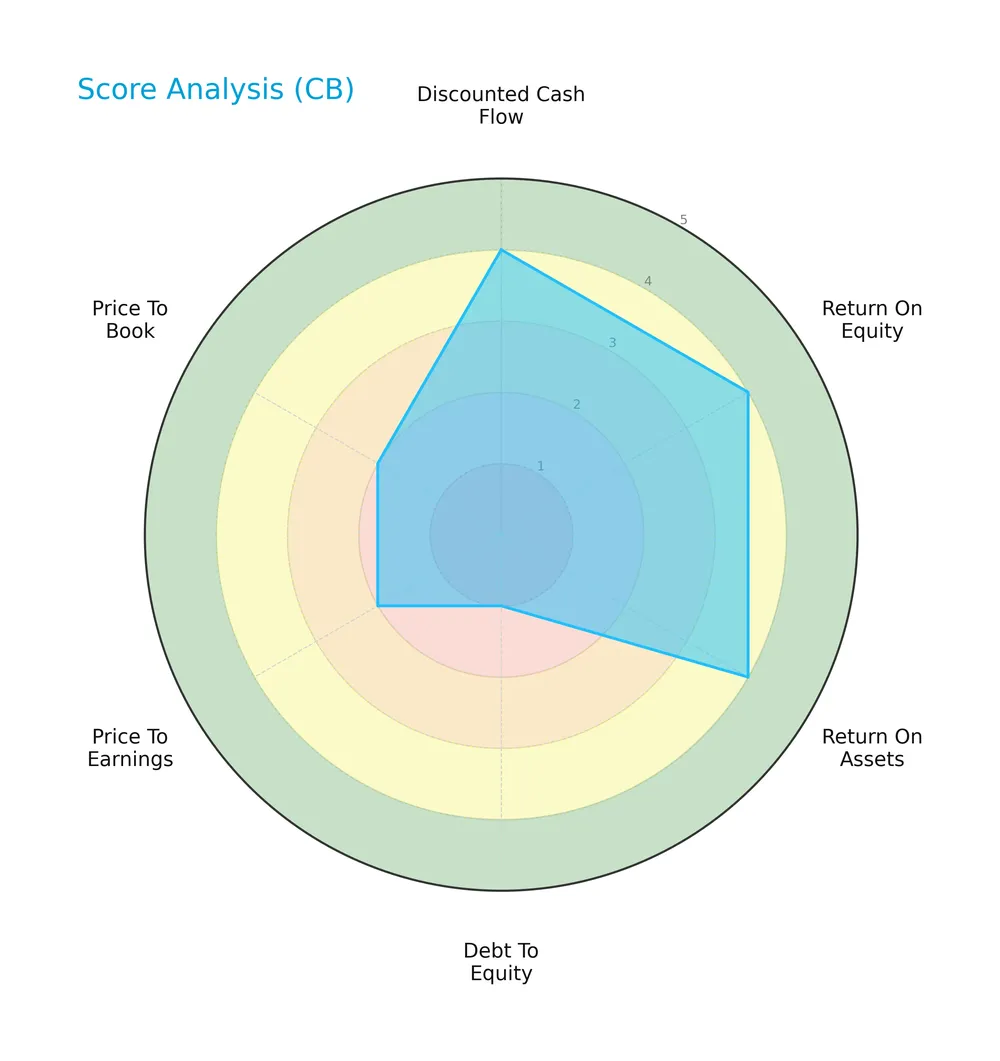
Chubb Limited scores well on discounted cash flow, return on equity, and return on assets, each marked favorable at 4. However, its debt-to-equity ratio scores very unfavorably at 1, signaling high leverage risks. Price-to-earnings and price-to-book scores remain below average at 2, reflecting valuation concerns.
Analysis of the company’s bankruptcy risk
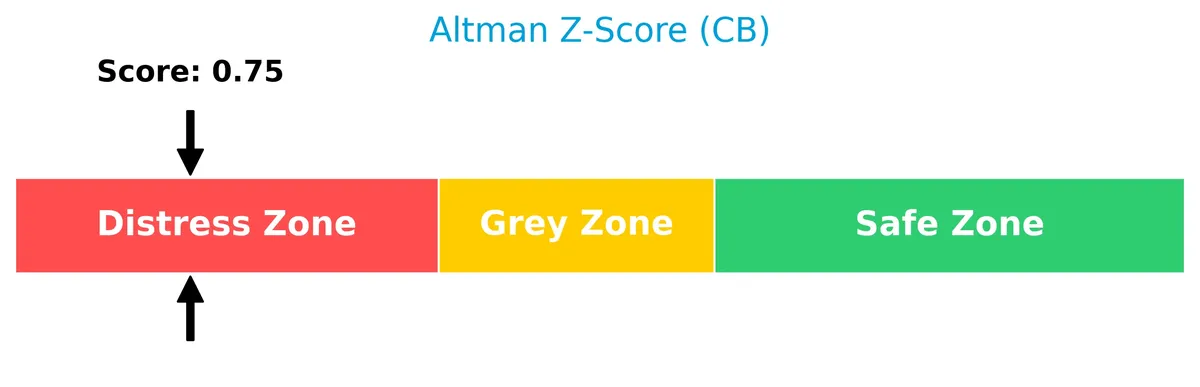
Chubb Limited’s Altman Z-Score places it firmly in the distress zone, indicating a significant risk of financial distress and potential bankruptcy:
Is the company in good financial health?
The Piotroski Score diagram displays Chubb Limited’s overall financial strength, focusing on profitability, efficiency, and leverage:

With a Piotroski Score of 7, Chubb Limited demonstrates strong financial health. This score reflects solid profitability and operational efficiency despite leverage concerns, suggesting resilience in its financial structure.
Competitive Landscape & Sector Positioning
This section examines Chubb Limited’s strategic positioning, revenue segments, and key products within the insurance sector. I will analyze its main competitors and evaluate whether Chubb holds a competitive advantage. The following analysis includes a detailed SWOT overview to contextualize its market standing.
Strategic Positioning
Chubb Limited maintains a diversified product portfolio spanning property & casualty, life insurance, and global reinsurance. Its geographic exposure includes significant operations in North America and overseas markets. This multi-segment, multi-region approach balances risk and leverages cross-market opportunities.
Revenue by Segment
This pie chart displays Chubb Limited’s revenue by business segment for the fiscal year 2025, highlighting the company’s income from Life insurance.
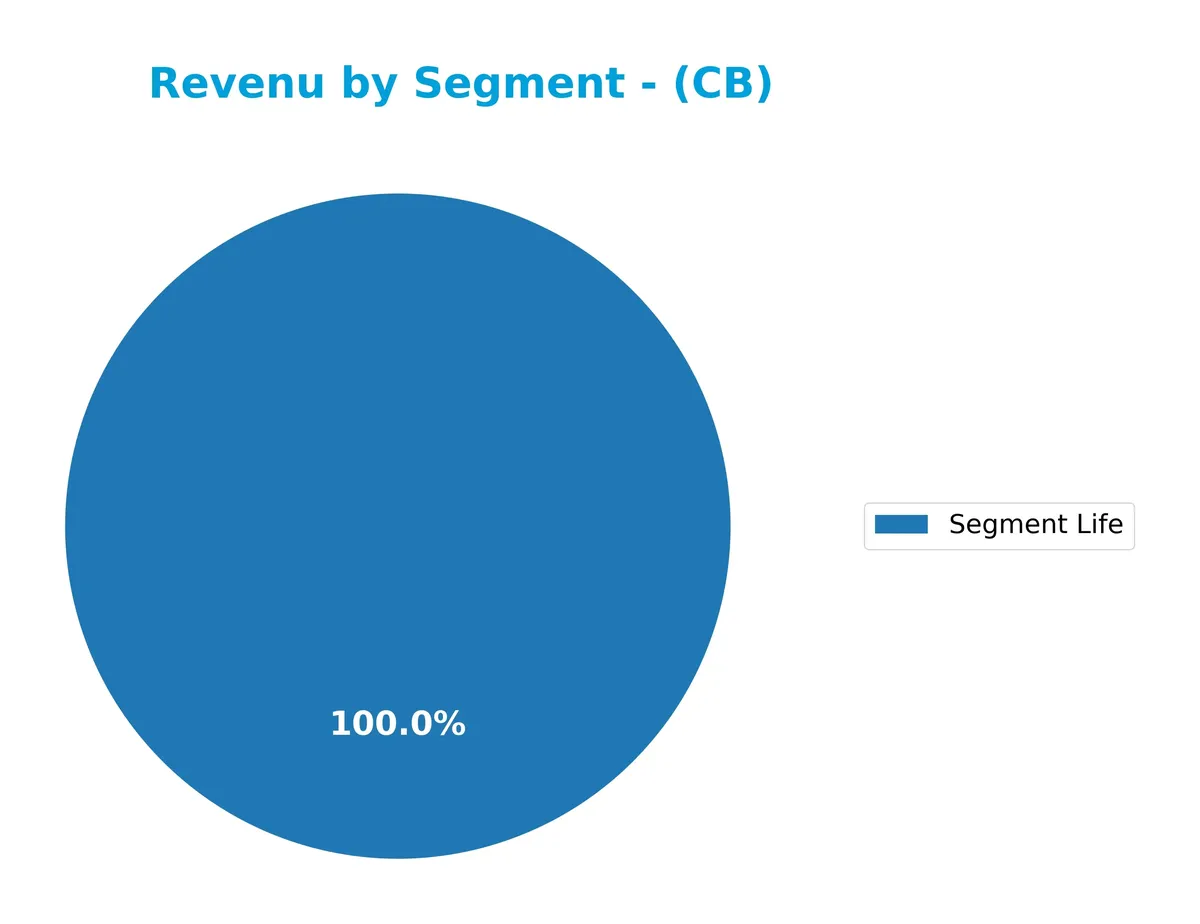
Chubb’s Life segment generated $7.2B in 2025, up from $6.7B in 2024, showing steady growth in this line. Historical data for Property and Casualty segments from earlier years shows a higher revenue base, but recent figures focus solely on Life. The growing Life revenue suggests a strategic shift or concentration, warranting monitoring for diversification risks going forward.
Key Products & Brands
The table below summarizes Chubb Limited’s main insurance products and brand segments:
| Product | Description |
|---|---|
| North America Commercial P&C | Commercial property, casualty, workers’ compensation, package policies, risk management, financial lines, marine, construction, environmental, medical, cyber risk, surety, excess casualty, group accident and health insurance for businesses. |
| North America Personal P&C | Homeowners, automobile, collector cars, valuable articles, personal and excess liability, travel, and recreational marine insurance for affluent individuals and families. |
| North America Agricultural | Multiple peril crop, crop-hail insurance, farm and ranch property, commercial agriculture products coverage. |
| Overseas General Insurance | Commercial property and casualty, specialty categories (financial lines, marine, energy, aviation, political risk, construction), group accident and health, personal lines for corporations and small customers through brokers and agents. |
| Global Reinsurance | Traditional and specialty reinsurance under Chubb Tempest Re brand targeting property and casualty companies. |
| Life Insurance | Protection and savings products including whole life, endowment plans, term life, group term life, medical and health, personal accident, credit life, universal life, and unit linked contracts. |
Chubb Limited offers a diversified portfolio spanning commercial, personal, agricultural, reinsurance, and life insurance sectors. This broad product mix supports resilience across market cycles.
Main Competitors
There are 7 total competitors in this sector; the table lists the top 7 leaders by market capitalization:
| Competitor | Market Cap. |
|---|---|
| The Progressive Corporation | 124B |
| Chubb Limited | 124B |
| The Travelers Companies, Inc. | 64B |
| The Allstate Corporation | 54B |
| W. R. Berkley Corporation | 26B |
| Cincinnati Financial Corporation | 25B |
| Loews Corporation | 22B |
Chubb Limited ranks 2nd among its competitors, slightly below the leader by approximately 7.3%. It stands above both the average market cap of the top 10 (63B) and the sector median (54B). The gap to the nearest competitor above is narrow, indicating a close race for the top position.
Comparisons with competitors
Check out how we compare the company to its competitors:
Does Chubb Limited have a competitive advantage?
Chubb Limited displays a competitive advantage by creating value with a ROIC significantly above its WACC, indicating efficient capital use and excess returns. However, its declining ROIC trend signals weakening profitability over recent years.
Looking ahead, Chubb’s diversified insurance portfolio across commercial, personal, agricultural, and reinsurance segments supports growth opportunities. Expansion into specialty risk markets and innovative product lines may help stabilize and enhance future profitability.
SWOT Analysis
This analysis highlights Chubb Limited’s core competitive factors and risks to guide strategic decisions.
Strengths
- strong global brand
- diversified insurance portfolio
- favorable net margin of 17.3%
Weaknesses
- declining ROIC trend
- low liquidity ratios
- moderate revenue growth of 6.1%
Opportunities
- expanding specialty insurance markets
- digital transformation in underwriting
- growth in emerging markets
Threats
- intense industry competition
- regulatory changes in insurance
- economic downturn impacting underwriting
Chubb’s solid profitability and broad product mix create a resilient base. However, declining efficiency and liquidity issues warrant cautious capital management. Growth hinges on innovation and geographic expansion amid competitive and regulatory pressures.
Stock Price Action Analysis
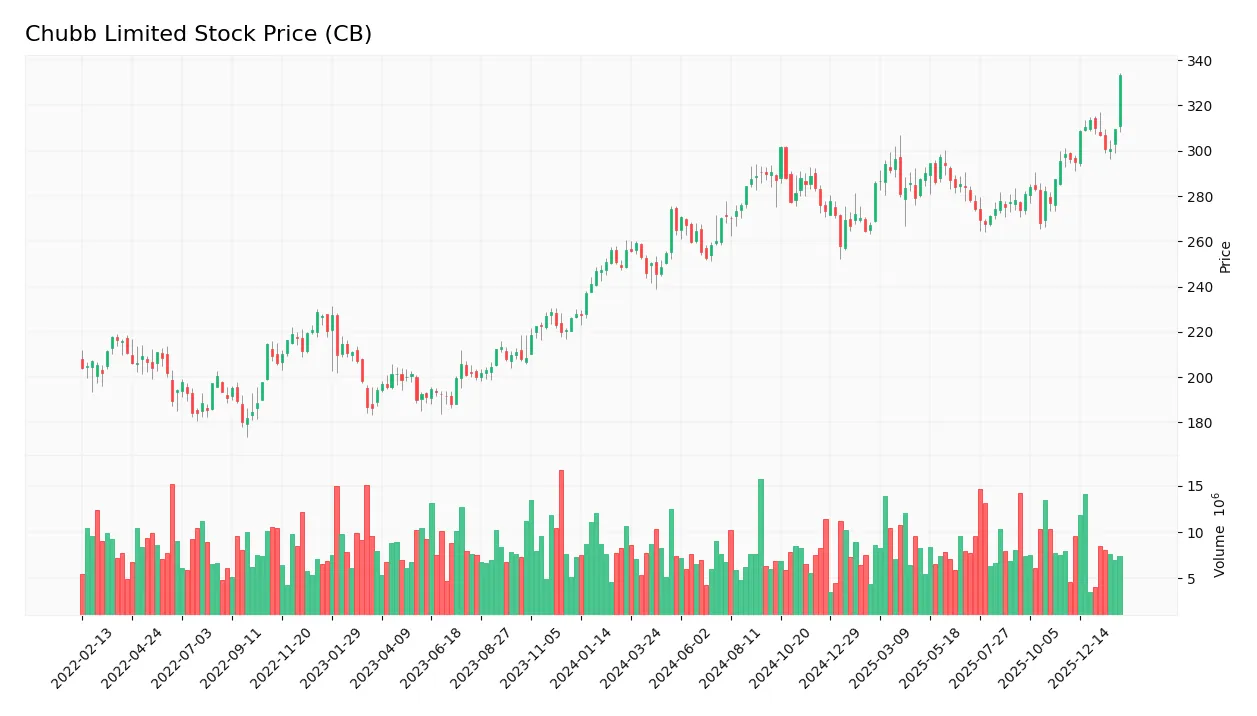
The weekly chart highlights Chubb Limited’s stock price performance over the past 100 weeks, revealing key price fluctuations and trend dynamics:
Trend Analysis
Over the past 100 weeks, Chubb Limited’s stock price increased by 34.78%, indicating a bullish trend with acceleration. The price ranged from a low of 245.45 to a high of 340.86, with volatility reflected by an 18.01 standard deviation. Recent three-month gains of 10.5% confirm continued upward momentum.
Volume Analysis
Trading volume has increased, with buyer volume at 549M representing 56% of total activity over 100 weeks. In the recent period, buyers dominate 70% of volume, signaling strong buying interest and heightened market participation from December 2025 to March 2026.
Target Prices
Analysts show a confident consensus on Chubb Limited’s target price range.
| Target Low | Target High | Consensus |
|---|---|---|
| 305 | 373 | 340.31 |
The target prices indicate a solid upside potential, with the consensus suggesting steady growth expectations in the insurance sector.

Don’t Let Luck Decide Your Entry Point
Optimize your entry points with our advanced ProRealTime indicators. You’ll get efficient buy signals with precise price targets for maximum performance. Start outperforming now!
Analyst & Consumer Opinions
This section examines Chubb Limited’s recent analyst ratings and consumer feedback to provide a balanced market perspective.
Stock Grades
Here are the latest verified analyst grades for Chubb Limited from recognized financial institutions:
| Grading Company | Action | New Grade | Date |
|---|---|---|---|
| BMO Capital | Maintain | Market Perform | 2026-02-10 |
| Raymond James | Maintain | Strong Buy | 2026-02-09 |
| Citigroup | Maintain | Buy | 2026-02-09 |
| Keefe, Bruyette & Woods | Maintain | Outperform | 2026-02-09 |
| Mizuho | Maintain | Neutral | 2026-02-06 |
| Wells Fargo | Maintain | Equal Weight | 2026-02-05 |
| Evercore ISI Group | Maintain | Outperform | 2026-02-04 |
| Citizens | Maintain | Market Outperform | 2026-02-04 |
| Roth Capital | Maintain | Buy | 2026-02-04 |
| JP Morgan | Maintain | Neutral | 2026-02-04 |
The consensus leans positive with a majority recommending Buy or better, reflecting confidence in the stock’s relative strength. Few Neutral and Market Perform grades suggest cautious optimism without aggressive upward adjustments.
Consumer Opinions
Consumers generally praise Chubb Limited for its reliable coverage and responsive claims service, though some express concerns over premium costs.
| Positive Reviews | Negative Reviews |
|---|---|
| “Chubb’s claims process was smooth and fast.” | “Premiums are higher compared to competitors.” |
| “Excellent customer service and clear policy terms.” | “Limited options for small business insurance.” |
| “Strong financial backing gives me peace of mind.” | “Renewal rates increased unexpectedly last year.” |
Overall, clients appreciate Chubb’s dependable service and financial strength. However, premium pricing and product range limitations surface as consistent drawbacks.
Risk Analysis
Below is a detailed table outlining key risks that could affect Chubb Limited’s performance and valuation:
| Category | Description | Probability | Impact |
|---|---|---|---|
| Financial Health | Altman Z-Score in distress zone (0.76) signals a significant bankruptcy risk. | High | Severe |
| Liquidity | Current and quick ratios at 0 reflect a critical liquidity concern, risking short-term solvency. | High | Severe |
| Valuation | Unfavorable P/E (12.0) and P/B (1.68) scores suggest valuation tensions versus sector peers. | Medium | Moderate |
| Asset Efficiency | Low asset turnover (0.22) and zero fixed asset turnover indicate inefficient asset use. | Medium | Moderate |
| Debt Management | Despite favorable debt-to-equity metrics, a very unfavorable debt-to-equity score (1) raises flags. | Medium | Moderate |
| Market Volatility | Beta of 0.488 shows lower volatility, but market shocks in insurance can still impact returns. | Low | Moderate |
Chubb’s most pressing risks are its distressed Altman Z-Score and nonexistent liquidity ratios. Historically, insurance firms with these traits face heightened bankruptcy risk during adverse cycles. Despite strong operational returns (ROIC 71%) and a solid Piotroski score, the liquidity shortfall demands caution. Investors should weigh these financial red flags against the company’s robust market position and stable dividend yield.
Should You Buy Chubb Limited?
Chubb Limited appears to be a profitable company with robust value creation despite a declining ROIC trend, suggesting a slightly favorable moat. Its leverage profile shows risks amid substantial debt, while the overall B rating indicates a very favorable but cautious investment profile.
Strength & Efficiency Pillars
Chubb Limited exhibits strong operational margins with a net margin of 17.3% and an EBIT margin of 16.42%, underscoring efficient cost management. The company’s return on invested capital (ROIC) stands at 71.36%, vastly exceeding its weighted average cost of capital (WACC) at 5.81%, confirming it as a clear value creator. Despite a neutral return on equity (13.98%), the firm’s solid interest coverage ratio of 12.8 reflects prudent financial management. These metrics anchor Chubb’s operational strength amid a challenging market.
Weaknesses and Drawbacks
Chubb faces significant financial distress, as indicated by its Altman Z-Score of 0.76, placing it firmly in the distress zone with a high bankruptcy risk. This solvency concern overshadows operational strengths. Additionally, valuation metrics present mixed signals: a favorable P/E of 12.0 contrasts with a neutral P/B at 1.68. Liquidity ratios are critically unfavorable, with a current ratio and quick ratio both at zero, raising red flags about short-term financial flexibility. These weaknesses demand cautious scrutiny.
Our Final Verdict about Chubb Limited
Despite operational efficiency and value creation, Chubb’s financial distress indicated by its low Altman Z-Score makes the investment profile highly speculative. The solvency risk overshadows profitability, suggesting the stock may be too risky for conservative capital. Investors might consider waiting for clearer signs of financial stabilization before increasing exposure. The profile could improve if liquidity and balance sheet strength recover, but current risks warrant prudence.
Disclaimer: This content is for informational purposes only and does not constitute financial, investment, or other professional advice. Investing in financial markets involves a significant risk of loss, and past performance is not indicative of future results.
Additional Resources
- Chubb Limited (NYSE: CB) outlines $272B balance sheet and 2025 insurance mix – Stock Titan (Feb 27, 2026)
- Chubb Limited (CB) Is a Trending Stock: Facts to Know Before Betting on It – Yahoo Finance (Feb 24, 2026)
- Chubb Ltd (CB): A Strategic SWOT Insight – GuruFocus (Feb 28, 2026)
- TD Asset Management Inc Trims Position in Chubb Limited $CB – MarketBeat (Feb 27, 2026)
- Chubb Ltd SEC 10-K Report – TradingView (Feb 27, 2026)
For more information about Chubb Limited, please visit the official website: chubb.com/us-en