Home > Analyses > Energy > Chevron Corporation
Chevron fuels modern life by powering transportation, industry, and homes worldwide. It dominates the integrated oil and gas sector with robust upstream exploration and downstream refining operations. Known for innovation, Chevron advances renewable fuels alongside traditional energy, maintaining a strong market presence. As the energy landscape shifts, I question whether Chevron’s solid fundamentals and strategic initiatives can sustain its valuation and growth in an evolving industry.
Table of contents
Business Model & Company Overview
Chevron Corporation, founded in 1879 and headquartered in San Ramon, California, stands as a titan in the Oil & Gas Integrated industry. Its operations form a cohesive energy ecosystem, spanning exploration, production, refining, and marketing of petroleum and chemicals. This integrated approach underpins Chevron’s dominant market position and long-standing reputation in the sector.
Chevron’s revenue engine balances upstream activities in crude oil and natural gas with downstream refining and marketing, including renewable fuels and petrochemicals. Its strategic footprint spans the Americas, Europe, and Asia, enabling diversified cash flow streams. Chevron’s economic moat lies in this integrated model and global scale, which shapes the future of energy with resilience and adaptability.
Financial Performance & Fundamental Metrics
I will analyze Chevron Corporation’s income statement, key financial ratios, and dividend payout policy to reveal its underlying financial health and shareholder value strategy.
Income Statement
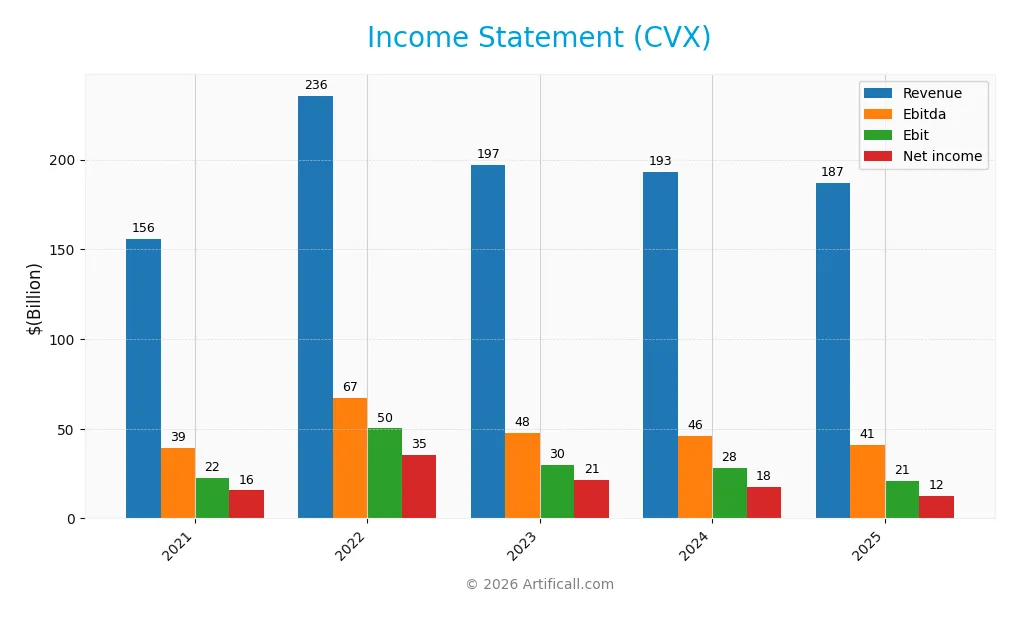
The table below summarizes Chevron Corporation’s key income statement figures over the past five fiscal years, reported in USD and scaled for clarity.
| 2021 | 2022 | 2023 | 2024 | 2025 | |
|---|---|---|---|---|---|
| Revenue | 156B | 236B | 197B | 193B | 187B |
| Cost of Revenue | 110B | 170B | 137B | 136B | 153B |
| Operating Expenses | 29.3B | 25.6B | 26.6B | 27.8B | 23.4B |
| Gross Profit | 45.4B | 65.6B | 60.4B | 56.9B | 34.4B |
| EBITDA | 39.4B | 67.0B | 47.8B | 45.8B | 41.1B |
| EBIT | 22.4B | 50.2B | 30.1B | 28.1B | 21.0B |
| Interest Expense | 712M | 516M | 469M | 594M | 1.2B |
| Net Income | 15.6B | 35.5B | 21.4B | 17.7B | 12.4B |
| EPS | 8.15 | 18.36 | 11.41 | 9.76 | 6.65 |
| Filing Date | 2022-02-24 | 2023-02-23 | 2024-02-26 | 2025-02-21 | 2026-02-24 |
Income Statement Evolution
Chevron’s revenue grew 20% from 2021 to 2025 but declined 3.3% in the last year to $187B. Net income fell 21% over the period and dropped 27% in 2025 to $12.4B. Gross margin held steady near 18%, while EBIT and net margins contracted significantly, reflecting margin pressure despite stable top-line performance.
Is the Income Statement Favorable?
In 2025, Chevron posted a net margin of 6.6%, an unfavorable decline from prior years. EBIT margin remained relatively strong at 11.2%, supported by controlled interest expense at 0.65% of revenue. However, deteriorating profitability and shrinking EPS (-32% year-over-year) weigh on fundamentals, indicating challenges in sustaining past earnings levels amid declining revenue.
Financial Ratios
The following table summarizes Chevron Corporation’s key financial ratios for the fiscal years 2021 through 2025, providing insight into profitability, valuation, liquidity, leverage, efficiency, and dividend metrics:
| Ratios | 2021 | 2022 | 2023 | 2024 | 2025 |
|---|---|---|---|---|---|
| Net Margin | 10.0% | 15.0% | 10.9% | 9.13% | 6.62% |
| ROE | 11.2% | 22.3% | 13.3% | 11.6% | 6.64% |
| ROIC | 5.5% | 12.7% | 10.6% | 8.4% | 2.4% |
| P/E | 14.4 | 9.8 | 13.1 | 14.8 | 24.5 |
| P/B | 1.62 | 2.18 | 1.74 | 1.72 | 1.63 |
| Current Ratio | 1.26 | 1.47 | 1.27 | 1.06 | 1.00 |
| Quick Ratio | 1.01 | 1.23 | 1.01 | 0.83 | 0.76 |
| D/E | 0.23 | 0.15 | 0.13 | 0.16 | 0.22 |
| Debt-to-Assets | 13.1% | 9.1% | 8.0% | 9.6% | 12.6% |
| Interest Coverage | 22.6 | 77.4 | 72.0 | 49.0 | 9.0 |
| Asset Turnover | 0.65 | 0.91 | 0.75 | 0.75 | 0.58 |
| Fixed Asset Turnover | 1.06 | 1.64 | 1.28 | 1.31 | 0.43 |
| Dividend Yield | 4.53% | 3.16% | 4.06% | 4.50% | 4.22% |
Evolution of Financial Ratios
Chevron’s Return on Equity (ROE) declined notably from 22.27% in 2022 to 6.64% in 2025, signaling a slowdown in profitability. The Current Ratio decreased steadily, nearing 1.0 by 2025, reflecting tightening liquidity. Debt-to-Equity Ratio rose slightly but remained low at 0.22, indicating stable leverage. Profit margins showed a downward trend, with net margin falling to 6.62% in 2025.
Are the Financial Ratios Favorable?
In 2025, Chevron’s profitability ratios like ROE (6.64%) and ROIC (2.42%) are below WACC (6.56%), marking unfavorable returns against capital costs. Liquidity ratios, including Current (1.0) and Quick (0.76), are unfavorable, suggesting limited short-term buffer. Conversely, low leverage ratios (Debt-to-Equity 0.22) and strong interest coverage (17.22) are favorable. Market valuation metrics show a neutral stance, with P/E at 24.49 and dividend yield healthy at 4.22%. Overall, the ratio profile is balanced but leans neutral due to mixed signals.
Shareholder Return Policy
Chevron maintains a dividend payout ratio slightly above 100% in 2025, with a dividend per share rising to $6.43 and a 4.22% yield. The dividend is supported by free cash flow coverage of 1.13x, indicating distributions are mostly sustainable but warrant monitoring.
The company also engages in share buybacks, complementing its dividend strategy. This distribution approach balances shareholder returns with operational cash needs, suggesting Chevron supports sustainable long-term value creation without overextending its cash resources.
Score analysis
The following radar chart displays Chevron Corporation’s key financial scores for a comprehensive overview:
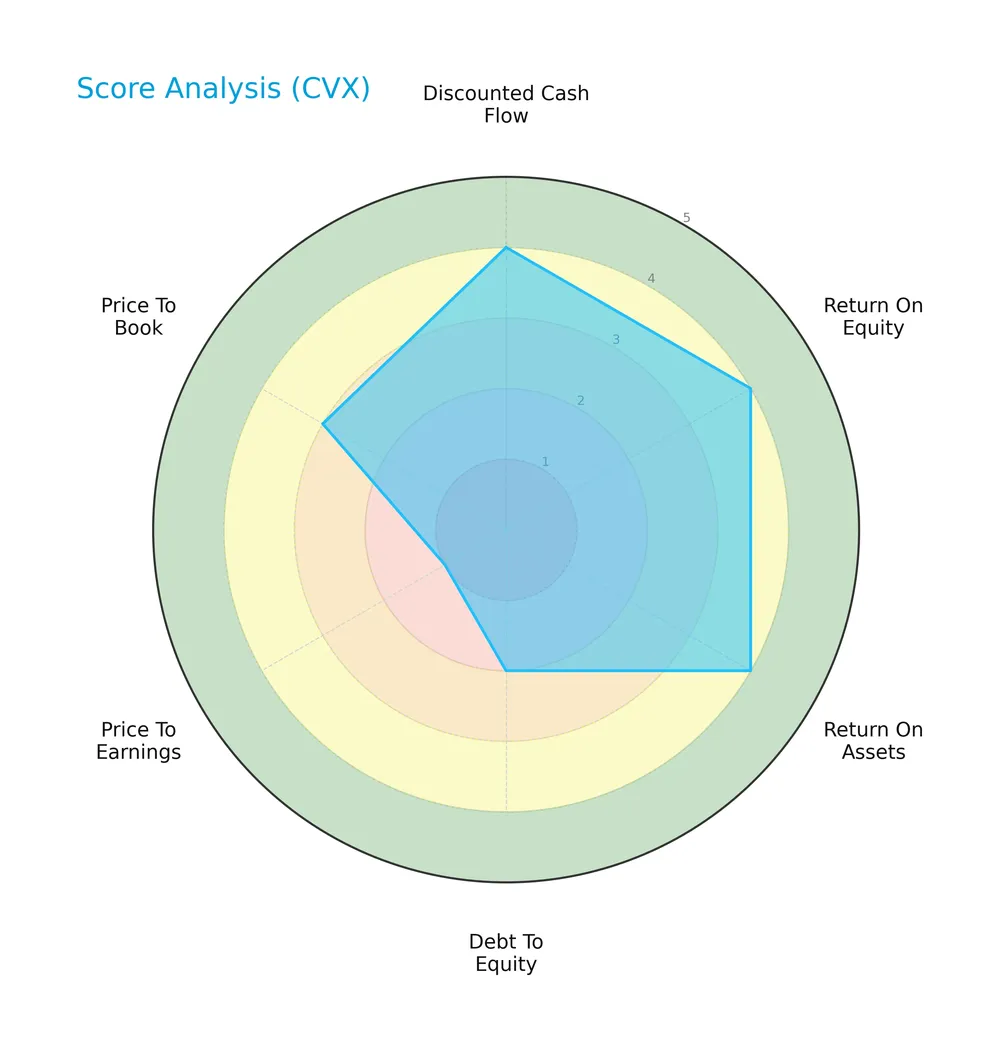
Chevron scores moderately on discounted cash flow, return on equity, and debt-to-equity metrics. Return on assets is favorable, while price-to-earnings and price-to-book scores are weak, signaling valuation concerns despite solid operational performance.
Analysis of the company’s bankruptcy risk
Chevron currently sits comfortably in the safe zone according to its Altman Z-Score, indicating low bankruptcy risk:

Is the company in good financial health?
The Piotroski Score diagram illustrates Chevron’s financial condition based on profitability, leverage, and efficiency metrics:
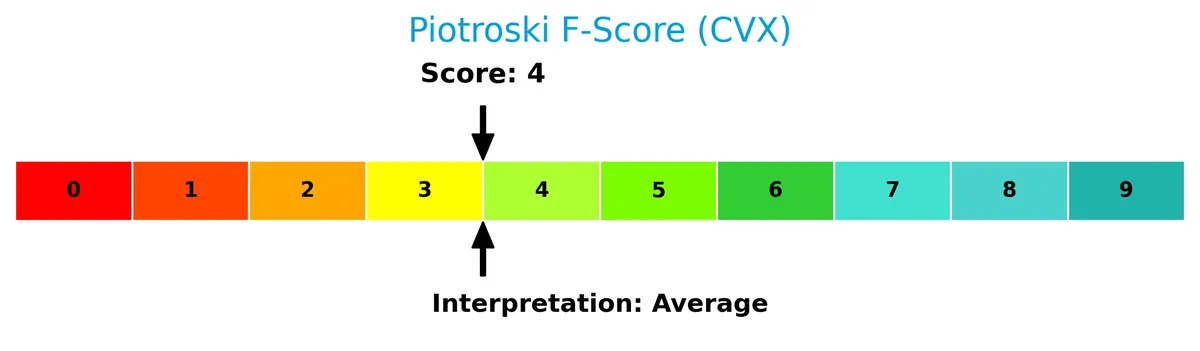
With a Piotroski Score of 4, Chevron reflects average financial health, suggesting moderate strengths but room for improvement in operational and balance sheet indicators.
Competitive Landscape & Sector Positioning
This section examines Chevron Corporation’s strategic positioning within the integrated Oil & Gas sector. It reviews revenue by segment, key products, main competitors, and competitive advantages. I will assess whether Chevron holds a sustainable competitive advantage over its industry peers.
Strategic Positioning
Chevron Corporation maintains a diversified product portfolio with significant revenue from downstream ($72.5B) and upstream ($45.5B) segments in 2025. Its geographic exposure spans both U.S. and international markets, reflecting a balanced global energy footprint essential in the integrated oil and gas sector.
Revenue by Segment
This pie chart illustrates Chevron Corporation’s revenue breakdown by segment for fiscal year 2025, highlighting the relative contributions of downstream, upstream, and other segments.
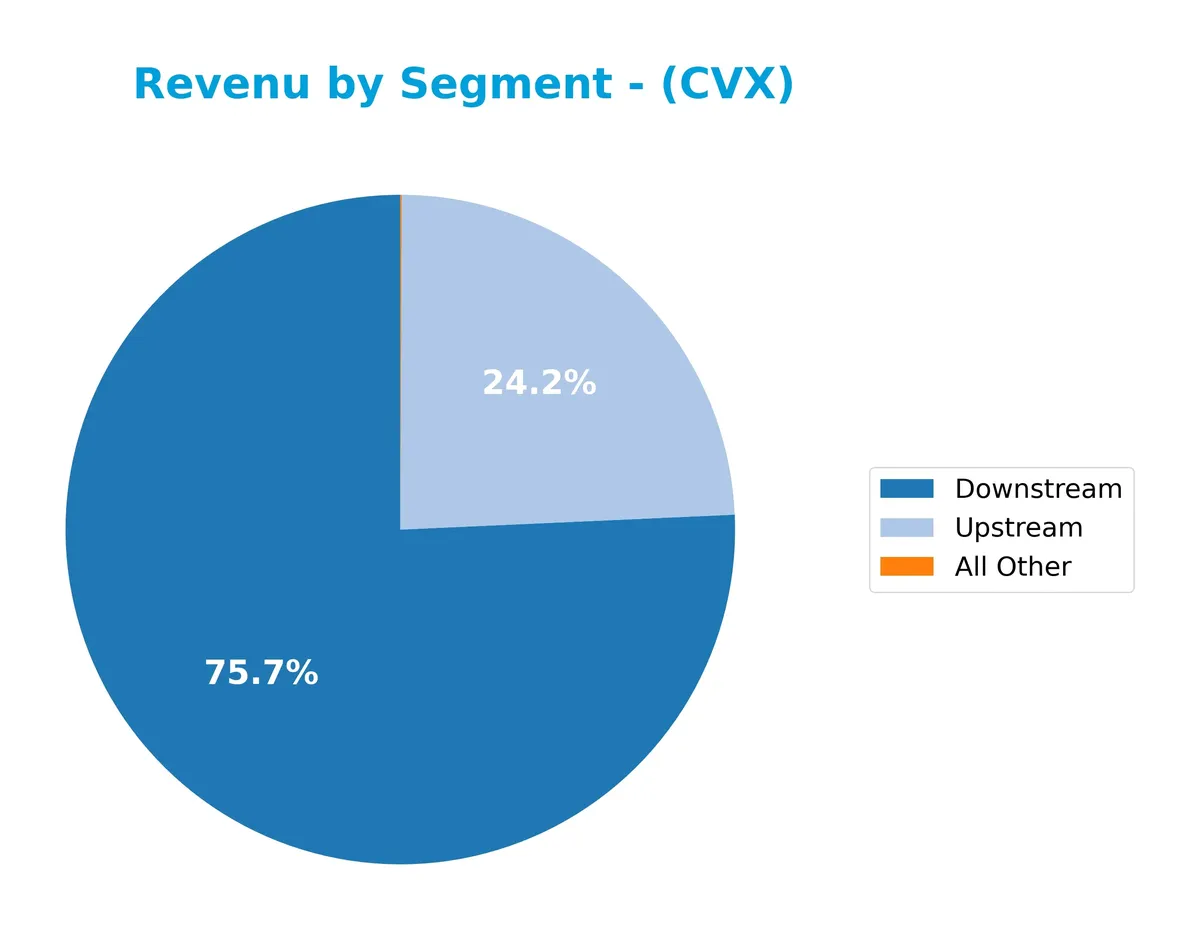
Chevron’s revenue in 2025 is led by Downstream at 72.5B, nearly 60% higher than Upstream’s 45.5B. Downstream remains the dominant driver despite a sharp pullback from prior years above 140B. Upstream revenue shows a modest decline from its 2022 peak of 63.3B, signaling some pressure in exploration or production. Other segments contribute less than 1B, representing minimal impact and concentration risk focused on core operations.
Key Products & Brands
Chevron Corporation operates key product lines and brands across its integrated energy and chemicals segments as follows:
| Product | Description |
|---|---|
| Upstream | Exploration, development, production, and transportation of crude oil and natural gas. |
| Downstream | Refining crude oil into petroleum products, marketing, and manufacturing of fuels and lubricants. |
| All Other Segments | Includes gas-to-liquids plants, petrochemicals, plastics, fuel additives, and technology businesses. |
Chevron’s portfolio spans upstream resource extraction and downstream refining and marketing. The company also operates niche chemical and technology units, reflecting a broad energy value chain presence.
Main Competitors
In the Energy sector’s Oil & Gas Integrated industry, there are 2 main competitors; the table below lists the top 2 leaders by market capitalization:
| Competitor | Market Cap. |
|---|---|
| Exxon Mobil Corporation | 517B |
| Chevron Corporation | 312B |
Chevron Corporation ranks 2nd among 2 competitors. Its market cap is 71.65% of the leader Exxon Mobil. Chevron sits below both the average market cap of the top 10 (414B) and the sector median (414B). It maintains a 39.57% gap below Exxon Mobil, its closest rival above.
Comparisons with competitors
Check out how we compare the company to its competitors:
Does Chevron have a competitive advantage?
Chevron does not present a competitive advantage as it is shedding value with a ROIC well below its WACC and a sharply declining profitability trend from 2021 to 2025. Its income statement shows several unfavorable growth metrics, including falling net margin and earnings per share.
Looking ahead, Chevron’s integrated operations in upstream and downstream segments offer exposure to diverse energy markets. However, recent revenue declines and value destruction signal challenges in capital efficiency and sustaining economic profits.
SWOT Analysis
This SWOT analysis highlights Chevron Corporation’s critical internal and external factors shaping its strategic outlook.
Strengths
- Strong global brand
- Diverse upstream and downstream operations
- Solid dividend yield at 4.22%
Weaknesses
- Declining ROIC below WACC
- Negative net income growth trend
- Weak liquidity ratios (current and quick)
Opportunities
- Expansion in renewable fuels
- Growing international energy demand
- Pipeline and infrastructure investments
Threats
- Volatile oil prices
- Regulatory pressures on fossil fuels
- Increasing competition from renewables
Chevron’s strengths in integrated operations and yield support its resilience. However, value destruction and liquidity concerns require cautious capital allocation. Growth hinges on seizing renewable energy opportunities while managing commodity and regulatory risks.
Stock Price Action Analysis
The weekly stock chart illustrates Chevron Corporation’s price movements and volume patterns over the past 12 months:
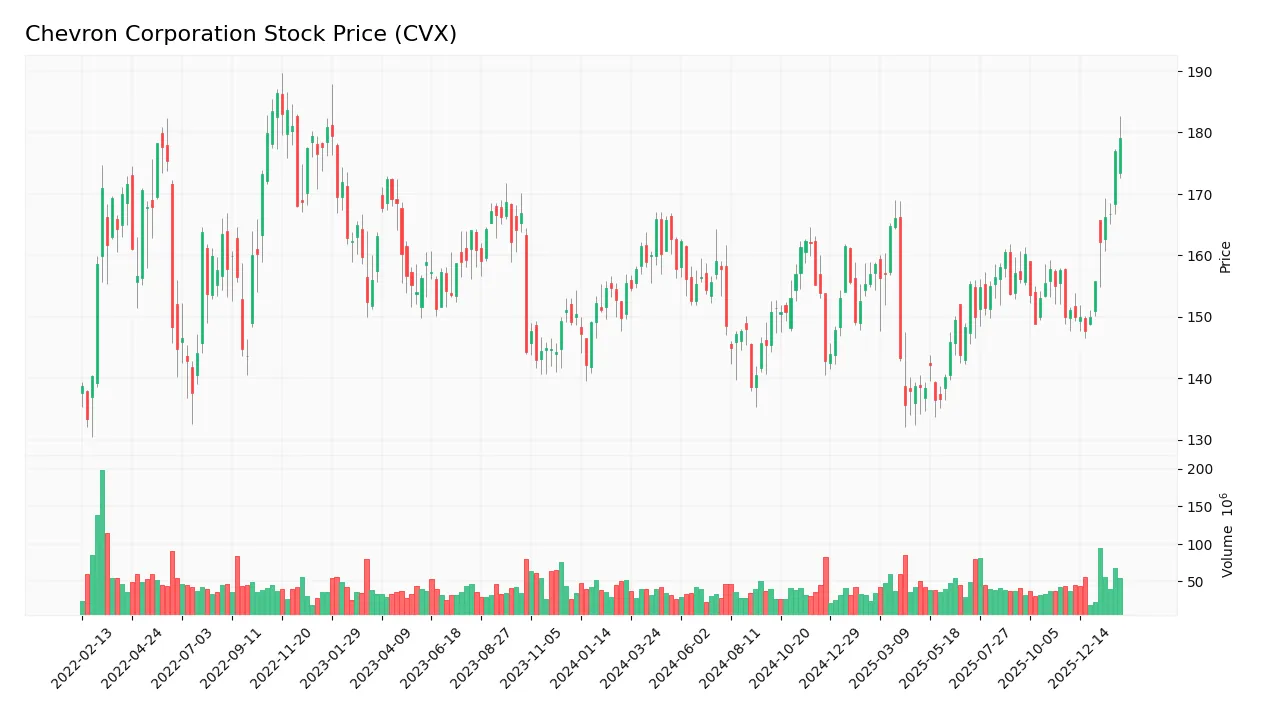
Trend Analysis
Over the past 12 months, CVX’s stock price rose 14.69%, signaling a bullish trend with acceleration. The price ranged between 135.63 and a high of 185.34. Volatility is moderate, with a standard deviation of 9.81, confirming dynamic but steady upward momentum.
Volume Analysis
In the last three months, trading volumes increased with strong buyer dominance at 82.42%. Buyers accounted for 472M shares versus 101M sellers, indicating robust demand and heightened investor participation. The rising volume trend supports positive sentiment around CVX shares.
Target Prices
Analysts present a robust target consensus for Chevron Corporation, reflecting confidence in its growth prospects.
| Target Low | Target High | Consensus |
|---|---|---|
| 160 | 212 | 184.54 |
The target range from $160 to $212 indicates a bullish outlook, with a consensus price of $184.54 signaling moderate upside potential.

Don’t Let Luck Decide Your Entry Point
Optimize your entry points with our advanced ProRealTime indicators. You’ll get efficient buy signals with precise price targets for maximum performance. Start outperforming now!
Analyst & Consumer Opinions
This section reviews Chevron Corporation’s analyst ratings and consumer feedback to provide a balanced assessment of its market standing.
Stock Grades
Below is a summary of recent stock grades for Chevron Corporation from recognized financial institutions:
| Grading Company | Action | New Grade | Date |
|---|---|---|---|
| Wells Fargo | Maintain | Overweight | 2026-02-02 |
| Morgan Stanley | Maintain | Overweight | 2026-01-23 |
| Barclays | Maintain | Equal Weight | 2026-01-21 |
| Jefferies | Maintain | Buy | 2026-01-14 |
| Piper Sandler | Maintain | Overweight | 2026-01-08 |
| Freedom Capital Markets | Downgrade | Sell | 2026-01-06 |
| Bernstein | Maintain | Market Perform | 2026-01-05 |
| Citigroup | Maintain | Buy | 2026-01-05 |
| Mizuho | Maintain | Outperform | 2025-12-12 |
| B of A Securities | Maintain | Buy | 2025-12-11 |
The majority of institutions maintain a positive stance, favoring Buy or Overweight ratings. Notably, Freedom Capital Markets stands alone with a Sell downgrade, indicating some divergence in investor sentiment.
Consumer Opinions
Chevron Corporation enjoys a mixed but generally favorable reception from its customers, reflecting its strong market presence and operational challenges.
| Positive Reviews | Negative Reviews |
|---|---|
| Reliable fuel quality and availability | High fuel prices compared to competitors |
| Strong commitment to environmental initiatives | Customer service response times need improvement |
| Consistent performance in energy supply | Limited electric vehicle charging options |
Overall, consumers praise Chevron for dependable products and environmental efforts. However, pricing and service responsiveness remain common concerns, suggesting areas for improvement in customer experience.
Risk Analysis
Below is a summary of key risks Chevron Corporation faces, including likelihood and potential impact:
| Category | Description | Probability | Impact |
|---|---|---|---|
| Commodity Prices | Volatility in oil and gas prices can sharply affect revenues and margins. | High | High |
| Regulatory Risk | Stricter environmental regulations may increase costs and limit operations. | Medium | High |
| Operational Risk | Accidents or disruptions in upstream or downstream operations could occur. | Medium | Medium |
| Financial Health | Low current and quick ratios signal potential liquidity constraints. | Medium | Medium |
| Market Valuation | Elevated P/E and P/B ratios suggest valuation risks amid sector cyclicality. | Medium | Medium |
Commodity price swings remain the most significant threat, given Chevron’s upstream exposure. Regulatory tightening on emissions globally also poses a growing cost risk. Liquidity ratios at 1.0 and 0.76 are red flags for working capital pressure. However, a strong Altman Z-score of 3.29 places Chevron in a safe zone against bankruptcy risk.
Should You Buy Chevron Corporation?
Chevron appears to be a company with moderate profitability and a deteriorating competitive moat, as declining ROIC suggests value destruction. Its leverage profile remains manageable, supporting a solid B rating, though valuation metrics could be seen as less favorable.
Strength & Efficiency Pillars
Chevron Corporation maintains operational resilience with an EBIT margin of 11.21% and a net margin of 6.62%, reflecting solid profitability. The company’s interest expense stands favorably low at 0.65%, underscoring effective financial cost control. Despite these strengths, Chevron’s return on invested capital (ROIC) at 2.42% falls below its weighted average cost of capital (WACC) of 6.56%, indicating it is currently destroying value rather than creating it. This gap signals challenges in capital efficiency, diminishing its competitive moat.
Weaknesses and Drawbacks
Chevron’s valuation metrics suggest caution; a price-to-earnings ratio of 24.49 and a price-to-book ratio of 1.63 are neutral but not compelling bargains given recent performance. Liquidity ratios raise red flags: a current ratio of 1.0 and quick ratio of 0.76 signal tight short-term financial flexibility. Additionally, declining profitability trends—net margin growth down by 34.05% overall—highlight operational pressures. Although debt-to-equity at 0.22 is favorable, the lack of margin expansion limits upside potential in a volatile energy sector.
Our Final Verdict about Chevron Corporation
Chevron’s profile appears mixed. The company operates within a safe solvency zone (Altman Z-Score 3.29), but its declining ROIC and deteriorating profitability suggest structural efficiency issues. Despite a bullish stock trend with strong buyer dominance recently, these fundamental headwinds imply that Chevron might appear suitable for investors seeking exposure with caution. A measured approach could reveal better entry points as operational improvements manifest.
Disclaimer: This content is for informational purposes only and does not constitute financial, investment, or other professional advice. Investing in financial markets involves a significant risk of loss, and past performance is not indicative of future results.
Additional Resources
- Chevron Corporation $CVX Shares Sold by Bradley Foster & Sargent Inc. CT – MarketBeat (Feb 25, 2026)
- Chevron: Forming A Strong Partner With Hess (NYSE:CVX) – Seeking Alpha (Feb 24, 2026)
- Chevron (CVX)’s the Only Company I Would Buy Here, Says Jim Cramer – Yahoo Finance (Feb 24, 2026)
- Decoding Chevron Corp (CVX): A Strategic SWOT Insight – GuruFocus (Feb 25, 2026)
- Is Chevron (CVX) Priced Fairly After Its Strong Recent Share Price Run? – simplywall.st (Feb 25, 2026)
For more information about Chevron Corporation, please visit the official website: chevron.com