Home > Analyses > Communication Services > Charter Communications, Inc.
Charter Communications redefines how millions connect, work, and entertain themselves every day. As a titan in U.S. broadband and cable services, it commands a vast network delivering high-speed internet, TV, and voice to 32 million customers. Known for innovation and reliability, Charter shapes the future of digital communication. Yet, with evolving technology and fierce competition, I question whether its current fundamentals justify its lofty market valuation and growth outlook.

Table of contents
Business Model & Company Overview
Charter Communications, Inc., founded in 1993 and based in Stamford, Connecticut, stands as a dominant player in the U.S. telecommunications sector. Serving 32M customers across 41 states, it delivers a seamless ecosystem of broadband connectivity and cable services. Its core mission unites subscription video, high-speed Internet, and voice communications into one integrated platform that drives customer engagement and loyalty.
The company’s revenue engine blends hardware—such as advanced WiFi routers—with subscription-based software services like security suites and video on demand. Charter commands a stronghold primarily in the Americas, offering scalable broadband solutions to residential and commercial clients. Its competitive advantage lies in this diversified service mix and expansive network, which fortifies Charter’s economic moat and shapes the future of digital connectivity.
Financial Performance & Fundamental Metrics
I analyze Charter Communications’ income statement, key financial ratios, and dividend payout policy to assess its profitability, efficiency, and shareholder returns.
Income Statement
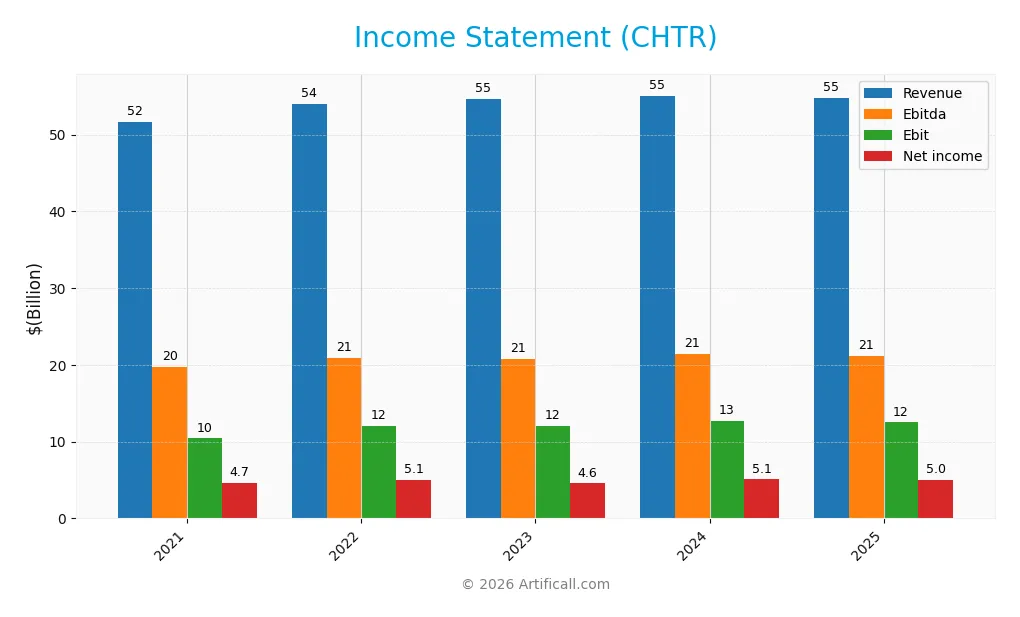
Below is Charter Communications, Inc.’s income statement summary for the past five fiscal years, showing key profitability and expense figures in USD.
| 2021 | 2022 | 2023 | 2024 | 2025 | |
|---|---|---|---|---|---|
| Revenue | 51.7B | 54.0B | 54.6B | 55.1B | 54.8B |
| Cost of Revenue | 31.1B | 30.6B | 33.3B | 29.8B | 29.4B |
| Operating Expenses | 9.8B | 11.2B | 8.8B | 12.1B | 12.0B |
| Gross Profit | 20.6B | 23.4B | 21.3B | 25.3B | 25.4B |
| EBITDA | 19.8B | 20.9B | 20.7B | 21.4B | 21.2B |
| EBIT | 10.4B | 12.0B | 12.0B | 12.7B | 12.5B |
| Interest Expense | 4.0B | 4.6B | 5.2B | 5.2B | 5.0B |
| Net Income | 4.7B | 5.1B | 4.6B | 5.1B | 5.0B |
| EPS | 25.3 | 31.3 | 30.5 | 35.5 | 36.9 |
| Filing Date | 2022-01-28 | 2023-01-27 | 2024-02-02 | 2025-01-31 | 2026-01-30 |
Income Statement Evolution
From 2021 to 2025, Charter’s revenue showed a modest 6% growth, with a slight decline of 0.56% in the last year. Gross profit remained stable, reflecting consistent gross margins near 46%. Operating expenses grew proportionally, keeping EBIT margins steady around 23%. Net income rose by 7% overall, though it dipped slightly in 2025, indicating some margin pressure.
Is the Income Statement Favorable?
The 2025 income statement shows stable fundamentals, with a favorable gross margin of 46.3% and an EBIT margin of 22.8%. Net margin at 9.1% remains healthy despite a 0.56% revenue drop and a 1.8% EBIT decline year-over-year. Interest expense consumes 9.2% of revenue, a neutral factor, while EPS growth of 3.5% signals operational efficiency amidst slight top-line softness.
Financial Ratios
The following table presents key financial ratios for Charter Communications, Inc. over the last five fiscal years, reflecting profitability, valuation, liquidity, leverage, and efficiency metrics:
| Ratios | 2021 | 2022 | 2023 | 2024 | 2025 |
|---|---|---|---|---|---|
| Net Margin | 9.0% | 9.4% | 8.3% | 9.2% | 9.1% |
| ROE | 33.1% | 55.4% | 41.1% | 32.6% | 31.1% |
| ROIC | 6.8% | 7.1% | 7.0% | 7.4% | 7.3% |
| P/E | 25.7 | 10.8 | 12.7 | 9.6 | 5.7 |
| P/B | 8.5 | 6.0 | 5.2 | 3.1 | 1.8 |
| Current Ratio | 0.29 | 0.33 | 0.31 | 0.31 | 0.39 |
| Quick Ratio | 0.29 | 0.33 | 0.31 | 0.31 | 0.39 |
| D/E | 6.5 | 10.7 | 8.9 | 6.1 | 5.9 |
| Debt-to-Assets | 64.4% | 67.7% | 66.7% | 63.8% | 61.4% |
| Interest Coverage | 2.7 | 2.7 | 2.4 | 2.5 | 2.6 |
| Asset Turnover | 0.36 | 0.37 | 0.37 | 0.37 | 0.36 |
| Fixed Asset Turnover | 1.51 | 1.50 | 1.38 | 1.28 | 1.18 |
| Dividend Yield | 0% | 0% | 0% | 0% | 0% |
Evolution of Financial Ratios
Charter Communications’ Return on Equity (ROE) improved from 33.1% in 2021 to 31.1% in 2025, showing strong profitability with some volatility. The Current Ratio remained consistently low, around 0.3 to 0.4, indicating tight liquidity. The Debt-to-Equity Ratio declined from 8.86 in 2023 to 5.9 in 2025, reflecting a modest reduction in leverage.
Are the Financial Ratios Favorable?
In 2025, Charter shows favorable ROE at 31.06% and a low Price-to-Earnings ratio of 5.66, indicating attractive valuation versus the market. However, liquidity ratios like Current and Quick Ratios are below 1.0, signaling potential short-term risk. High Debt-to-Equity (5.9) and Debt-to-Assets (61.4%) ratios raise leverage concerns. Overall, the ratio profile appears slightly unfavorable due to liquidity and debt pressures.
Shareholder Return Policy
Charter Communications, Inc. does not pay dividends, reflecting a reinvestment strategy focused on growth rather than immediate shareholder payouts. The company’s dividend payout ratio and yield remain at zero, while no share buyback programs are indicated in the data.
This approach aligns with reinvesting free cash flow, which averaged around 27% of operating cash flow, to support operations and capital expenditures. The absence of dividends and buybacks suggests a priority on long-term value creation through growth investments rather than short-term shareholder distributions.
Score analysis
The radar chart below offers a comprehensive view of Charter Communications’ valuation and financial strength scores:
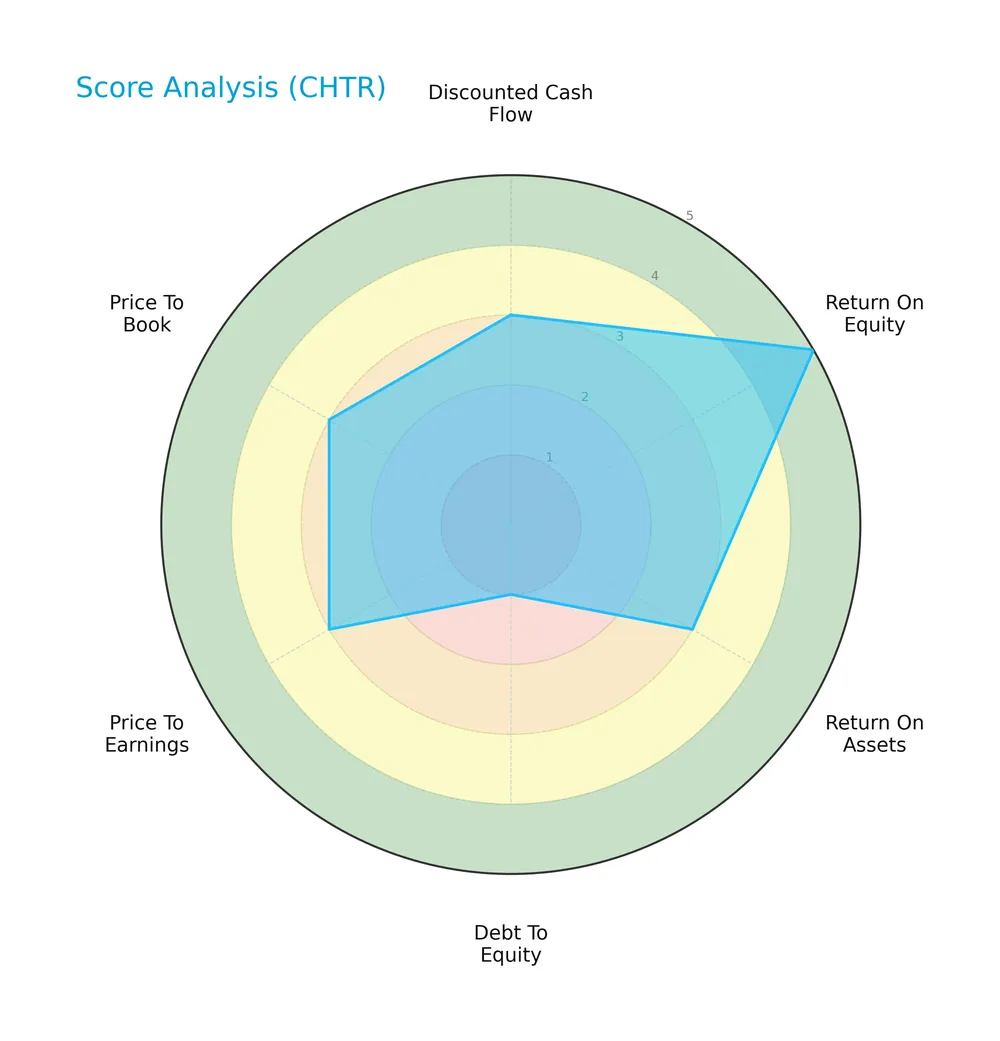
Charter scores very favorably on return on equity with a top mark of 5. Other metrics like discounted cash flow, return on assets, price-to-earnings, and price-to-book show moderate strength at 3. The debt-to-equity score is very unfavorable, marked at 1, signaling leverage concerns.
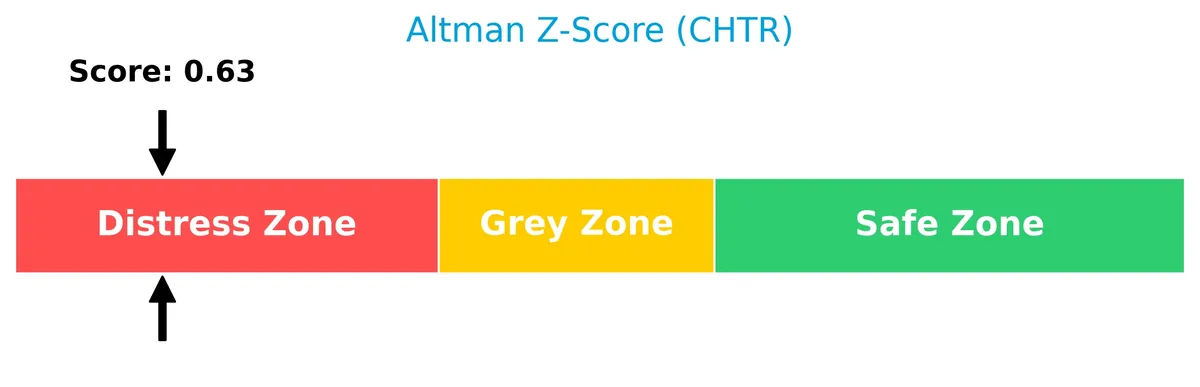
Analysis of the company’s bankruptcy risk
Charter Communications’ Altman Z-Score places it firmly in the distress zone, indicating a high risk of financial distress and potential bankruptcy:
Is the company in good financial health?
The Piotroski Score diagram illustrates Charter’s moderate financial health status based on nine key criteria:
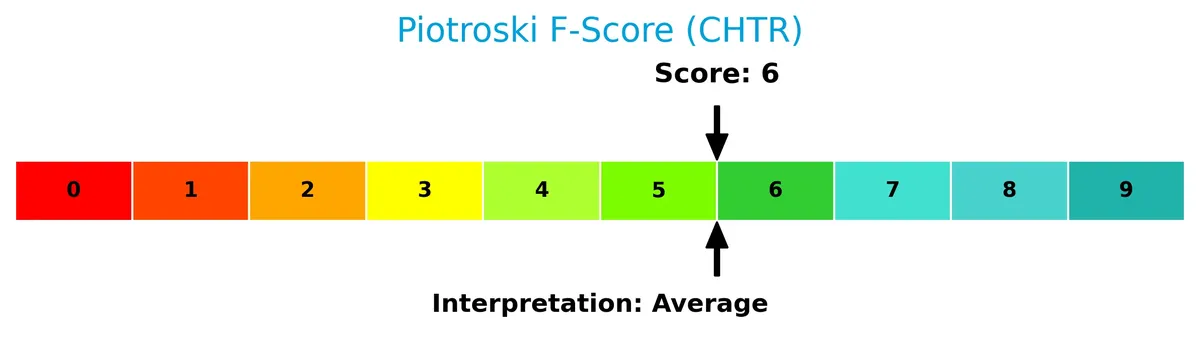
With a Piotroski Score of 6, Charter falls into the average category. This suggests reasonable financial strength, though not enough to classify the company as strongly healthy or highly resilient.
Competitive Landscape & Sector Positioning
This sector analysis examines Charter Communications, Inc.’s strategic positioning, revenue segments, key products, and main competitors. I will assess whether Charter holds a competitive advantage over its peers in the telecommunications services industry.
Strategic Positioning
Charter Communications concentrates on residential broadband, video, and mobile services, generating over $42B in residential revenue. It complements this with $7.3B commercial services and $1.5B advertising sales. The company operates exclusively in the U.S., serving 32M customers across 41 states.
Revenue by Segment
This pie chart illustrates Charter Communications’ revenue breakdown by product segment for fiscal year 2025, highlighting the company’s diverse income sources.
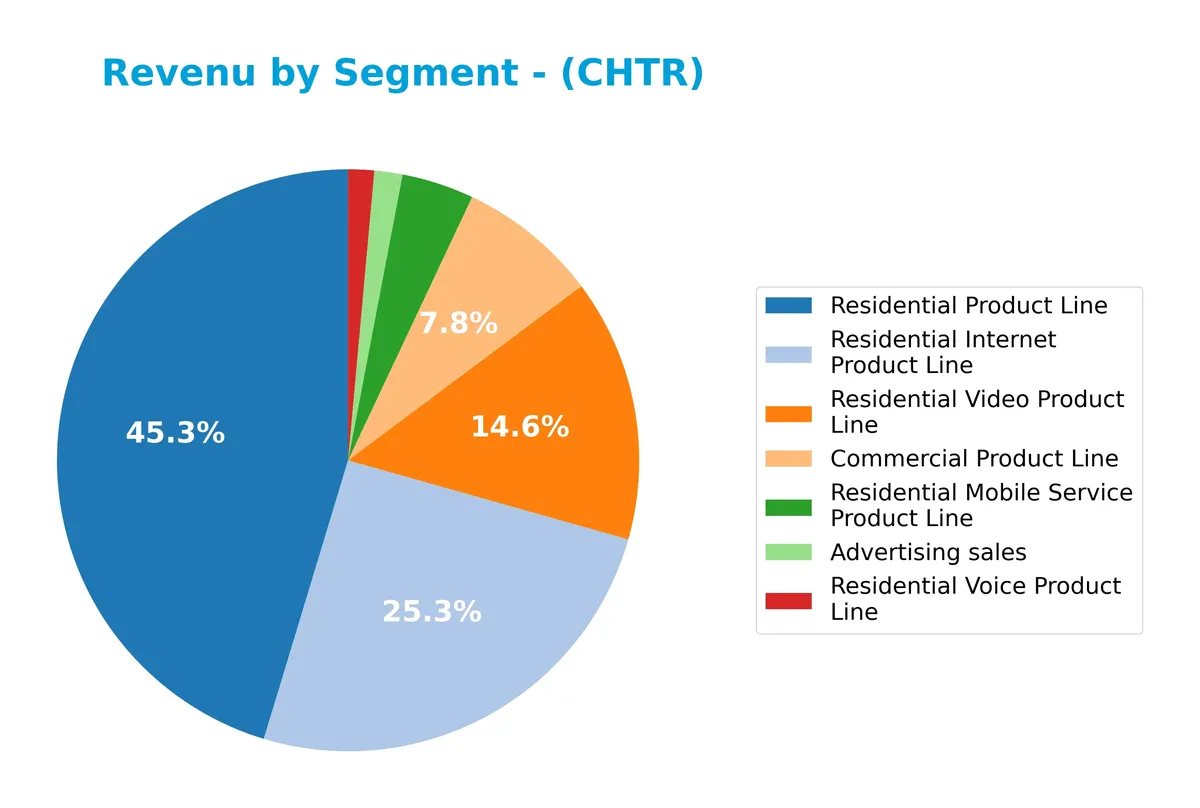
Residential Product Line dominates with $42.6B, led by Residential Internet at $23.8B and Residential Video at $13.7B. Commercial Product Line contributes $7.3B, while Residential Mobile Service adds $3.8B. Advertising sales and Residential Voice are smaller but steady. The 2025 data shows slight shifts with Residential Internet growing moderately, but Advertising sales declined, signaling potential concentration risk in core residential services.
Key Products & Brands
Charter Communications generates revenue from diverse telecommunications products and advertising services as detailed below:
| Product | Description |
|---|---|
| Residential Internet Product Line | High-speed internet services for residential customers, including security suites and in-home WiFi. |
| Residential Video Product Line | Subscription-based video services, including HD TV, video on demand, DVR, and pay-per-view. |
| Residential Voice Product Line | Voice communication services using VoIP technology for residential customers. |
| Residential Mobile Service Product Line | Mobile telecommunications services targeted at residential subscribers. |
| Residential Product Line | Aggregate of all residential offerings including internet, video, voice, and mobile services. |
| Commercial Product Line | Broadband, data networking, fiber connectivity, and business telephone services for commercial clients. |
| Advertising Sales | Revenue from local and network advertising across various platforms including regional sports networks. |
Charter’s product mix reflects a strong focus on residential internet and video services, complemented by commercial offerings and advertising revenue streams. This breadth supports its position in the U.S. telecommunications sector.
Main Competitors
There are 5 main competitors in the Telecommunications Services industry; the table lists the top 10 leaders by market capitalization:
| Competitor | Market Cap. |
|---|---|
| T-Mobile US, Inc. | 223B |
| AT&T Inc. | 174B |
| Verizon Communications Inc. | 171B |
| Comcast Corporation | 108B |
| Charter Communications, Inc. | 29B |
Charter Communications ranks 5th among its competitors with a market cap at 12.8% of the leader, T-Mobile US. It sits below both the average market cap of the top 10 (141B) and the sector median (171B). The company maintains a significant 276% gap to Comcast, its nearest competitor above.
Comparisons with competitors
Check out how we compare the company to its competitors:
Does CHTR have a competitive advantage?
Charter Communications demonstrates a clear competitive advantage, evidenced by a very favorable moat status. Its ROIC exceeds WACC by 2.47%, signaling efficient capital use and consistent value creation.
Looking ahead, Charter leverages its broadband, video, and communication services across 41 states. Opportunities lie in expanding mobile services, enhanced WiFi solutions, and advertising on regional sports and news networks.
SWOT Analysis
This SWOT analysis highlights Charter Communications’ core internal capabilities and external market factors shaping its strategic positioning.
Strengths
- strong ROE at 31%
- favorable gross and EBIT margins
- growing ROIC indicating value creation
Weaknesses
- high debt-to-equity ratio at 5.9
- low current and quick ratios at 0.39
- declining revenue growth in recent year
Opportunities
- expansion in broadband and mobile services
- rising demand for digital video and WiFi solutions
- potential growth in business and wholesale segments
Threats
- intense competition in telecom sector
- regulatory pressures on pricing
- technological disruption from streaming alternatives
Charter demonstrates a solid profitability base and a sustainable competitive advantage. However, its heavy leverage and liquidity constraints pose risks. The company should leverage growth opportunities in broadband and mobile while carefully managing debt and competitive threats.
Stock Price Action Analysis
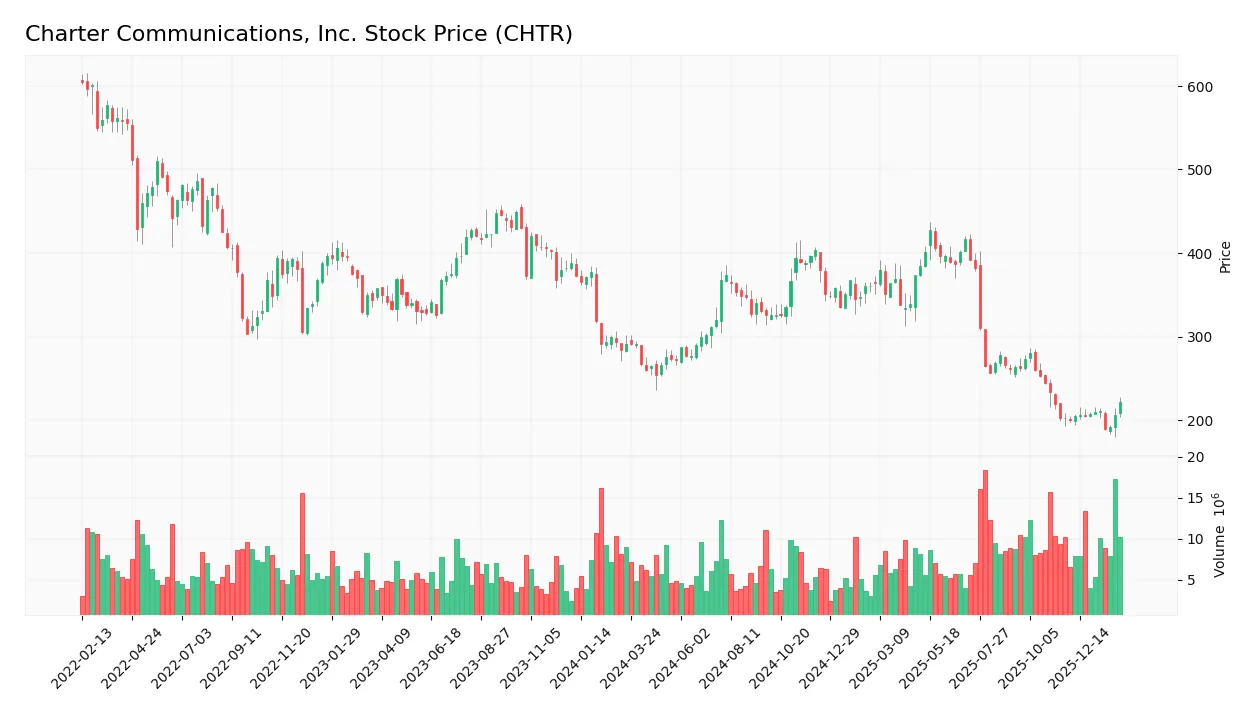
The weekly stock chart of Charter Communications, Inc. highlights recent price fluctuations and notable support and resistance levels:
Trend Analysis
Over the past 12 months, Charter Communications’ stock declined by 23.91%, signaling a bearish trend with accelerating downward momentum. The price ranged from a high of 427.25 to a low of 189.76, reflecting significant volatility with a standard deviation of 63.75.
Volume Analysis
Trading volume has increased recently, with buyer activity dominating in the last three months at 64.39%. This buyer-driven volume rise suggests growing investor interest and market participation despite the broader bearish trend.
Target Prices
Analysts present a clear consensus on Charter Communications’ price potential.
| Target Low | Target High | Consensus |
|---|---|---|
| 160 | 500 | 308 |
The target range spans from 160 to 500, with a consensus near 308, reflecting bullish long-term growth expectations despite some valuation dispersion.

Don’t Let Luck Decide Your Entry Point
Optimize your entry points with our advanced ProRealTime indicators. You’ll get efficient buy signals with precise price targets for maximum performance. Start outperforming now!
Analyst & Consumer Opinions
This section reviews analyst ratings and consumer feedback related to Charter Communications, Inc. (CHTR) for a comprehensive perspective.
Stock Grades
The following table presents the latest verified stock grades from leading financial institutions for Charter Communications, Inc.:
| Grading Company | Action | New Grade | Date |
|---|---|---|---|
| Deutsche Bank | Maintain | Hold | 2026-02-03 |
| Benchmark | Maintain | Buy | 2026-02-02 |
| Wells Fargo | Maintain | Underweight | 2026-02-02 |
| Goldman Sachs | Maintain | Sell | 2026-02-02 |
| Bernstein | Maintain | Market Perform | 2026-01-16 |
| Wells Fargo | Downgrade | Underweight | 2026-01-13 |
| UBS | Maintain | Neutral | 2025-12-22 |
| Barclays | Maintain | Underweight | 2025-11-03 |
| Citigroup | Maintain | Buy | 2025-11-03 |
| Bernstein | Downgrade | Market Perform | 2025-11-03 |
Grades reveal a fragmented outlook with a slight bias toward caution. Multiple downgrades and underweight ratings coexist alongside stable buy recommendations, reflecting mixed analyst sentiment.
Consumer Opinions
Consumer sentiment around Charter Communications, Inc. (CHTR) reveals a mix of appreciation and frustration among users.
| Positive Reviews | Negative Reviews |
|---|---|
| Reliable high-speed internet with minimal downtime. | Customer service response times are slow and often unhelpful. |
| Competitive pricing compared to other cable providers. | Frequent billing errors causing confusion and delays. |
| Wide coverage area providing access in suburban and rural locations. | Installation delays and technician no-shows are common complaints. |
Overall, customers praise Charter’s network reliability and pricing but consistently flag poor customer service and operational inefficiencies as key pain points. Addressing these could improve brand loyalty significantly.
Risk Analysis
Below is a summary of key risks facing Charter Communications, Inc., assessing their likelihood and potential impact:
| Category | Description | Probability | Impact |
|---|---|---|---|
| Financial Leverage | High debt level with debt-to-assets at 61.44%, raising solvency risks | High | High |
| Liquidity | Low current and quick ratios (0.39) indicate tight short-term liquidity | High | Medium |
| Bankruptcy Risk | Altman Z-Score of 0.63 places the company in the distress zone | Medium | High |
| Profitability | Moderate net margin (9.1%) but strong ROE (31.06%) | Medium | Medium |
| Market Volatility | Beta of 1.05 suggests stock price closely follows market swings | Medium | Medium |
| Dividend Policy | No dividend yield, which may deter income-focused investors | Low | Low |
Charter’s highest risks stem from its heavy leverage and weak liquidity. Its Altman Z-Score signals financial distress, a red flag in this capital-intensive telecom sector. Despite strong ROE, the balance sheet’s fragile structure demands caution.
Should You Buy Charter Communications, Inc.?
Charter Communications appears to have a durable competitive moat supported by growing ROIC and solid value creation. While profitability seems robust, the debt profile raises concerns with substantial leverage. Overall, the company’s rating suggests a B+ profile with moderate financial strength.
Strength & Efficiency Pillars
Charter Communications, Inc. exhibits solid profitability with a return on equity of 31.06% and a net margin of 9.1%. The company’s ROIC stands at 7.27%, comfortably above its WACC of 4.8%, confirming that it is a clear value creator. Despite a moderate Piotroski score of 6, indicating average financial strength, the firm’s growing ROIC trend signals a sustainable competitive advantage. These efficiency pillars underscore Charter’s capacity to generate value amid industry pressures.
Weaknesses and Drawbacks
Charter faces significant financial risks. Its Altman Z-score of 0.63 places it deep in the distress zone, raising bankruptcy concerns. High leverage is evident with a debt-to-equity ratio of 5.9 and a debt-to-assets ratio of 61.44%, both flagged as very unfavorable. Liquidity is strained with a current ratio of 0.39, far below safe thresholds. Additionally, the stock’s 23.91% price drop reflects bearish sentiment, despite recent buyer dominance, adding short-term volatility risks.
Our Verdict about Charter Communications, Inc.
Charter’s long-term fundamental profile appears favorable, supported by value creation and strong profitability metrics. However, the stock’s overall bearish trend tempers enthusiasm. Given recent buyer dominance and an improving short-term trend, the company might appear attractive for investors willing to navigate financial leverage risks. Despite long-term strength, caution suggests a wait-and-see approach for a better entry point.
Disclaimer: This content is for informational purposes only and does not constitute financial, investment, or other professional advice. Investing in financial markets involves a significant risk of loss, and past performance is not indicative of future results.
Additional Resources
- Optimize Financial Inc Buys Shares of 5,660 Charter Communications, Inc. $CHTR – MarketBeat (Feb 04, 2026)
- Charter Announces Fourth Quarter and Full Year 2025 Results – Charter Communications (Jan 30, 2026)
- Charter Communications: Way Too Cheap At 6x P/E (Upgrade) (NASDAQ:CHTR) – Seeking Alpha (Feb 02, 2026)
- Charter Communications, Inc. (CHTR): A Bull Case Theory – Yahoo Finance (Jan 15, 2026)
- Charter Communications Inc (CHTR): A Strategic SWOT Insight – GuruFocus (Jan 31, 2026)
For more information about Charter Communications, Inc., please visit the official website: corporate.charter.com