Home > Analyses > Healthcare > Charles River Laboratories International, Inc.
Charles River Laboratories shapes the future of drug discovery by powering critical research with precision and scale. Its leadership in non-clinical contract research spans innovative animal models, safety testing, and manufacturing solutions, enabling pharmaceutical breakthroughs worldwide. Known for rigorous quality and scientific expertise, Charles River transforms early-stage science into viable therapies. As the healthcare landscape evolves, I ask: does Charles River’s robust foundation still justify its growth ambitions and current valuation?

Table of contents
Business Model & Company Overview
Charles River Laboratories International, Inc. is a leading non-clinical contract research organization founded in 1947 and headquartered in Wilmington, Massachusetts. It dominates the medical diagnostics and research sector by offering an integrated ecosystem of research models, discovery services, and manufacturing solutions. Its core mission centers on accelerating drug discovery and safety testing through comprehensive preclinical support, enabling clients to advance therapeutic innovations efficiently.
The company generates value by balancing its three segments: Research Models and Services, Discovery and Safety Assessment, and Manufacturing Solutions. This diversified revenue engine spans the Americas, Europe, and Asia Pacific, delivering research models, toxicology services, and specialized biologics testing. Its competitive advantage lies in this global footprint combined with deep scientific expertise, creating a robust economic moat that shapes the future of pharmaceutical development worldwide.
Financial Performance & Fundamental Metrics
I analyze Charles River Laboratories International, Inc.’s income statement, key financial ratios, and dividend payout policy to assess its core financial health and growth potential.
Income Statement
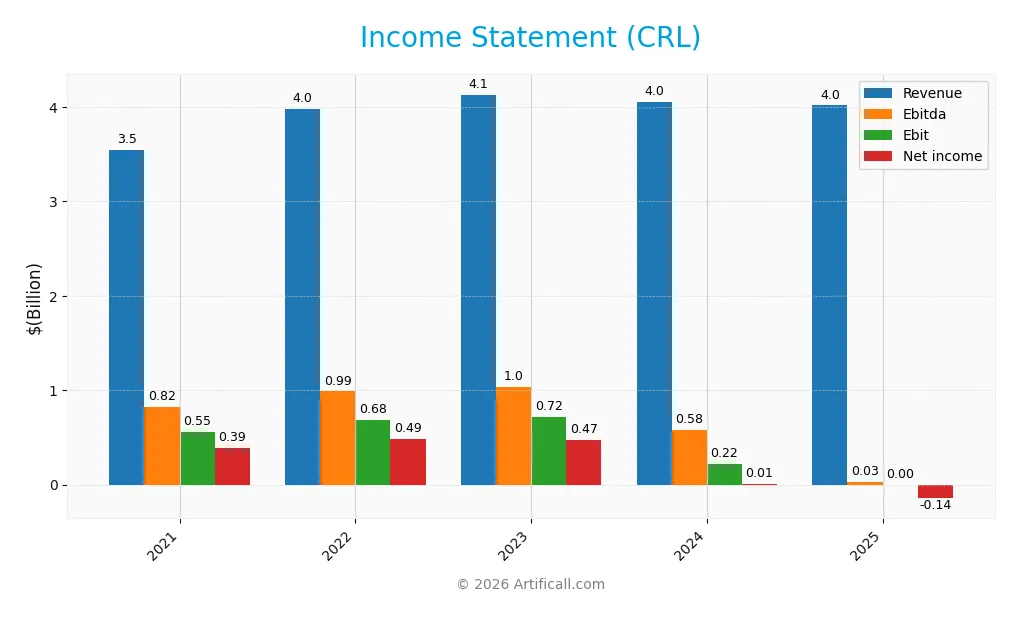
The table below summarizes Charles River Laboratories International, Inc.’s key income statement metrics for the fiscal years 2021 through 2025, reported in USD.
| 2021 | 2022 | 2023 | 2024 | 2025 | |
|---|---|---|---|---|---|
| Revenue | 3.54B | 3.98B | 4.13B | 4.05B | 4.02B |
| Cost of Revenue | 2.21B | 2.51B | 2.63B | 2.72B | 0 |
| Operating Expenses | 745M | 812M | 885M | 1.10B | 743M |
| Gross Profit | 1.33B | 1.46B | 1.50B | 1.33B | 0 |
| EBITDA | 820M | 986M | 1.03B | 581M | 25M |
| EBIT | 555M | 682M | 718M | 219M | 0 |
| Interest Expense | 74M | 59M | 137M | 126M | 107M |
| Net Income | 391M | 486M | 475M | 10M | -144M |
| EPS | 7.77 | 9.57 | 9.27 | 0.20 | -2.91 |
| Filing Date | 2022-02-16 | 2023-02-22 | 2024-02-14 | 2025-02-19 | 2026-02-18 |
Income Statement Evolution
Charles River Laboratories’ revenue grew 13.4% from 2021 to 2025 but declined 0.85% in the latest year. Net income fell sharply over the period, with a steep drop in 2025 to a loss of 144M. Margins deteriorated significantly; gross and EBIT margins collapsed to zero in 2025, signaling operational challenges.
Is the Income Statement Favorable?
The 2025 income statement reveals unfavorable fundamentals. Despite stable operating expenses relative to revenue, the company reported a 3.6% negative net margin and heavy interest expenses. Earnings per share turned negative at -2.91, reflecting profitability pressures. Overall, 79% of income statement metrics rate unfavorably, indicating weak financial health this fiscal year.
Financial Ratios
The table below presents key financial ratios for Charles River Laboratories International, Inc. over the last five fiscal years:
| Ratios | 2021 | 2022 | 2023 | 2024 | 2025 |
|---|---|---|---|---|---|
| Net Margin | 11% | 12% | 11% | 0.25% | -3.6% |
| ROE | 15% | 16% | 13% | 0.3% | -4.6% |
| ROIC | 8.1% | 7.9% | 7.1% | 0.9% | 4.7% |
| P/E | 48.5 | 22.8 | 25.5 | 929 | -69.9 |
| P/B | 7.48 | 3.72 | 3.37 | 2.76 | 3.19 |
| Current Ratio | 1.23 | 1.32 | 1.52 | 1.41 | 1.29 |
| Quick Ratio | 1.04 | 1.08 | 1.16 | 1.13 | 1.02 |
| D/E | 1.26 | 1.04 | 0.85 | 0.79 | 0.81 |
| Debt-to-Assets | 46% | 41% | 37% | 36% | 36% |
| Interest Coverage | 8.0 | 11.0 | 4.5 | 1.8 | -2.7 |
| Asset Turnover | 0.50 | 0.52 | 0.50 | 0.54 | 0.56 |
| Fixed Asset Turnover | 2.23 | 2.14 | 2.03 | 2.01 | 1.99 |
| Dividend Yield | 0% | 0% | 0% | 0% | 0% |
Evolution of Financial Ratios
From 2021 to 2025, Charles River Laboratories’ Return on Equity (ROE) declined sharply, turning negative at -4.56% in 2025. The Current Ratio showed moderate fluctuation, remaining above 1.2, indicating stable liquidity. Debt-to-Equity Ratio improved slightly, dropping from 1.26 to about 0.81, reflecting modest deleveraging amid weakening profitability.
Are the Financial Ratios Favorable?
In 2025, profitability metrics such as net margin (-3.59%) and ROE (-4.56%) are unfavorable, signaling operational challenges. Liquidity ratios like quick ratio (1.02) are favorable, but the current ratio (1.29) remains neutral. Leverage metrics, including debt-to-equity (0.81) and debt-to-assets (36%), are neutral. Market valuation ratios show mixed signals, with a favorable P/E but unfavorable price-to-book at 3.19. Overall, the ratios appear slightly unfavorable.
Shareholder Return Policy
Charles River Laboratories International, Inc. (CRL) does not pay dividends, reflecting its negative net profit margin of -3.6% in 2025. The company appears focused on reinvestment, prioritizing growth and operational cash flow, supported by positive free cash flow of $10.5 per share.
CRL engages in share buybacks, although specific volumes are not disclosed. This policy aligns with long-term value creation, as reinvestment and share repurchases may support sustainable shareholder returns amid profitability challenges. Investors should monitor cash flow adequacy and leverage risks closely.
Score analysis
The following radar chart illustrates the company’s performance across key financial metrics:
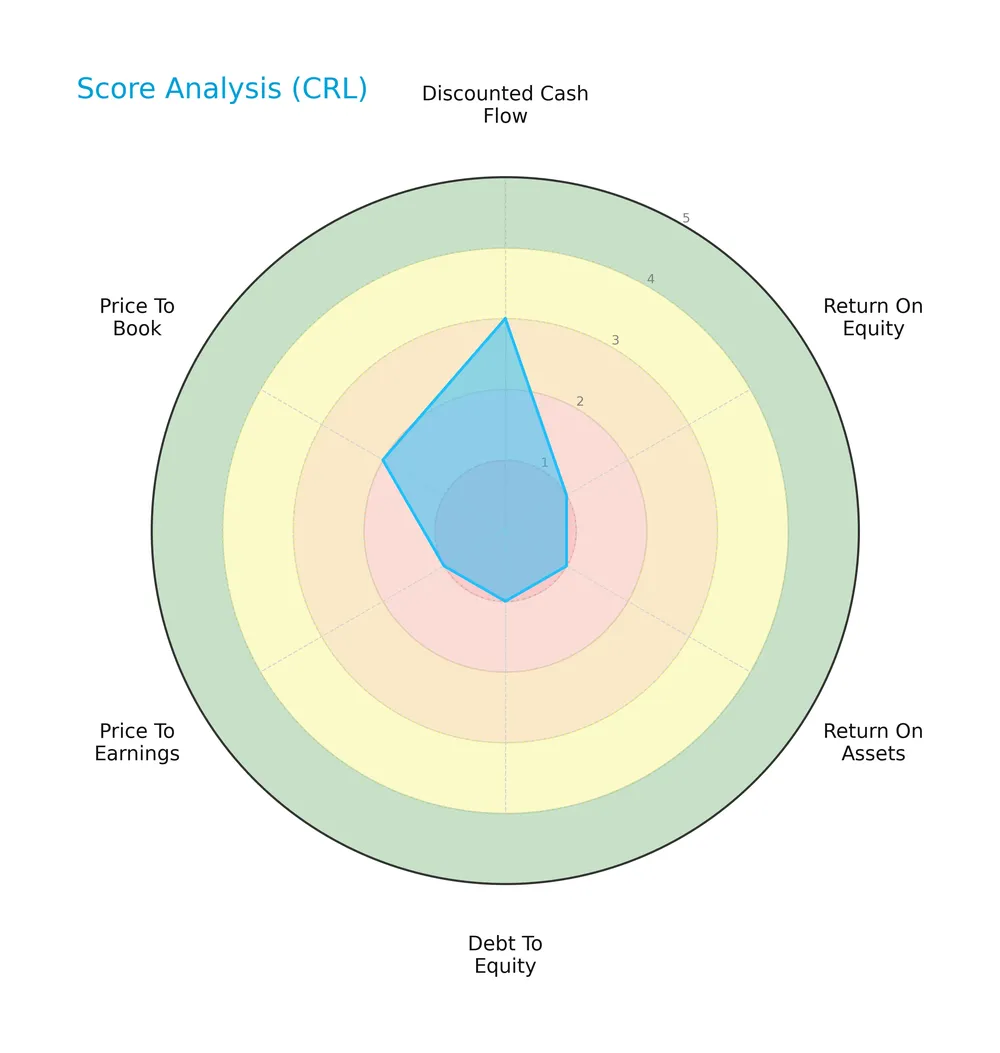
Charles River Laboratories shows a moderate discounted cash flow score of 3, but very unfavorable returns on equity and assets at 1 each. The debt-to-equity and price-to-earnings scores also rank very low at 1, with price-to-book slightly better at 2.
Analysis of the company’s bankruptcy risk
The Altman Z-Score positions the company in the grey zone, indicating moderate bankruptcy risk:

Is the company in good financial health?
The Piotroski diagram highlights the company’s financial strength based on nine criteria:
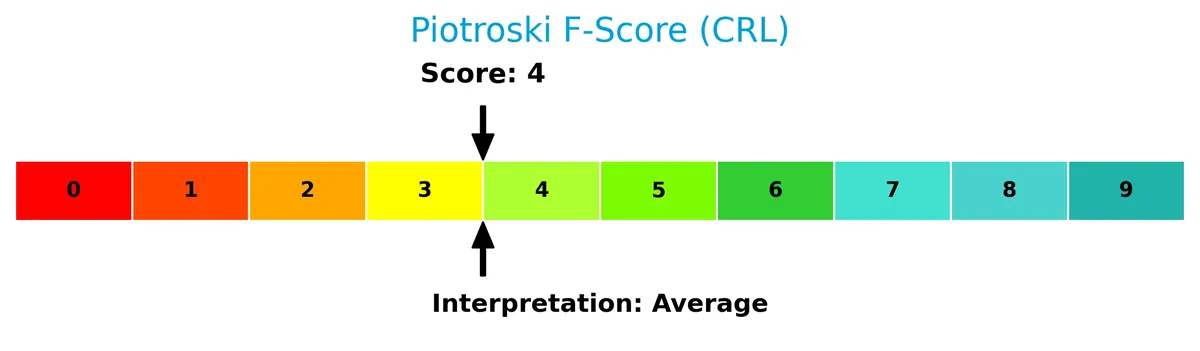
With a Piotroski score of 4, the company demonstrates average financial health, reflecting some strengths but also notable weaknesses in profitability and efficiency.
Competitive Landscape & Sector Positioning
This sector analysis examines Charles River Laboratories International, Inc.’s strategic positioning, revenue segments, key products, and main competitors. I will assess whether Charles River holds a competitive advantage over its industry peers.
Strategic Positioning
Charles River Laboratories maintains a diversified business model across three segments: Discovery and Safety Assessment ($2.4B), Manufacturing Support ($766M), and Research Models and Services ($846M) in 2025. Geographically, it spans the U.S. ($2.1B), Europe ($1.1B), Canada ($501M), and Asia Pacific ($205M), reflecting broad exposure within medical research services.
Revenue by Segment
The pie chart illustrates Charles River Laboratories’ revenue distribution by segment for fiscal year 2025, highlighting key business areas and their relative contributions.
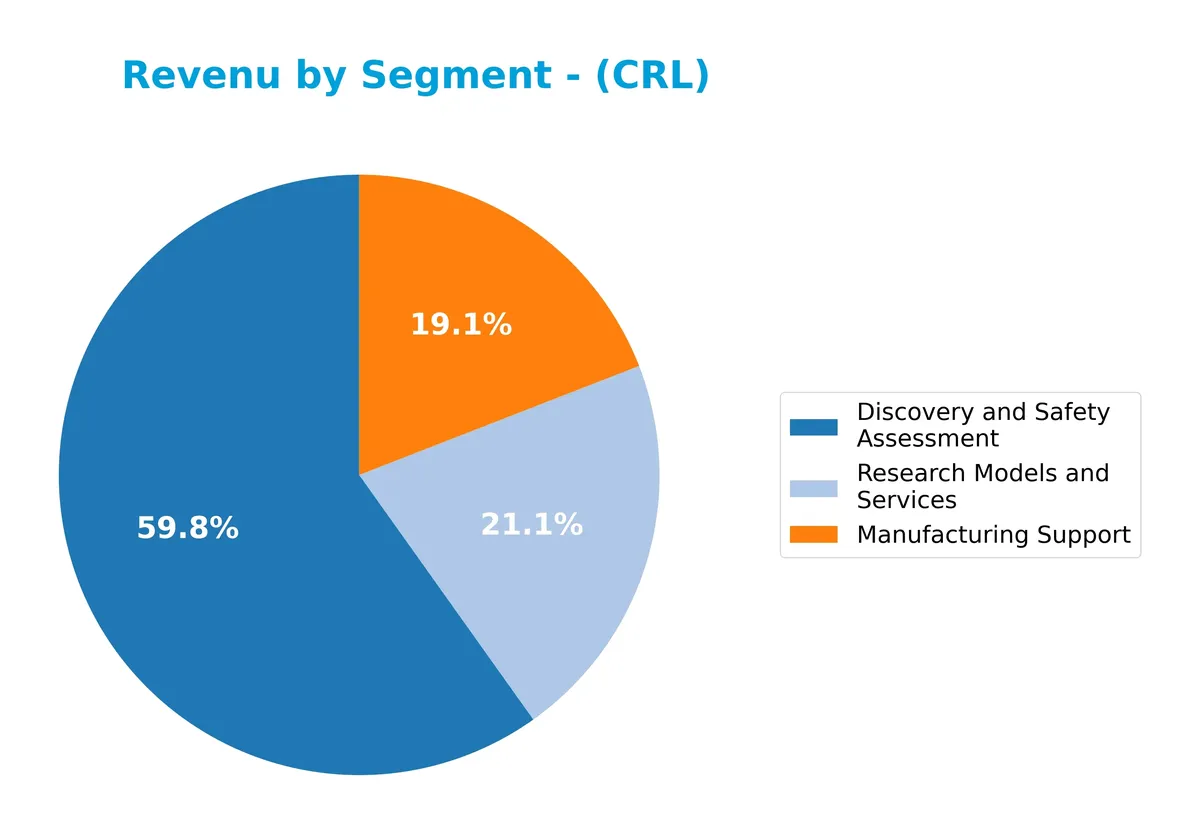
In 2025, Discovery and Safety Assessment remains the dominant segment with $2.4B, showing slight contraction from prior years after peaking in 2023. Manufacturing Support and Research Models and Services contribute $766M and $846M respectively, demonstrating steady performance. The business leans heavily on Discovery and Safety, posing concentration risk if this segment slows further, while the other segments provide moderate diversification but limited growth acceleration.
Key Products & Brands
The table below summarizes Charles River Laboratories’ core products and brand segments driving its revenue:
| Product | Description |
|---|---|
| Research Models and Services | Produces rodent research model strains and purpose-bred rats and mice; offers genetically engineered models, insourcing solutions, and diagnostic services to support non-clinical drug research. |
| Discovery and Safety Assessment | Provides early discovery services, target identification, toxicology, pathology, pharmacokinetics, and safety assessment services for drug and therapeutic candidates. |
| Manufacturing Support | Offers in vitro quality control testing of sterile and non-sterile pharmaceuticals, biologics testing, avian vaccine services, and contract vivarium operations. |
Charles River Laboratories generates most revenue from Discovery and Safety Assessment, reflecting its strong foothold in early-stage drug development and safety testing. Research Models and Manufacturing Support complement this with specialized research tools and pharmaceutical testing services.
Main Competitors
The Healthcare sector includes 11 competitors, with the following top 10 leaders by market capitalization:
| Competitor | Market Cap. |
|---|---|
| Thermo Fisher Scientific Inc. | 225B |
| Danaher Corporation | 165B |
| IDEXX Laboratories, Inc. | 53.5B |
| Agilent Technologies, Inc. | 39.1B |
| IQVIA Holdings Inc. | 38.4B |
| Mettler-Toledo International Inc. | 28.8B |
| Waters Corporation | 22.7B |
| Quest Diagnostics Incorporated | 19.4B |
| Revvity, Inc. | 11.6B |
| Charles River Laboratories International, Inc. | 10.0B |
Charles River Laboratories ranks 10th among its 11 competitors. Its market cap is 3.46% of the leader, Thermo Fisher Scientific. The company sits below both the average market cap of 61.3B for the top 10 and the sector median of 28.8B. It maintains a 49.73% gap below the next closest competitor, Revvity, indicating a significant scale difference with its nearest peer.
Comparisons with competitors
Check out how we compare the company to its competitors:
Does CRL have a competitive advantage?
Charles River Laboratories International, Inc. shows no competitive advantage, as it destroys value with a ROIC consistently below WACC and a declining profitability trend. Its negative income metrics and shrinking margins further confirm this unfavorable position.
Looking ahead, CRL operates across diversified global markets including the U.S., Europe, Canada, and Asia Pacific, offering drug discovery and safety testing services. Future opportunities may arise from expanding its Manufacturing and Discovery segments internationally.
SWOT Analysis
This SWOT analysis highlights Charles River Laboratories’ core competitive factors and challenges to inform strategic positioning.
Strengths
- Established global presence
- Diversified service segments
- Strong client base in pharmaceuticals
Weaknesses
- Negative net margin
- Declining ROIC vs WACC
- Weak profitability and earnings growth
Opportunities
- Expansion in Asia Pacific
- Growing biotech outsourcing
- Innovation in non-clinical testing
Threats
- Intensifying industry competition
- Regulatory complexity
- Economic sensitivity impacting R&D budgets
Charles River faces significant profitability challenges despite solid market reach. Strategic focus should prioritize operational efficiency and innovation to capture growth while mitigating industry and regulatory risks.
Stock Price Action Analysis
The following weekly chart illustrates Charles River Laboratories International, Inc. (CRL) stock price movements over the past 12 months:
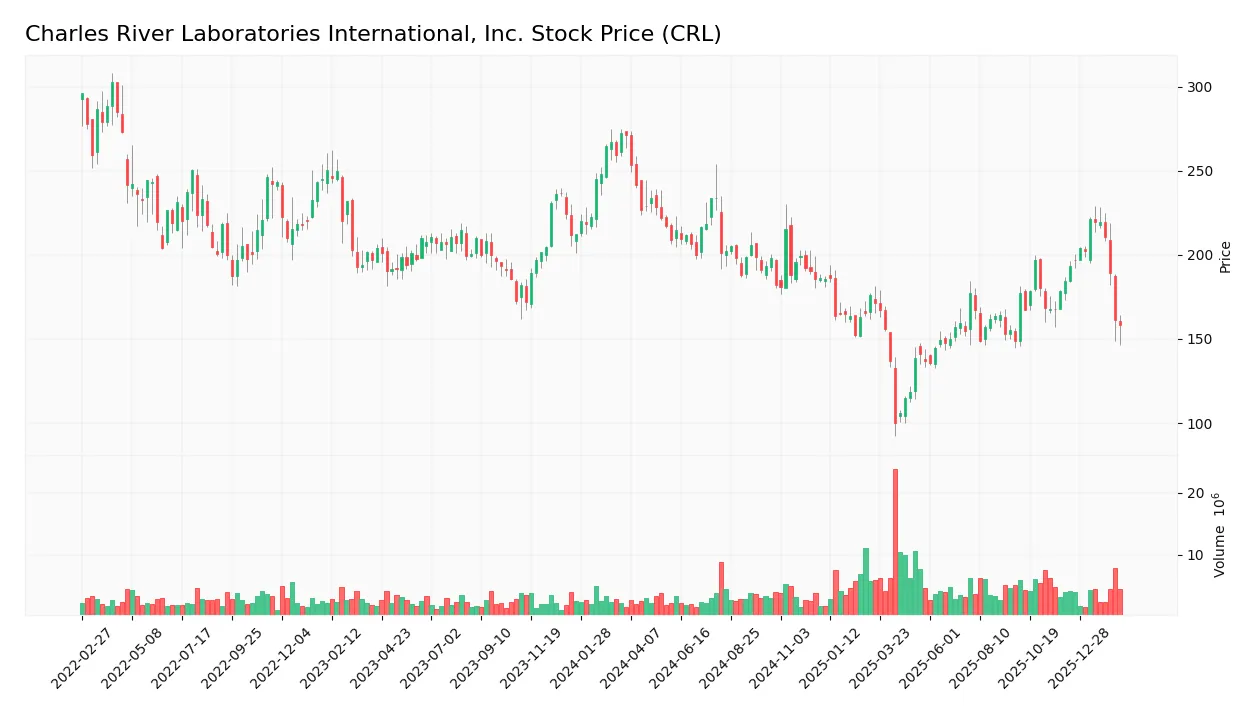
Trend Analysis
Over the past year, CRL’s stock price declined by 41.69%, indicating a clear bearish trend. The price fell from a high of 270.95 to a low of 99.75, with volatility at a 31.78% standard deviation. The bearish trend shows deceleration, signaling a slowing pace of decline.
Volume Analysis
Trading volume is increasing overall, with buyer participation slightly above sellers at 50.73%. However, in the recent three months, seller dominance rose to 60.15%, suggesting growing selling pressure and cautious investor sentiment amid weakening price momentum.
Target Prices
Analysts show a confident consensus on Charles River Laboratories’ price outlook.
| Target Low | Target High | Consensus |
|---|---|---|
| 185 | 260 | 214.43 |
The target range suggests analysts expect a significant upside from current levels, reflecting strong growth prospects in the life sciences sector.

Don’t Let Luck Decide Your Entry Point
Optimize your entry points with our advanced ProRealTime indicators. You’ll get efficient buy signals with precise price targets for maximum performance. Start outperforming now!
Analyst & Consumer Opinions
This section examines analyst ratings and consumer feedback to provide insights on Charles River Laboratories International, Inc. (CRL).
Stock Grades
Here are the latest verified stock grades for Charles River Laboratories International, Inc. from leading financial institutions:
| Grading Company | Action | New Grade | Date |
|---|---|---|---|
| Citigroup | Maintain | Buy | 2026-01-16 |
| Evercore ISI Group | Maintain | Outperform | 2026-01-13 |
| Mizuho | Maintain | Neutral | 2025-12-18 |
| JP Morgan | Maintain | Neutral | 2025-12-15 |
| Barclays | Maintain | Overweight | 2025-12-15 |
| Morgan Stanley | Maintain | Equal Weight | 2025-11-11 |
| TD Cowen | Maintain | Buy | 2025-11-10 |
| Barclays | Maintain | Overweight | 2025-11-06 |
| JP Morgan | Maintain | Neutral | 2025-11-06 |
| Baird | Upgrade | Outperform | 2025-11-06 |
The consensus reflects a generally positive outlook with most firms maintaining Buy or Outperform ratings. Neutral and Equal Weight grades indicate some caution, but no downgrades suggest stability in sentiment.
Consumer Opinions
Charles River Laboratories garners mixed consumer sentiment, reflecting its complex market position.
| Positive Reviews | Negative Reviews |
|---|---|
| “Reliable and high-quality research services.” | “Pricing can be steep for smaller clients.” |
| “Responsive customer support with expert guidance.” | “Occasional delays in project timelines.” |
| “Strong commitment to scientific innovation.” | “Limited flexibility in contract negotiations.” |
Overall, consumers praise Charles River for its scientific expertise and service quality. However, pricing and delivery timelines remain common concerns, indicating areas for operational improvement.
Risk Analysis
Below is a summary table of key risks facing Charles River Laboratories International, Inc., highlighting probability and impact:
| Category | Description | Probability | Impact |
|---|---|---|---|
| Financial Health | Negative net margin (-3.59%) and ROE (-4.56%) signal ongoing profitability struggles. | High | High |
| Leverage & Solvency | Altman Z-Score in grey zone (1.99) indicates moderate bankruptcy risk amid negative interest coverage. | Medium | High |
| Market Volatility | Beta of 1.63 reflects higher sensitivity to market swings than S&P 500, increasing share price risk. | High | Medium |
| Dividend Policy | No dividend yield signals potential lack of shareholder returns, possibly reducing investor appeal. | High | Medium |
| Valuation Metrics | Unfavorable P/B of 3.19 and weak price-to-earnings ratio (-69.93) indicate market skepticism. | Medium | Medium |
| Operational Risks | Exposure to regulatory shifts in drug development and safety testing could impact revenues. | Medium | Medium |
The most critical risks are Charles River’s weak profitability and moderate bankruptcy risk, underscored by a net margin loss and a fragile Altman Z-Score. Market volatility also poses a significant threat given the company’s high beta. Recent financials highlight persistent operational challenges, demanding close monitoring.
Should You Buy Charles River Laboratories International, Inc.?
Charles River Laboratories appears to be facing deteriorating profitability and an eroding competitive moat, with a leverage profile that suggests substantial financial risk. Despite a very unfavorable overall rating of C-, this analytical interpretation highlights cautious operational efficiency concerns.
Strength & Efficiency Pillars
Charles River Laboratories International, Inc. shows operational resilience despite broader challenges. The company posts an EBIT margin and gross margin at 0.0%, limiting profitability praise. Its return on invested capital (ROIC) stands at 4.74%, which trails the weighted average cost of capital (WACC) at 9.19%. This gap signals the firm is currently destroying value rather than creating it. I note the interest expense is favorable at -2.67%, indicating manageable financing costs relative to earnings pressure.
Weaknesses and Drawbacks
CRL’s Altman Z-Score of 1.99 places it in the “Grey Zone,” signaling moderate bankruptcy risk and financial caution. The company struggles with unfavorable net margin at -3.59% and negative return on equity of -4.56%, reflecting profitability woes. Valuation metrics show a high price-to-book ratio of 3.19, indicating a premium valuation that may not be justified by fundamentals. Seller dominance at 60.15% in recent trading raises short-term market pressure, adding volatility risk.
Our Final Verdict about Charles River Laboratories International, Inc.
Despite some operational stability, CRL’s moderate solvency risk and value destruction position make this investment highly speculative. The bearish overall stock trend and recent seller dominance suggest caution. While the company may appear to have pockets of strength, the financial profile and market conditions warrant a wait-and-see approach, especially for conservative capital seeking safety and consistent value creation.
Disclaimer: This content is for informational purposes only and does not constitute financial, investment, or other professional advice. Investing in financial markets involves a significant risk of loss, and past performance is not indicative of future results.
Additional Resources
- Decoding Charles River Laboratories International Inc (CRL): A S – GuruFocus (Feb 19, 2026)
- Charles River Laboratories International, Inc. Q4 2025 Earnings Call Summary – Yahoo Finance (Feb 18, 2026)
- Charles River Laboratories International (NYSE:CRL) Shares Gap Down – What’s Next? – MarketBeat (Feb 18, 2026)
- New Charles River Leaders May Shape Valuation, Debt And Governance Outlook – simplywall.st (Feb 18, 2026)
- Charles River Laboratories Q4 Review: Approaching A Bottom (NYSE:CRL) – Seeking Alpha (Feb 18, 2026)
For more information about Charles River Laboratories International, Inc., please visit the official website: criver.com