Home > Analyses > Technology > CEVA, Inc.
CEVA, Inc. powers the invisible intelligence behind today’s smart devices, enabling seamless wireless connectivity and advanced sensing. Its digital signal processors and AI platforms drive innovation across mobile, IoT, automotive, and industrial sectors. Renowned for cutting-edge technology and robust licensing models, CEVA shapes how devices perceive and interact with the world. The key question: does CEVA’s current financial strength and market positioning support sustained growth in an increasingly competitive semiconductor landscape?

Table of contents
Business Model & Company Overview
CEVA, Inc., founded in 1999 and headquartered in Rockville, Maryland, leads the semiconductor licensing sector with its core business of wireless connectivity and smart sensing technologies. It offers a unified ecosystem of digital signal processors, AI chips, and software that powers 5G, IoT, imaging, and voice applications. This integrated approach drives innovation across mobile, consumer, automotive, and industrial markets worldwide.
The company’s revenue engine hinges on licensing its DSP cores and platforms, blending hardware IP with complementary software tools. CEVA maintains a strategic global footprint across the Americas, Europe, and Asia, supplying OEMs and semiconductor firms. Its economic moat stems from deep integration into diverse end-products, securing a vital role in the evolving semiconductor value chain.
Financial Performance & Fundamental Metrics
I will analyze CEVA, Inc.’s income statement, key financial ratios, and dividend payout policy to assess its core financial health and shareholder value approach.
Income Statement
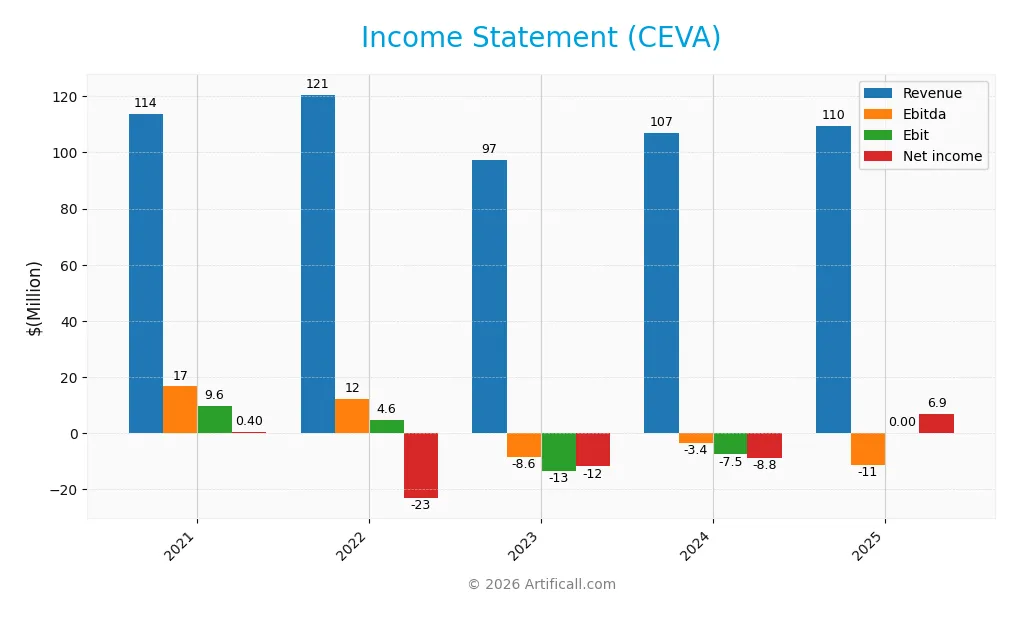
The table below summarizes CEVA, Inc.’s income statement figures for the fiscal years 2021 through 2025, reflecting revenue, expenses, profitability, and earnings per share.
| 2021 | 2022 | 2023 | 2024 | 2025 | |
|---|---|---|---|---|---|
| Revenue | 114B | 121B | 97.4B | 107B | 110B |
| Cost of Revenue | 10.4B | 15.1B | 11.6B | 12.8B | 14.2B |
| Operating Expenses | 96.4B | 102B | 99.2B | 102B | 107B |
| Gross Profit | 103.5B | 105.5B | 85.8B | 94.2B | 95.4B |
| EBITDA | 16.6B | 12.2B | -8.6B | -3.4B | -11.3B |
| EBIT | 9.6B | 4.6B | -13.5B | -7.5B | -11.3B |
| Interest Expense | 420M | 397M | 0 | 0 | 0 |
| Net Income | 396M | -23.2B | -11.9B | -8.8B | -10.6B |
| EPS | 0.017 | -1.00 | -0.51 | -0.37 | -0.44 |
| Filing Date | 2022-03-01 | 2023-03-01 | 2024-03-07 | 2025-02-27 | 2026-02-27 |
Income Statement Evolution
CEVA’s revenue showed modest growth of 2.5% from 2024 to 2025, yet the overall five-year trend reveals a decline of 3.7%. Gross profit margins remained stable around 87%, reflecting consistent cost control in production. However, EBIT and net income margins deteriorated significantly, with EBIT margin at -10.35% and net margin at -9.71%, signaling worsening profitability despite steady top-line performance.
Is the Income Statement Favorable?
The 2025 income statement reveals unfavorable fundamentals. Operating expenses grew in line with revenue, suppressing operating income to a negative $11.3M. Despite zero interest expense, net income fell to -$10.6M, driven by a $5.9M tax expense. Earnings per share declined 19% year-over-year, indicating deteriorating shareholder returns. Overall, the income statement trends confirm persistent profitability challenges.
Financial Ratios
The table below summarizes CEVA, Inc.’s key financial ratios from 2021 through 2025 for a clear year-over-year comparison:
| Ratios | 2021 | 2022 | 2023 | 2024 | 2025 |
|---|---|---|---|---|---|
| Net Margin | 0.3% | -19.2% | -12.2% | -8.2% | -9.7% |
| ROE | 0.1% | -8.9% | -4.5% | -3.3% | -3.2% |
| ROIC | 0.6% | -4.6% | -4.8% | -2.7% | -3.1% |
| P/E | 2492 | -25.6 | -44.9 | -84.8 | -49.1 |
| P/B | 3.57 | 2.29 | 2.02 | 2.79 | 1.55 |
| Current Ratio | 5.33 | 5.34 | 7.79 | 7.09 | 9.93 |
| Quick Ratio | 5.33 | 5.34 | 7.79 | 7.09 | 9.93 |
| D/E | 0.03 | 0.03 | 0.02 | 0.02 | 0.09 |
| Debt-to-Assets | 0.03 | 0.03 | 0.02 | 0.02 | 0.08 |
| Interest Coverage | 16.8 | 9.8 | 0 | 0 | 0 |
| Asset Turnover | 0.34 | 0.39 | 0.32 | 0.35 | 0.28 |
| Fixed Asset Turnover | 7.30 | 7.98 | 7.11 | 8.43 | 4.47 |
| Dividend Yield | 0 | 0 | 0 | 0 | 0 |
Evolution of Financial Ratios
Return on Equity (ROE) declined slightly to -3.16% in 2025, reflecting persistent unprofitability. The Current Ratio increased to 9.93, indicating stronger short-term liquidity. Debt-to-Equity Ratio remained low at 0.09, showing stable and conservative leverage. Profitability metrics stayed weak with negative net margins throughout the period.
Are the Financial Ratios Fovorable?
In 2025, CEVA’s profitability ratios, including ROE and net margin, are unfavorable, signaling ongoing losses. Liquidity ratios show mixed results: a high Current Ratio is unfavorable due to inefficiency, but a strong Quick Ratio is favorable. Leverage is favorable with low debt levels. Asset turnover is low, suggesting inefficient asset use. Market valuation ratios are mostly neutral to unfavorable, leading to an overall unfavorable ratio profile.
Shareholder Return Policy
CEVA, Inc. does not pay dividends, reflecting its negative net income and reinvestment focus. The company maintains a strong current ratio and low leverage while prioritizing capital expenditure to support growth.
The absence of dividends and share buybacks signals a strategy centered on long-term value creation through reinvestment rather than immediate shareholder returns. This approach aligns with sustaining future growth despite short-term profitability challenges.
Score analysis
The following radar chart presents CEVA, Inc.’s key financial scores across multiple valuation and performance metrics:
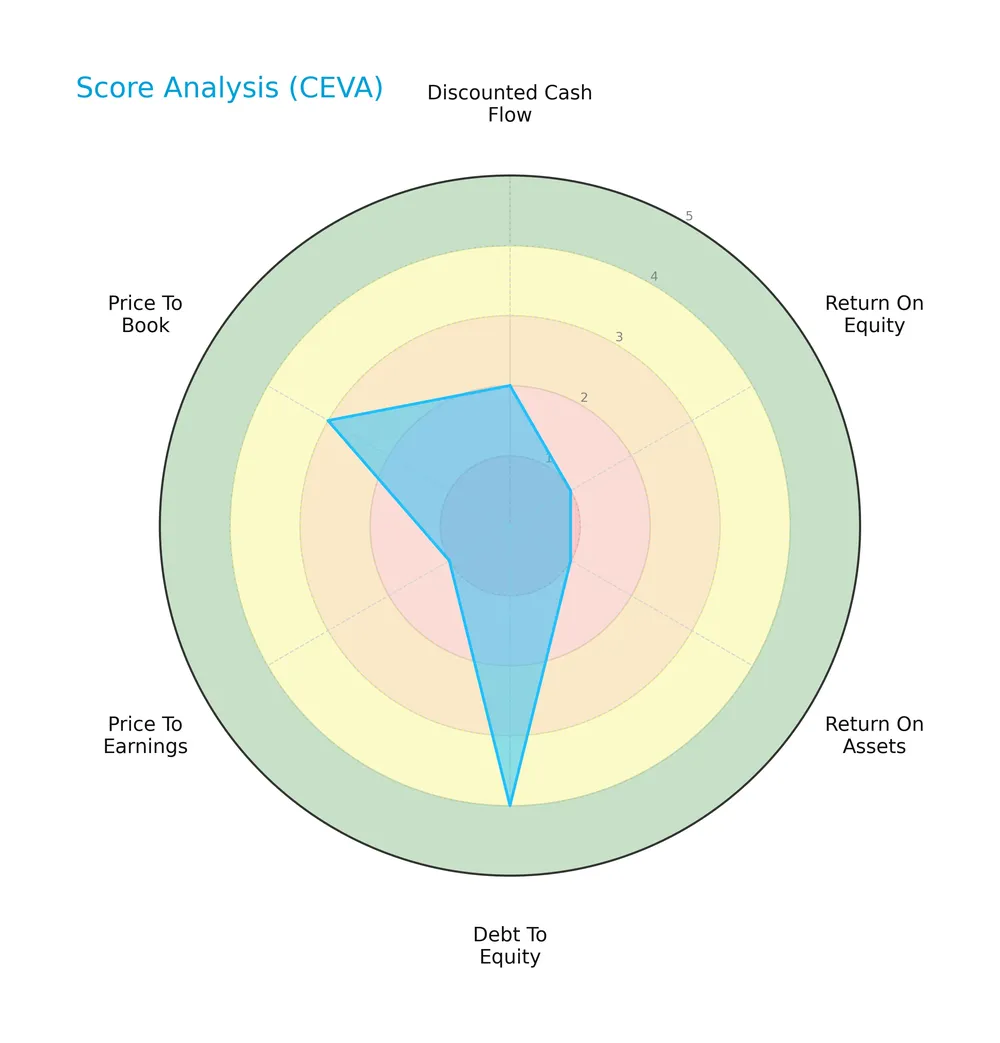
CEVA scores poorly in profitability metrics, with very unfavorable returns on equity and assets. Its discounted cash flow and price-to-earnings ratios also lag. However, debt-to-equity and price-to-book scores suggest moderate financial leverage and valuation.
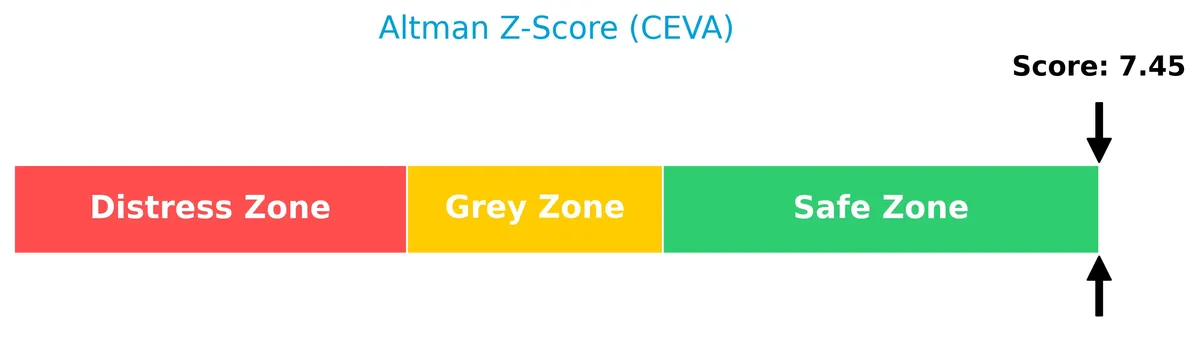
Analysis of the company’s bankruptcy risk
CEVA’s Altman Z-Score places it well within the safe zone, indicating a very low risk of bankruptcy:
Is the company in good financial health?
This Piotroski diagram illustrates CEVA’s financial strength based on nine fundamental criteria:
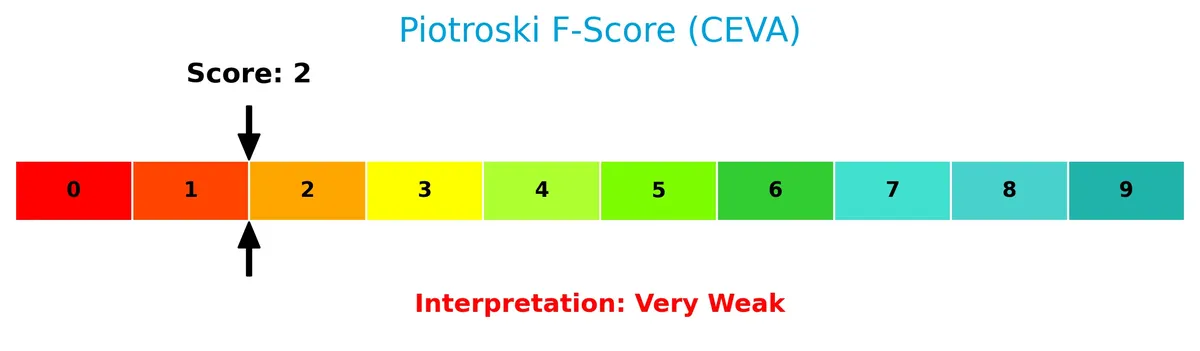
With a Piotroski Score of 3, CEVA ranks very weak, signaling concerns about its financial health despite its low bankruptcy risk.
Competitive Landscape & Sector Positioning
This section examines CEVA, Inc.’s strategic position within the semiconductor industry, focusing on its business segments and product offerings. I will analyze its main competitors and assess whether CEVA holds a competitive advantage in this technology-driven sector.
Strategic Positioning
CEVA, Inc. maintains a focused product portfolio centered on wireless connectivity and smart sensing technologies. Geographically, it heavily concentrates revenue in Asia Pacific, especially China, which accounted for 67.9M of 84M total regional sales in 2025, with smaller exposure to the US and Europe.
Revenue by Segment
This pie chart displays CEVA, Inc.’s revenue distribution by product segment for the fiscal year 2025, highlighting the relative contribution of License and Royalty streams.
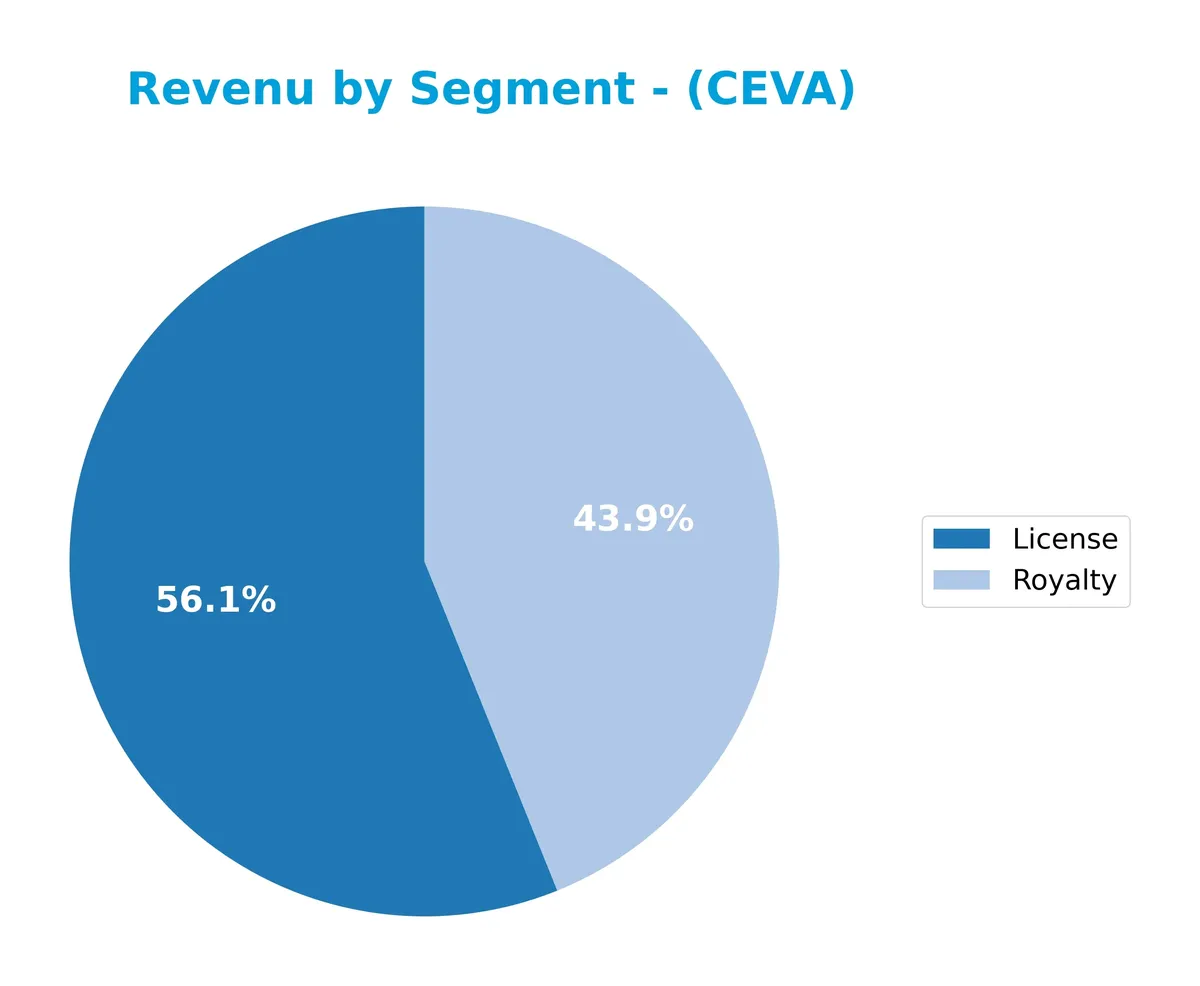
In 2025, License revenue leads with $63.6M, while Royalty follows at $46.0M. License revenue shows steady growth from $57.6M in 2023, indicating accelerating demand. Royalty revenue dipped slightly from $46.9M in 2024, signaling potential volatility. The shift from product-based segments toward licensing underscores CEVA’s evolving business model and concentration risk around intellectual property licensing.
Key Products & Brands
CEVA, Inc. licenses a diverse range of semiconductor technologies and platforms, detailed as follows:
| Product | Description |
|---|---|
| License | Rights granted to semiconductor and OEM companies to use CEVA’s wireless connectivity, AI processors, and DSP technologies. |
| Royalty | Ongoing fees from licensed technologies embedded in application-specific integrated circuits and products. |
| Connectivity Products | DSP-based platforms supporting 5G baseband, Bluetooth, Wi-Fi 4/5/6/6E, Ultra-wideband, and NB-IoT for mobile, IoT, and infrastructure devices. |
| Smart Sensing Products | Technologies for sensor fusion, image enhancement, computer vision, voice input, and AI, used in hearables, wearables, AR/VR, robotics, and IoT markets. |
| DSP Products | Digital signal processors designed for multimedia, communications, and AI applications, enabling efficient data processing in various devices. |
CEVA’s product portfolio centers on licensing advanced connectivity and sensing IP to semiconductor firms. This strategy supports diverse end markets such as mobile, automotive, industrial, and IoT. The company’s revenue mix reflects a transition from product-based sales toward licensing and royalty income.
Main Competitors
In the Technology sector’s Semiconductors industry, 38 competitors exist. Below is a table of the top 10 leaders by market capitalization:
| Competitor | Market Cap. |
|---|---|
| NVIDIA Corporation | 4.6T |
| Broadcom Inc. | 1.6T |
| Taiwan Semiconductor Manufacturing Company Limited | 1.6T |
| ASML Holding N.V. | 415B |
| Advanced Micro Devices, Inc. | 363B |
| Micron Technology, Inc. | 353B |
| Lam Research Corporation | 232B |
| Applied Materials, Inc. | 214B |
| QUALCOMM Incorporated | 185B |
| Intel Corporation | 173B |
CEVA, Inc. ranks 37th among 38 competitors, with a market cap just 0.01% of the leader’s. It sits well below both the top 10 average market cap of 975B and the sector median of 31B. The 26.9% gap to the next competitor above highlights the significant scale difference CEVA faces.
Comparisons with competitors
Check out how we compare the company to its competitors:
Does CEVA have a competitive advantage?
CEVA, Inc. does not present a competitive advantage as its ROIC significantly trails its WACC, indicating value destruction and declining profitability over 2021-2025. The company’s profitability metrics, including net margin and EBIT margin, remain unfavorable, reflecting ongoing operational challenges.
Looking ahead, CEVA focuses on licensing advanced wireless connectivity and AI processors across mobile, IoT, and automotive sectors. Expansion in Asia Pacific, driven by increasing revenue from China, highlights growth opportunities in emerging technology markets despite current financial headwinds.
SWOT Analysis
This SWOT analysis highlights CEVA, Inc.’s key internal strengths and weaknesses, along with external opportunities and threats shaping its strategic outlook.
Strengths
- strong gross margin at 87%
- low debt-to-equity ratio at 0.09
- diversified IP portfolio in wireless and AI technology
Weaknesses
- negative EBIT and net margins near -10%
- declining ROIC well below WACC
- weak revenue and earnings growth trends
Opportunities
- growing demand for 5G and IoT semiconductor IP
- expansion in Asia Pacific markets
- rising adoption of AI and sensor fusion tech
Threats
- intense competition in semiconductor licensing
- rapid technology shifts requiring constant innovation
- geopolitical risks impacting supply chains
CEVA’s strengths in high-margin licensing and low leverage support its core operations. However, persistent profitability declines and value destruction signal urgent need for strategic realignment. The company must capitalize on growth in AI and 5G while managing competitive and geopolitical risks prudently.
Stock Price Action Analysis
The following weekly stock chart illustrates CEVA, Inc.’s price movements over the past 12 months, highlighting key highs and lows with notable volatility:
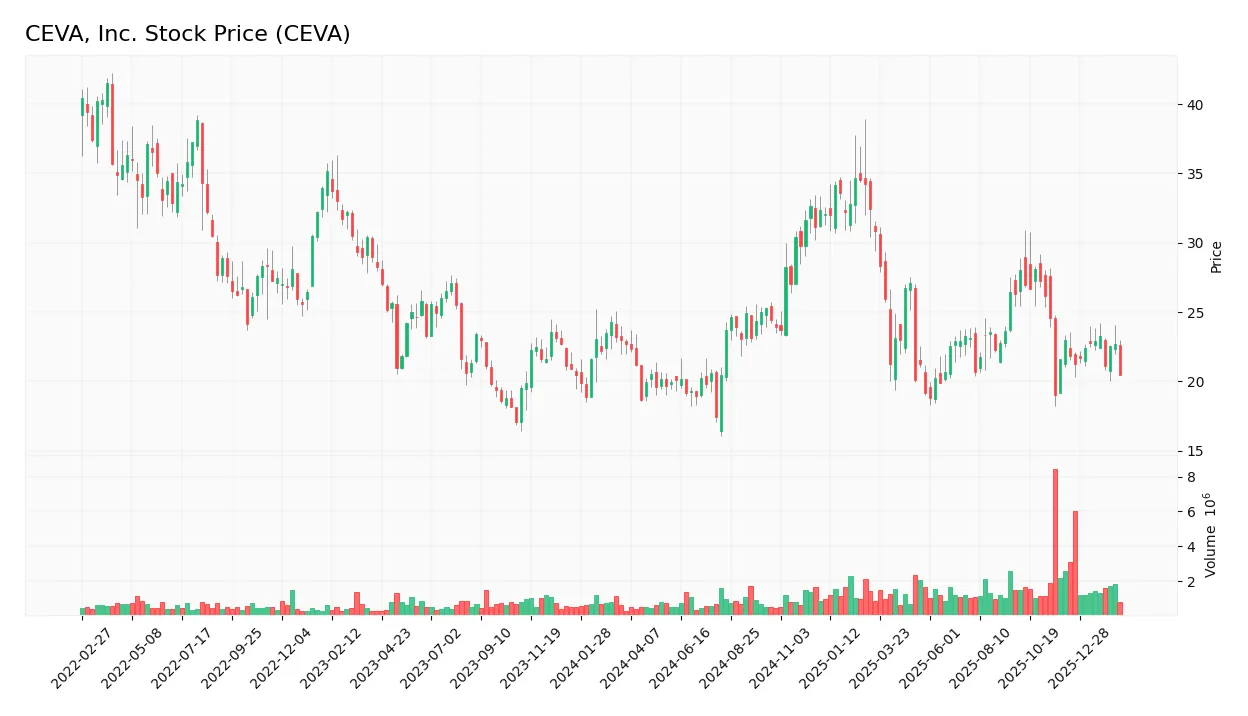
Trend Analysis
Over the past year, CEVA’s stock price declined by 6.54%, indicating a bearish trend. The price showed deceleration, with a high of 34.67 and a low of 17.39. Recent three-month data confirms continued bearishness with a 4.44% drop and low volatility (std dev 1.04).
Volume Analysis
In the last three months, trading volumes increased with a slight seller dominance—52% versus 48.9% buyers. This balanced, neutral buyer behavior signals moderate market participation without strong conviction from either side.
Target Prices
Analysts present a confident target consensus for CEVA, Inc., reflecting positive growth expectations.
| Target Low | Target High | Consensus |
|---|---|---|
| 28 | 30 | 29.33 |
The target prices suggest a narrow range with a strong median near 30, indicating steady analyst optimism.

Don’t Let Luck Decide Your Entry Point
Optimize your entry points with our advanced ProRealTime indicators. You’ll get efficient buy signals with precise price targets for maximum performance. Start outperforming now!
Analyst & Consumer Opinions
This section examines the latest analyst ratings and consumer feedback concerning CEVA, Inc.’s market performance and reputation.
Stock Grades
Here are the latest verified analyst grades for CEVA, Inc. from established financial firms:
| Grading Company | Action | New Grade | Date |
|---|---|---|---|
| Rosenblatt | Maintain | Buy | 2026-02-18 |
| Oppenheimer | Maintain | Outperform | 2026-02-18 |
| Barclays | Maintain | Overweight | 2025-11-12 |
The consensus shows a consistent positive outlook with no downgrades noted recently. Analysts maintain confidence, reflected in stable Buy, Outperform, and Overweight ratings over multiple updates.
Consumer Opinions
CEVA, Inc. evokes a mix of enthusiasm and frustration among its users, reflecting its complex market position.
| Positive Reviews | Negative Reviews |
|---|---|
| Strong product innovation drives market edge. | Customer support often slow to respond. |
| Competitive pricing attracts budget-conscious buyers. | Occasional software bugs affect user experience. |
| Reliable performance praised by long-term clients. | Limited compatibility with some third-party tools. |
Overall, consumers appreciate CEVA’s innovation and value but consistently flag customer service delays and software issues as key weaknesses to address.
Risk Analysis
Below is a summary of CEVA, Inc.’s key risks, highlighting their likelihood and potential impact on the company’s financial health:
| Category | Description | Probability | Impact |
|---|---|---|---|
| Profitability Risk | Negative net margin (-9.71%) signals ongoing losses. | High | High |
| Liquidity Risk | Extremely high current ratio (9.93) may indicate inefficient cash use. | Medium | Medium |
| Leverage Risk | Low debt-to-equity (0.09) and debt-to-assets (7.86%) are favorable. | Low | Low |
| Earnings Volatility | Negative ROE (-3.16%) and ROIC (-3.14%) reflect poor capital returns. | High | High |
| Interest Coverage | Zero interest coverage ratio signals inability to cover interest expenses. | Medium | High |
| Market Risk | Beta of 1.497 suggests higher sensitivity to market swings. | High | Medium |
| Financial Strength | Piotroski score of 3 indicates weak financial health. | High | High |
| Bankruptcy Risk | Altman Z-score of 7.52 places CEVA well within the safe zone. | Low | Low |
The most pressing risks are profitability and earnings volatility, due to sustained losses and poor capital returns. Despite solid bankruptcy protection, the weak Piotroski score and zero interest coverage raise red flags. Market sensitivity adds further uncertainty in this volatile semiconductor sector.
Should You Buy CEVA, Inc.?
CEVA, Inc. appears to be facing a challenging profile with declining profitability and a very unfavorable competitive moat, indicating value destruction. Despite a manageable leverage profile and a safe Altman Z-score, the overall rating remains a cautious C, suggesting risks outweigh operational strengths.
Strength & Efficiency Pillars
CEVA, Inc. maintains a robust gross margin of 87.08%, signaling strong operational control over production costs. However, profitability metrics reveal challenges with a negative net margin of -9.71%, ROE at -3.16%, and ROIC at -3.14%, all unfavorable. The company is not a value creator, as ROIC (-3.14%) falls well below its WACC (10.1%). Despite operational efficiency in fixed asset turnover (4.47), CEVA struggles to convert assets into profitable returns.
Weaknesses and Drawbacks
CEVA faces considerable financial headwinds. Its overall score is unfavorable at 2, with very weak Piotroski score of 3, reflecting frail financial health. Valuation metrics are mixed: a negative P/E (-49.15) suggests losses rather than premium pricing, and a moderate P/B of 1.55 indicates fair market valuation. The high current ratio of 9.93, though superficially strong, may signal inefficient asset use. Interest coverage is zero, highlighting vulnerability to financial stress despite low debt-to-equity (0.09).
Our Final Verdict about CEVA, Inc.
CEVA’s financial profile appears troubled, with declining profitability and value destruction indicated by ROIC trends. Despite a safe Altman Z-Score of 7.52, the company’s weak operational profitability and unfavorable growth trends suggest a cautious stance. The bearish overall trend and neutral buyer behavior imply that CEVA might appear too risky for conservative capital and may warrant a wait-and-see approach.
Disclaimer: This content is for informational purposes only and does not constitute financial, investment, or other professional advice. Investing in financial markets involves a significant risk of loss, and past performance is not indicative of future results.
Additional Resources
- CEVA, Inc. (CEVA) Reports Record Q4, Expanding AI Connectivity Demand – Yahoo Finance (Feb 23, 2026)
- CEVA (CEVA) Posts Record Q4 Revenue on Strong Licensing and Wi-Fi Growth – Finviz (Feb 27, 2026)
- Ceva, Inc. Announces Fourth Quarter and Full Year 2025 Financial Results – PR Newswire (Feb 17, 2026)
- CEVA: Not Buying The Bounce (NASDAQ:CEVA) – Seeking Alpha (Feb 27, 2026)
- CEVA (CEVA) Posts Record Q4 Revenue on Strong Licensing and Wi-Fi Growth – Insider Monkey (Feb 27, 2026)
For more information about CEVA, Inc., please visit the official website: ceva-dsp.com