CEVA, Inc. is at the vanguard of the semiconductor revolution, powering the connectivity and smart sensing technologies that underpin the modern digital landscape. With a robust portfolio of digital signal processors, AI solutions, and cutting-edge wireless platforms, CEVA shapes the future of industries ranging from automotive to IoT. Renowned for its innovation and quality, the company consistently pushes boundaries. As I delve into CEVA’s investment potential, I ponder whether its impressive fundamentals still align with its current market valuation.

Table of contents
Company Description
CEVA, Inc. is a prominent licensor of wireless connectivity and smart sensing technologies, catering to semiconductor and original equipment manufacturer (OEM) companies globally. Founded in 1999 and headquartered in Rockville, Maryland, CEVA specializes in designing and licensing digital signal processors, AI processors, and a variety of complementary software solutions. The company operates predominantly in the semiconductor industry, positioning itself as a key player with a diversified portfolio that spans hardware, software, and integrated IP solutions. CEVA’s technologies are essential for numerous applications, including mobile, IoT, automotive, and robotics. As a leader in innovation, CEVA plays a critical role in shaping the future of smart technology across various sectors.
Fundamental Analysis
In this section, I will provide a fundamental analysis of CEVA, Inc., focusing on its income statement, financial ratios, and dividend payout policy.
Income Statement
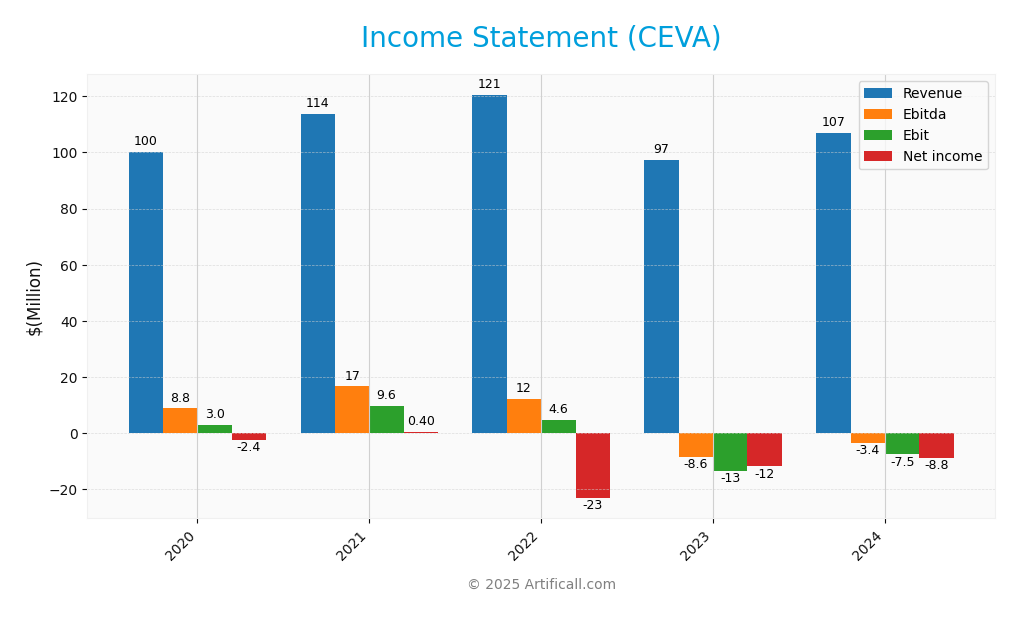
The following table presents the Income Statement for CEVA, Inc. over the last five fiscal years, highlighting key financial metrics such as Revenue, Costs, and Net Income.
| Metric | 2020 | 2021 | 2022 | 2023 | 2024 |
|---|---|---|---|---|---|
| Revenue | 100.3M | 113.8M | 120.6M | 97.4M | 106.9M |
| Cost of Revenue | 10.7M | 10.4M | 15.1M | 11.6M | 12.8M |
| Operating Expenses | 90.3M | 96.4M | 101.6M | 99.2M | 101.7M |
| Gross Profit | 89.6M | 103.5M | 105.5M | 85.8M | 94.2M |
| EBITDA | 8.8M | 16.6M | 12.2M | -8.6M | -3.4M |
| EBIT | 2.9M | 9.6M | 4.6M | -13.5M | -7.5M |
| Interest Expense | 0.4M | 0.4M | 0.4M | 0 | 0 |
| Net Income | -2.4M | 0.4M | -23.2M | -11.9M | -8.8M |
| EPS | -0.11 | 0.017 | -1.00 | -0.51 | -0.37 |
| Filing Date | 2021-03-01 | 2022-03-01 | 2023-03-01 | 2024-03-07 | 2025-02-27 |
Interpretation of Income Statement
Over the past five years, CEVA, Inc. has experienced fluctuations in Revenue, peaking in 2022 at 120.6M before declining to 106.9M in 2024. Net Income has been persistently negative, with the company reporting a loss of 8.8M in the latest fiscal year, showing a slight improvement from 11.9M in 2023. Gross profit margins have remained relatively stable, indicating consistent cost control despite revenue volatility. The latest year’s performance suggests ongoing challenges, with an EBITDA loss reflecting operational difficulties and a need for strategic adjustments to enhance profitability moving forward.
Financial Ratios
The following table summarizes the key financial ratios for CEVA, Inc. over the past few fiscal years.
| Ratios | 2020 | 2021 | 2022 | 2023 | 2024 |
|---|---|---|---|---|---|
| Net Margin | -2.37% | 0.32% | -17.22% | -12.19% | -8.22% |
| ROE | -0.91% | 0.14% | -8.96% | -4.49% | -3.30% |
| ROIC | 0.25% | 0.05% | 6.88% | -10.82% | -8.56% |
| P/E | -422.81 | 2491.65 | -25.57 | -44.90 | -84.79 |
| P/B | 3.86 | 3.57 | 2.29 | 2.02 | 2.79 |
| Current Ratio | 5.95 | 5.33 | 5.34 | 7.79 | 7.09 |
| Quick Ratio | 5.95 | 5.33 | 5.34 | 7.79 | 7.09 |
| D/E | 0.03 | 0.03 | 0.04 | 0.02 | 0.02 |
| Debt-to-Assets | 2.85% | 2.54% | 3.14% | 2.12% | 1.79% |
| Interest Coverage | -1.72 | 3.63 | -1.11 | 0 | 0 |
| Asset Turnover | 0.33 | 0.37 | 0.44 | 0.32 | 0.34 |
| Fixed Asset Turnover | 6.03 | 7.87 | 7.75 | 7.11 | 8.43 |
| Dividend Yield | 0 | 0 | 0 | 0 | 0 |
Interpretation of Financial Ratios
Analyzing CEVA, Inc.’s financial ratios for FY 2024 reveals several areas of concern. The liquidity ratios are strong, with a current ratio of 7.09 and a quick ratio of 7.09, indicating ample short-term assets to cover liabilities. However, the solvency ratio is alarming at -0.11, suggesting that the company may struggle to meet long-term obligations. Profitability ratios are also weak, with a net profit margin of -8.22%, indicating ongoing losses. Efficiency ratios such as receivables turnover (2.87) and inventory turnover (0) highlight potential issues in asset management. Overall, while liquidity appears robust, the negative profitability and solvency ratios raise significant concerns about CEVA’s financial health.
Evolution of Financial Ratios
Over the past five years, CEVA’s financial ratios have shown a downward trend in profitability, with net profit margins declining from positive territory to -8.22% in FY 2024. Conversely, liquidity ratios have remained relatively stable, indicating a consistent ability to cover short-term liabilities despite worsening financial performance.
Distribution Policy
CEVA, Inc. does not pay dividends, reflecting its focus on reinvestment strategies amidst ongoing growth challenges. The company’s negative net income indicates a need for capital preservation rather than shareholder payouts. However, CEVA is actively engaging in share buybacks, signaling confidence in its long-term potential. This approach, while potentially beneficial, must be carefully monitored to ensure it aligns with sustainable value creation for shareholders going forward.
Sector Analysis
CEVA, Inc. is a key player in the semiconductor industry, specializing in wireless connectivity and smart sensing technologies. Its competitive edge lies in its innovative DSP and AI processors for diverse applications, facing competition from major semiconductor firms.
Strategic Positioning
CEVA, Inc. operates in the competitive semiconductor market, focusing on wireless connectivity and smart sensing technologies. With a market cap of approximately $552M and a stock price of $23, CEVA has carved out a substantial share in niches like 5G baseband processing and AI integration. However, the company faces competitive pressure from larger firms and emerging startups, as well as potential technological disruptions in AI and IoT sectors. Its adaptability and focus on innovation will be crucial in maintaining its position amidst these challenges.
Revenue by Segment
The following chart illustrates CEVA, Inc.’s revenue by segment for the fiscal year 2024, highlighting key areas of growth and performance.
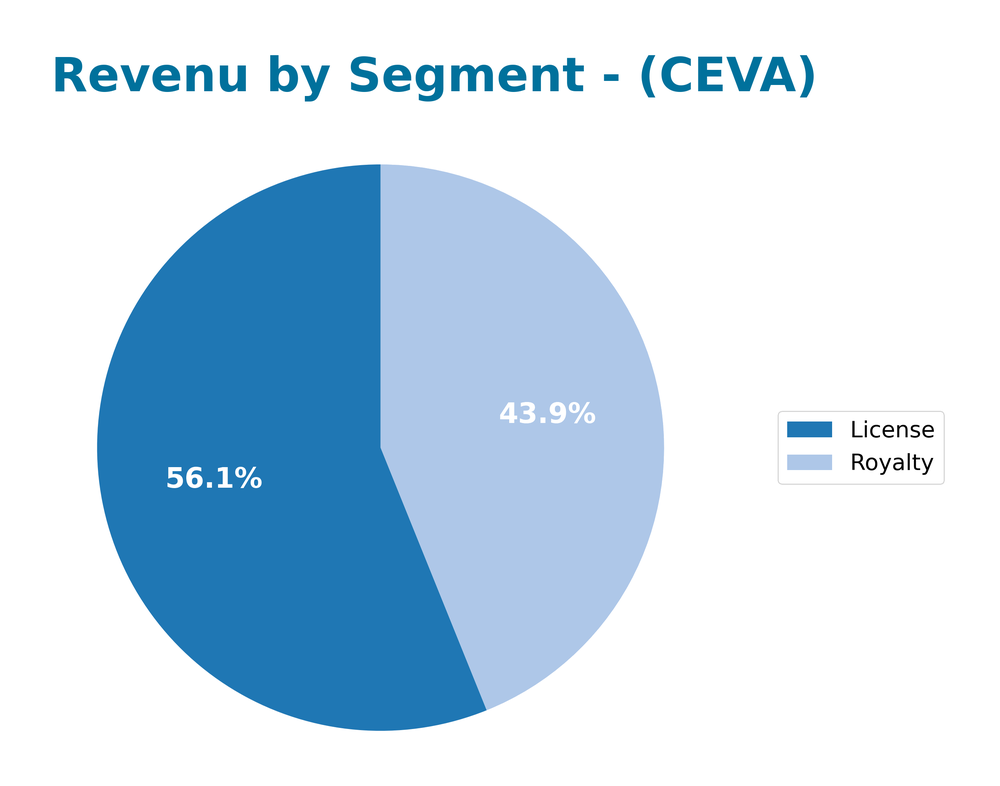
In fiscal year 2024, CEVA’s revenue showed significant contributions from the License segment, generating 60M, and the Royalty segment at 47M. Compared to 2023, where License revenue was 58M and Royalty was 40M, this indicates a positive trend overall. The most recent year’s performance saw a notable increase in the Royalty segment, indicating a possible shift in business strategy or market demand. However, growth may be tempered by concentration risks if reliance on these segments increases without diversification.
Key Products
CEVA, Inc. specializes in a range of advanced technologies that cater to the semiconductor industry. Below is a table summarizing some of their key products:
| Product | Description |
|---|---|
| 5G Baseband Processor | A digital signal processor designed for mobile and IoT applications, enabling high-speed 5G connectivity. |
| AI Processor | An advanced chip architecture focused on artificial intelligence applications, enhancing machine learning capabilities. |
| Wireless Connectivity Platforms | Integrated solutions for Bluetooth, Wi-Fi, and Ultra-wideband communications, tailored for IoT devices. |
| Sensor Fusion Software | Software that combines data from various sensors to improve accuracy and performance in applications like wearables and AR/VR. |
| Imaging and Computer Vision | DSP solutions that enhance image processing capabilities for camera-enabled devices, optimizing performance in photography and video. |
| Voice Input Technology | Tools for voice recognition and processing, designed for smart home devices and other voice-activated systems. |
These products illustrate CEVA’s commitment to providing cutting-edge technologies that support a wide array of applications across various sectors, including mobile, IoT, automotive, and robotics.
Main Competitors
The competitive landscape in the semiconductor industry is diverse, featuring several key players that are actively engaging in technological advancements.
| Company | Market Cap |
|---|---|
| ChipMOS TECHNOLOGIES Inc. | 1B |
| SkyWater Technology, Inc. | 862M |
| Arteris, Inc. | 767M |
| Aehr Test Systems | 742M |
| PowerFleet, Inc. | 704M |
| Cognyte Software Ltd. | 626M |
| Ichor Holdings, Ltd. | 606M |
| Wolfspeed, Inc. | 571M |
| CEVA, Inc. | 552M |
| Ambiq Micro, Inc. | 531M |
| POET Technologies Inc. | 513M |
The main competitors in the semiconductor sector, especially focusing on wireless connectivity and smart sensing technologies, include established firms like ChipMOS TECHNOLOGIES and SkyWater Technology. The market operates primarily in North America but has a global reach as these companies serve various international clients.
Competitive Advantages
CEVA, Inc. holds a notable position in the semiconductor industry through its diverse portfolio of wireless connectivity and smart sensing technologies. The company specializes in digital signal processors and AI solutions, catering to various sectors like mobile, IoT, and automotive. Looking ahead, CEVA’s investment in next-generation technologies such as 5G and advanced computer vision presents significant growth opportunities. Furthermore, expanding into emerging markets and enhancing its product offerings can position CEVA favorably against competitors, making it a compelling choice for investors focused on innovation and market leadership.
SWOT Analysis
This SWOT analysis provides a strategic overview of CEVA, Inc., highlighting its strengths, weaknesses, opportunities, and threats in the semiconductor industry.
Strengths
- Strong market position
- Diverse technology portfolio
- Experienced management team
Weaknesses
- High dependency on licensing revenue
- Limited brand recognition
- Volatile market demand
Opportunities
- Growth in IoT and AI sectors
- Expansion into new markets
- Strategic partnerships with OEMs
Threats
- Intense competition in semiconductor industry
- Rapid technological changes
- Economic downturns impacting spending
Overall, CEVA, Inc. possesses a solid foundation to leverage growth opportunities in emerging markets while being mindful of its weaknesses and external threats. A focus on innovation and strategic alliances will be crucial for sustaining its competitive advantage.
Stock Analysis
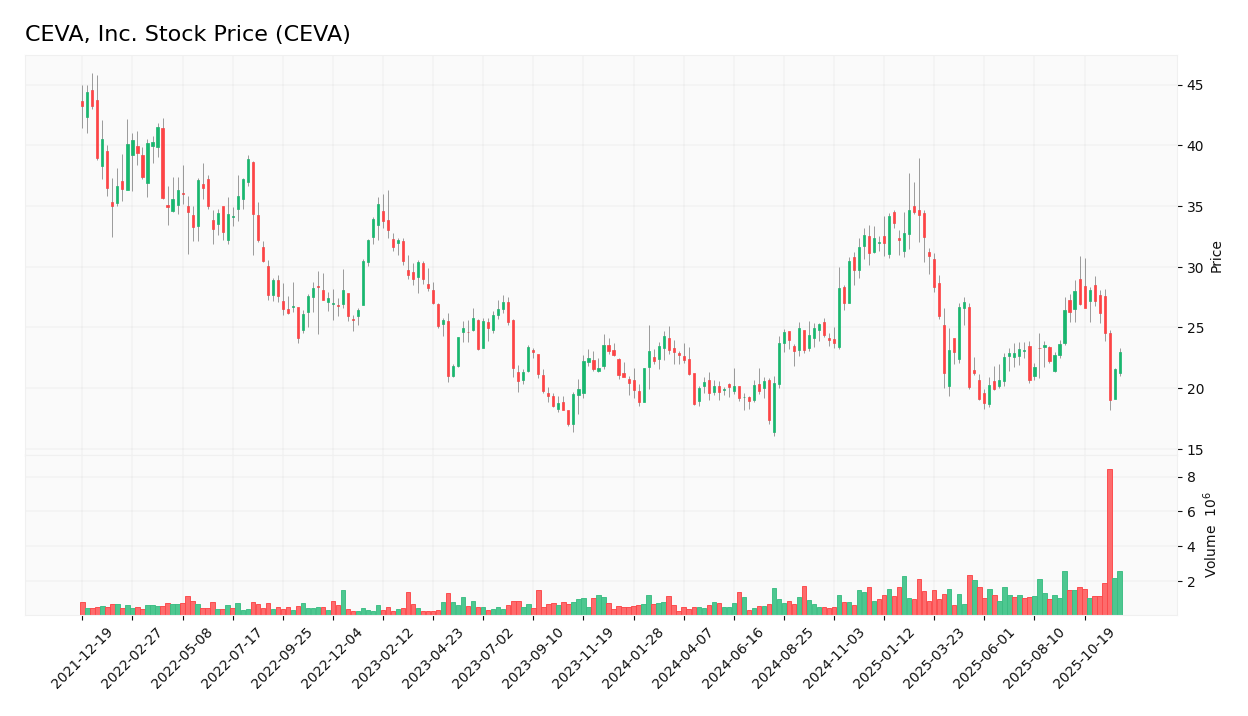
Over the past year, CEVA, Inc. has experienced notable price movements, culminating in a current bullish trend characterized by a 10.05% increase in stock price. This analysis will delve into the dynamics shaping its stock performance and trading behavior.
Trend Analysis
Analyzing CEVA’s stock trend over the past year reveals a price increase of 10.05%. Given this percentage change exceeds the +2% threshold, we classify the trend as bullish. However, it is important to note that the trend is showing signs of deceleration, with a standard deviation of 4.46 indicating some volatility. The highest price reached during this period was 34.67, while the lowest was 17.39.
In a recent analysis from September 21, 2025, to December 7, 2025, there was a decline of 12.94%, which suggests a bearish sentiment in the short term. The trend slope during this period was -0.55, reflecting a downward movement.
Volume Analysis
In the last three months, the total trading volume for CEVA has reached 132.08M, with seller-driven activity characterized by 69.31M in seller volume compared to 62.25M in buyer volume. Despite this, the overall volume trend is increasing, indicating heightened market participation.
Currently, the buyer dominance percentage stands at 36.47%, suggesting that sellers have been more active recently. This seller-dominant behavior signals a cautious investor sentiment, potentially reflecting uncertainty in the market’s outlook for CEVA.
Analyst Opinions
Recent evaluations for CEVA, Inc. have yielded a mixed outlook. Analysts have assigned a B- rating, indicating a cautious approach. The discounted cash flow analysis shows promise, but concerns linger regarding return on equity and price-to-earnings metrics, highlighted by analysts such as Morgan Stanley and J.P. Morgan. While the debt-to-equity ratio appears favorable, the overall sentiment leans towards a hold position rather than a strong buy. As it stands, the consensus for this year leans towards holding rather than buying or selling.
Stock Grades
CEVA, Inc. has received consistent evaluations from recognized grading companies. Here are the latest grades:
| Grading Company | Action | New Grade | Date |
|---|---|---|---|
| Barclays | maintain | Overweight | 2025-11-12 |
| Rosenblatt | maintain | Buy | 2025-11-11 |
| Rosenblatt | maintain | Buy | 2025-08-14 |
| Oppenheimer | maintain | Outperform | 2025-05-09 |
| Rosenblatt | maintain | Buy | 2025-05-08 |
| Barclays | maintain | Overweight | 2025-05-08 |
| Rosenblatt | maintain | Buy | 2025-04-23 |
| Barclays | maintain | Overweight | 2025-02-14 |
| Rosenblatt | maintain | Buy | 2025-02-14 |
| Rosenblatt | maintain | Buy | 2025-02-11 |
The overall trend indicates a strong buy sentiment from Rosenblatt and a stable overweight rating from Barclays. This consistency suggests confidence in CEVA’s prospects among analysts.
Target Prices
The consensus target price for CEVA, Inc. indicates a strong agreement among analysts.
| Target High | Target Low | Consensus |
|---|---|---|
| 28 | 28 | 28 |
Overall, analysts expect CEVA’s stock to reach a target price of 28, reflecting a stable outlook.
Consumer Opinions
Consumer sentiment surrounding CEVA, Inc. reflects a dynamic mix of enthusiasm and caution, showcasing the diverse experiences of its users.
| Positive Reviews | Negative Reviews |
|---|---|
| “CEVA’s technology has significantly improved our product efficiency.” | “Customer service response times are frustratingly slow.” |
| “Innovative solutions that keep us ahead of the competition.” | “Pricing is higher compared to competitors.” |
| “User-friendly interfaces make integration seamless.” | “Occasional software glitches can disrupt operations.” |
Overall, consumer feedback indicates that CEVA, Inc. excels in innovation and efficiency, while concerns about customer service and pricing persist as notable weaknesses.
Risk Analysis
In evaluating CEVA, Inc. (ticker: CEVA), it’s essential to understand the various risks that could affect your investment. Below is a table summarizing key risks.
| Category | Description | Probability | Impact |
|---|---|---|---|
| Market Volatility | Fluctuations in tech sector affecting stock price | High | High |
| Regulatory Changes | New regulations impacting operations and costs | Medium | High |
| Supply Chain Issues | Disruptions affecting product delivery and costs | Medium | Medium |
| Competition | Increased competition from emerging tech firms | High | Medium |
| Cybersecurity Threats | Risks associated with data breaches and attacks | Medium | High |
In my assessment, market volatility and regulatory changes are particularly significant risks for CEVA, given the current tech landscape and ongoing legislative focus on the industry.
Should You Buy CEVA, Inc.?
CEVA, Inc. has exhibited a negative profitability trend with a net income of -8.79M and a net profit margin of -0.082. The company is in a phase of value destruction, as its return on invested capital (ROIC) is -0.0856, significantly lower than its weighted average cost of capital (WACC) of 10.55. With a manageable debt level, reflected by a debt-to-equity ratio of 0.021, the fundamental metrics indicate mixed results. CEVA currently holds a rating of B-, which may suggest potential concerns regarding its financial health.
Favorable signals
In my analysis of CEVA, Inc., I have identified several favorable elements. The company has demonstrated a strong revenue growth of 9.77%, along with an impressive gross margin of 88.06%. Additionally, CEVA has shown a positive trend in gross profit growth at 9.79% and EBIT growth at 43.97%. The absence of interest expenses is another favorable aspect, which contributes positively to the overall financial health of the company.
Unfavorable signals
However, there are also significant unfavorable elements to consider. CEVA’s EBIT margin stands at -7.06%, and the net margin is -8.22%, indicating a negative performance in profitability. Furthermore, the return on invested capital (ROIC) is -8.56%, which is less than the weighted average cost of capital (WACC) at 10.55%, leading to value destruction. The company is also facing unfavorable ratios such as a -3.3% return on equity (ROE) and a current ratio of 7.09, which is concerning in the context of liquidity.
Conclusion
Given the favorable income statement indicators alongside the unfavorable ratios evaluation, it might appear prudent for long-term investors to exercise caution. The recent seller volume surpassing the buyer volume suggests that I might wait for buyers to return before making any decisions regarding investment.
Disclaimer: This article is not financial advice. Each investor is responsible for their own investment decisions.
Additional Resources
- Ceva-XC21 Named “Best IP/Processor of the Year” at EE Awards Asia – PR Newswire (Dec 05, 2025)
- With 77% ownership of the shares, CEVA, Inc. (NASDAQ:CEVA) is heavily dominated by institutional owners – Yahoo Finance (Dec 04, 2025)
- Ceva (NASDAQ: CEVA) named EE Awards Asia Best IP/Processor for Ceva-XC21 IoT DSP – Stock Titan (Dec 05, 2025)
- Loop Capital Initiates Coverage of CEVA (CEVA) with Buy Recommendation – Nasdaq (Dec 02, 2025)
- Icon Advisers Inc. Co. Purchases Shares of 58,100 Ceva, Inc. $CEVA – MarketBeat (Dec 01, 2025)
For more information about CEVA, Inc., please visit the official website: ceva-dsp.com