Home > Analyses > Energy > Centrus Energy Corp.
Centrus Energy powers the nuclear industry by supplying critical nuclear fuel and advanced technical services worldwide. Its flagship Low-Enriched Uranium segment drives core operations, while Technical Solutions fuels innovation in nuclear technology. Known for engineering excellence and strategic market influence, Centrus shapes energy security on a global scale. As the nuclear sector evolves, I question whether Centrus’s fundamentals still justify its current valuation and growth ambitions in this dynamic environment.

Table of contents
Business Model & Company Overview
Centrus Energy Corp., founded in 1998 and headquartered in Bethesda, Maryland, stands as a key player in the uranium sector. The company delivers a comprehensive ecosystem of nuclear fuel and related services, supporting utilities worldwide. Its dual-segment operation—Low-Enriched Uranium (LEU) and Technical Solutions—targets critical components and advanced engineering, meeting rigorous demands across the United States, Japan, Belgium, and beyond.
The company’s revenue engine balances sales of separative work units, natural uranium, and tailored technical services. This mix sustains recurring contracts in a capital-intensive market. Centrus leverages its global reach and specialized expertise to serve public and private clients. Its economic moat lies in its integrated supply chain and proprietary technologies, positioning it to influence nuclear power’s evolving landscape.
Financial Performance & Fundamental Metrics
I analyze Centrus Energy Corp.’s income statement, key financial ratios, and dividend payout policy to assess its underlying financial health and shareholder value.
Income Statement
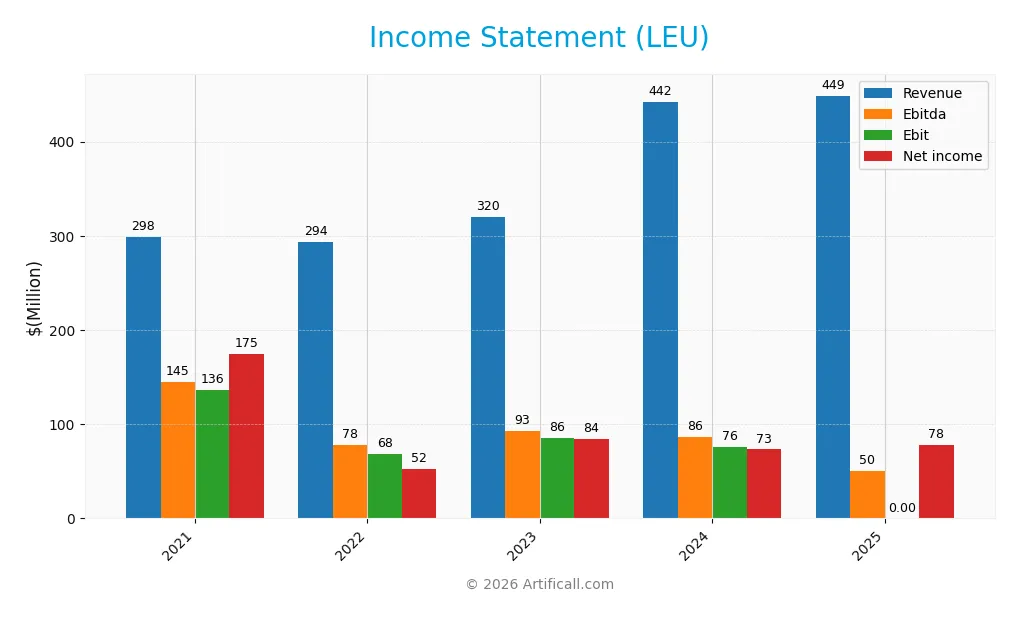
The table below presents Centrus Energy Corp.’s income statement data for the fiscal years 2021 to 2025, showing key financial metrics in USD.
| 2021 | 2022 | 2023 | 2024 | 2025 | |
|---|---|---|---|---|---|
| Revenue | 298.3M | 293.8M | 320.2M | 442.0M | 448.7M |
| Cost of Revenue | 183.8M | 175.9M | 208.1M | 330.5M | 331.2M |
| Operating Expenses | 46.2M | 58.2M | 59.7M | 63.5M | 36.2M |
| Gross Profit | 114.5M | 117.9M | 112.1M | 111.5M | 117.5M |
| EBITDA | 144.6M | 77.9M | 92.9M | 86.5M | 50.2M |
| EBIT | 136.0M | 68.3M | 85.8M | 75.7M | 0 |
| Interest Expense | 0.1M | 0.5M | 1.3M | 2.7M | 14.0M |
| Net Income | 175.0M | 52.2M | 84.4M | 73.2M | 77.8M |
| EPS | 10.03 | 3.47 | 5.55 | 4.49 | 4.33 |
| Filing Date | 2022-03-11 | 2023-02-22 | 2024-02-09 | 2025-02-07 | 2026-02-11 |
Income Statement Evolution
From 2021 to 2025, revenue grew 50.4%, reflecting strong top-line expansion. However, net income declined 55.5%, signaling profit pressure. Gross margin remained favorable at 26.2%, while net margin contracted 70.4%, indicating rising costs or inefficiencies. EBITDA and EBIT margins showed volatility, with EBIT margin falling to zero in 2025, highlighting profitability challenges.
Is the Income Statement Favorable?
In 2025, Centrus Energy’s revenue edged up 1.5%, but net income margin improved slightly to 17.3%. Interest expense was well controlled at 3.1% of revenue, a positive sign. However, EBIT margin dropped sharply to zero, a notable weakness. Overall, income fundamentals appear unfavorable due to declining profitability despite stable revenue growth.
Financial Ratios
The table below summarizes key financial ratios for Centrus Energy Corp. (LEU) over the fiscal years 2021 to 2025:
| Ratios | 2021 | 2022 | 2023 | 2024 | 2025 |
|---|---|---|---|---|---|
| Net Margin | 59% | 18% | 26% | 17% | 17% |
| ROE | -123% | -70% | 261% | 45% | 10% |
| ROIC | 37% | 17% | 15% | 6% | 2% |
| P/E | 3.8 | 9.1 | 9.8 | 14.8 | 56.1 |
| P/B | -4.7 | -6.4 | 25.6 | 6.7 | 5.7 |
| Current Ratio | 1.18 | 1.31 | 1.45 | 2.74 | 5.59 |
| Quick Ratio | 0.95 | 0.84 | 0.80 | 2.28 | 4.83 |
| D/E | -0.95 | -2.29 | 5.48 | 3.39 | 1.59 |
| Debt-to-Assets | 23% | 24% | 22% | 50% | 50% |
| Interest Coverage | 683 | 119 | 40 | 18 | 3.6 |
| Asset Turnover | 0.52 | 0.42 | 0.40 | 0.40 | 0.18 |
| Fixed Asset Turnover | 56.3 | 53.4 | 45.7 | 40.2 | 15.2 |
| Dividend Yield | 0% | 0% | 0% | 0% | 0% |
*Net Margin, ROE, and ROIC are expressed as percentages rounded to whole numbers for clarity.* *Negative values in P/B and D/E indicate negative equity or unusual capital structure.*
Evolution of Financial Ratios
The Return on Equity (ROE) declined sharply from negative levels in 2021 to a moderate 10.17% in 2025, reflecting improved but still modest profitability. The Current Ratio more than quadrupled to 5.59 in 2025, indicating increased liquidity but potential inefficiency. The Debt-to-Equity Ratio remained elevated at 1.59, suggesting sustained leverage with limited deleveraging.
Are the Financial Ratios Favorable?
In 2025, profitability shows mixed signals: net margin is favorable at 17.34%, but ROIC at 2.2% trails the WACC of 8.13%, marking an unfavorable return on capital. Liquidity is uneven; the quick ratio is favorable at 4.83, while the high current ratio of 5.59 signals potential asset inefficiency. Leverage is unfavorable with a 1.59 debt-to-equity ratio and zero interest coverage, highlighting financial risk. Market multiples including P/E and P/B ratios are elevated, further reinforcing an overall unfavorable financial profile.
Shareholder Return Policy
Centrus Energy Corp. does not pay dividends, reflecting a strategic choice likely tied to reinvestment or growth priorities. The company has no dividend payout ratio or yield and does not report share buyback programs.
This approach may support long-term shareholder value by preserving capital for operational needs or investments. However, absence of direct returns requires investors to rely on capital appreciation, emphasizing the importance of monitoring future cash flow and capital allocation.
Score analysis
The following radar chart presents a comprehensive view of Centrus Energy Corp.’s key financial metric scores:
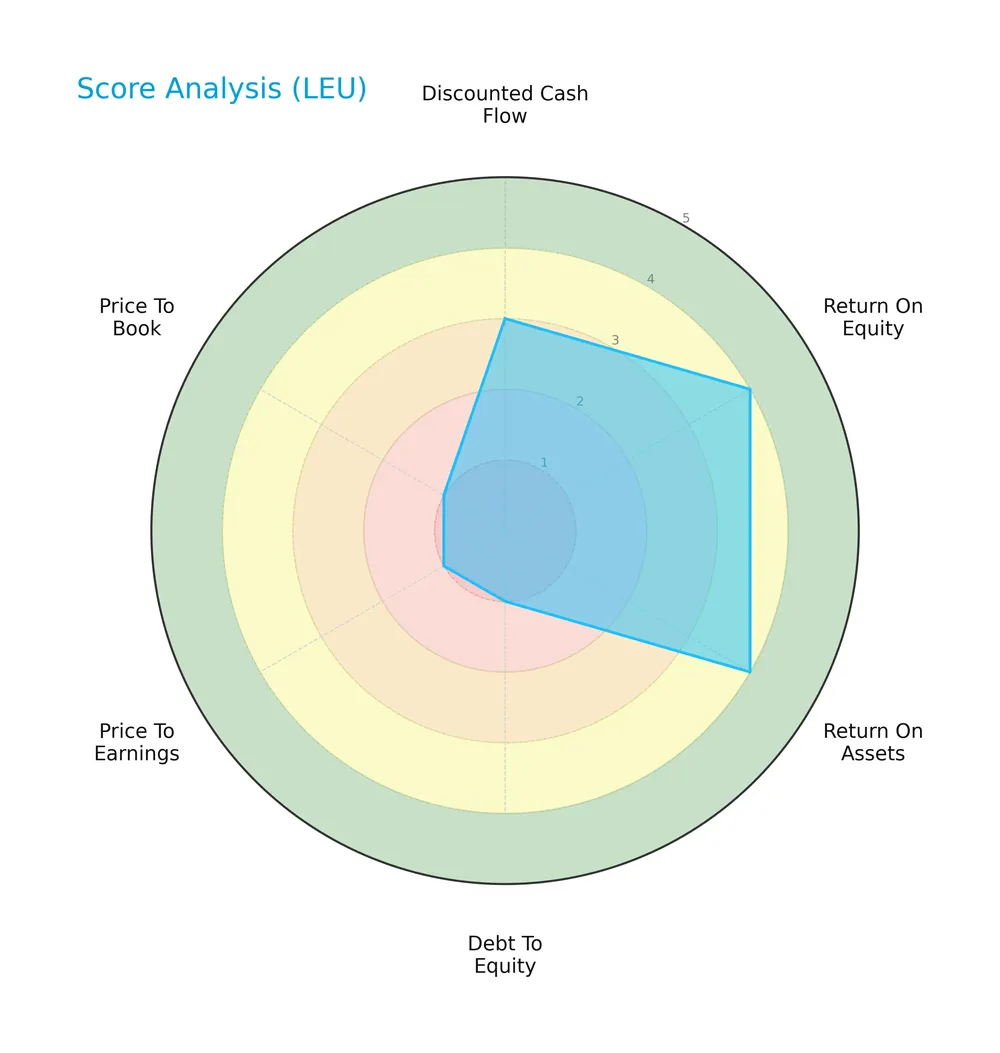
The company shows favorable returns on equity and assets, scoring 4 in both. However, the debt-to-equity ratio, price-to-earnings, and price-to-book scores are very unfavorable at 1. The discounted cash flow score stands at a moderate 3.
Analysis of the company’s bankruptcy risk
Centrus Energy’s Altman Z-Score places it in the grey zone, indicating a moderate risk of bankruptcy:

Is the company in good financial health?
This Piotroski diagram highlights Centrus Energy’s financial health based on key accounting criteria:

With a Piotroski Score of 5, the company’s financial health is average, suggesting neither strong nor weak fundamentals according to this measure.
Competitive Landscape & Sector Positioning
This sector analysis explores Centrus Energy Corp.’s strategic positioning, revenue segments, key products, and main competitors. I will assess whether Centrus holds a competitive advantage within the uranium industry.
Strategic Positioning
Centrus Energy Corp. concentrates on nuclear fuel supply, emphasizing Low-Enriched Uranium and Technical Solutions segments. Its revenue heavily relies on the U.S. market, supplemented by significant exposure in Japan and Europe, reflecting a focused yet internationally diversified footprint in the uranium industry.
Revenue by Segment
This pie chart illustrates Centrus Energy Corp.’s revenue distribution by product segments for the fiscal year 2025, highlighting the relative contribution of each business area.
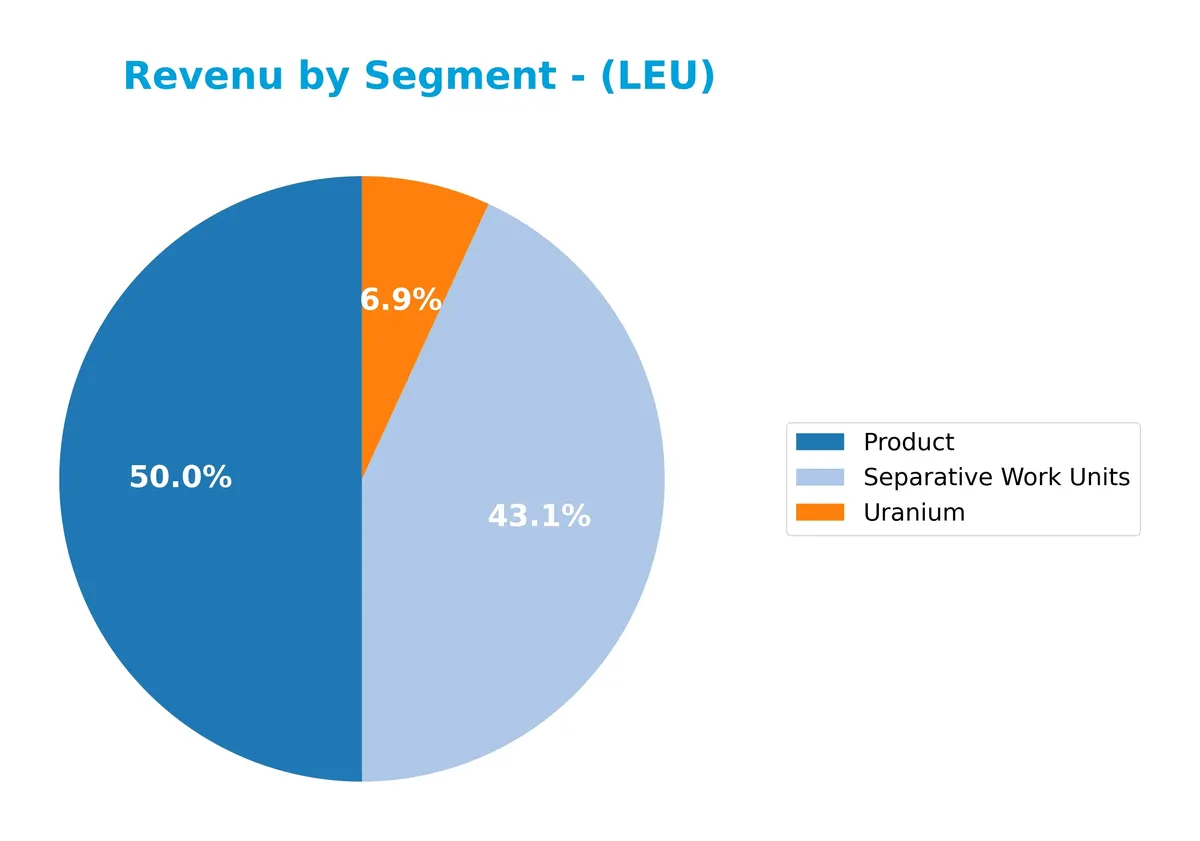
In 2025, Product revenue leads with $346M, closely followed by Separative Work Units at $299M, indicating stable demand in core offerings. Uranium, at $48M, shows a diminished role compared to prior years. The slight decline in Product revenue from 2024’s $350M suggests a modest slowdown. Separative Work Units’ growth from $247M in 2024 to $299M signals increasing operational focus, while Uranium’s drop raises concentration risk concerns.
Key Products & Brands
Centrus Energy Corp.’s key products and brands focus on nuclear fuel components and technical services:
| Product | Description |
|---|---|
| Separative Work Units | Component of low-enriched uranium (LEU) sold to utilities operating nuclear power plants. |
| Uranium | Natural uranium supplied to nuclear power utilities. |
| Service / Technical Solutions | Engineering, manufacturing, procurement, construction, and operations services, including American Centrifuge activities. |
Centrus Energy primarily generates revenue from separative work units and uranium sales. Its technical solutions segment supports nuclear industry infrastructure and innovation.
Main Competitors
Centrus Energy Corp. faces competition from 10 main players in the uranium sector, with the following top 10 leaders by market capitalization:
| Competitor | Market Cap. |
|---|---|
| Cameco Corporation | 39.8B |
| NexGen Energy Ltd. | 6.0B |
| Uranium Energy Corp. | 5.6B |
| Centrus Energy Corp. | 4.2B |
| Energy Fuels Inc. | 3.5B |
| Denison Mines Corp. | 2.4B |
| Ur-Energy Inc. | 507M |
| IsoEnergy Ltd. | 499M |
| Uranium Royalty Corp. | 471M |
| enCore Energy Corp. | 464M |
Centrus Energy ranks 4th among its peers. Its market cap is 9.23% of the leader Cameco Corporation. The company is below the average market cap of the top 10 uranium firms but above the sector median. It maintains a 53.53% market cap gap from its closest competitor above, showcasing a solid mid-tier position.
Comparisons with competitors
Check out how we compare the company to its competitors:
Does Centrus Energy Corp. have a competitive advantage?
Centrus Energy Corp. does not present a competitive advantage. Its return on invested capital (ROIC) significantly lags behind its weighted average cost of capital (WACC), indicating value destruction and declining profitability.
Looking ahead, Centrus serves nuclear fuel markets in the US, Japan, Belgium, and internationally. Opportunities lie in expanding technical solutions and engineering services, although current financial trends suggest challenges in sustaining economic moats.
SWOT Analysis
This analysis highlights Centrus Energy Corp.’s key internal and external factors shaping its strategic position.
Strengths
- Strong market presence in US nuclear fuel supply
- Favorable net margin of 17.3%
- High current ratio signaling liquidity buffer
Weaknesses
- Declining ROIC well below WACC signals value destruction
- Unfavorable EBIT margin at 0%
- Overvalued multiples with PE of 56 and PB of 5.7
Opportunities
- Growing demand for clean nuclear energy globally
- Expansion potential in Japan and Belgium markets
- Technical Solutions segment with engineering and construction capabilities
Threats
- Regulatory risks in nuclear industry
- High debt-to-equity ratio of 1.59 increases financial risk
- Competition from alternative energy sources and uranium suppliers
Centrus shows solid profitability but struggles with capital efficiency and valuation. Strategic focus must target improving operational returns and managing leverage while capturing growth in international nuclear markets.
Stock Price Action Analysis
The weekly stock chart for Centrus Energy Corp. (LEU) illustrates significant price fluctuations and recent downward movement:
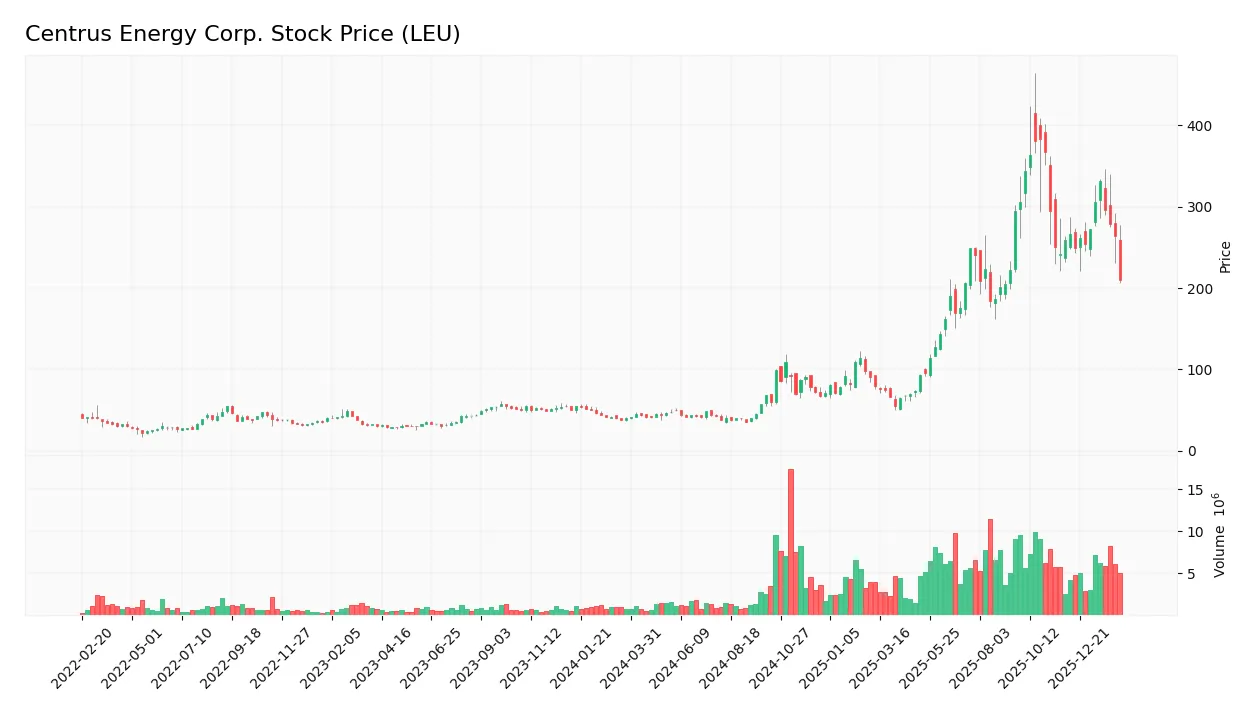
Trend Analysis
Over the past 12 months, LEU’s stock surged 420.58%, confirming a strong bullish trend despite deceleration in momentum. The price ranged from a low of 35.36 to a high of 383.0, with volatility reflected in a 100.91 standard deviation. The recent three-month trend shows an 18.95% decline, indicating short-term weakness.
Volume Analysis
Trading volume over the last three months increased, but shifted to slight seller dominance with buyers accounting for 46.15%. This volume pattern suggests cautious investor sentiment and a moderate rise in market participation amid recent price declines.
Target Prices
Analysts set a broad but optimistic target price range for Centrus Energy Corp.
| Target Low | Target High | Consensus |
|---|---|---|
| 137 | 390 | 290.8 |
The target prices suggest strong upside potential, reflecting confidence in the company’s strategic positioning within the energy sector.

Don’t Let Luck Decide Your Entry Point
Optimize your entry points with our advanced ProRealTime indicators. You’ll get efficient buy signals with precise price targets for maximum performance. Start outperforming now!
Analyst & Consumer Opinions
This section reviews analyst ratings and consumer feedback to provide an objective view of Centrus Energy Corp.’s market perception.
Stock Grades
Here are the latest verified stock grades for Centrus Energy Corp. from reputable analysts:
| Grading Company | Action | New Grade | Date |
|---|---|---|---|
| JP Morgan | Maintain | Neutral | 2026-02-05 |
| Roth Capital | Maintain | Neutral | 2026-01-08 |
| B. Riley Securities | Maintain | Buy | 2025-12-22 |
| Needham | Maintain | Buy | 2025-12-22 |
| UBS | Maintain | Neutral | 2025-11-25 |
| JP Morgan | Maintain | Neutral | 2025-11-07 |
| JP Morgan | Maintain | Neutral | 2025-10-31 |
| HC Wainwright & Co. | Maintain | Buy | 2025-08-26 |
| Evercore ISI Group | Maintain | Outperform | 2025-08-08 |
| JP Morgan | Maintain | Neutral | 2025-08-07 |
The consensus leans toward a Hold rating, reflecting a cautious market stance. Buy and Outperform grades appear consistently but do not dominate the overall neutral trend.
Consumer Opinions
Consumers of Centrus Energy Corp. express a mix of optimism and concern, reflecting the company’s complex position in the energy sector.
| Positive Reviews | Negative Reviews |
|---|---|
| Reliable supply chain and consistent delivery | High pricing compared to competitors |
| Strong commitment to clean energy initiatives | Customer service response times are slow |
| Innovative technology improving efficiency | Limited transparency on environmental impact |
Overall, consumers praise Centrus Energy for its reliability and innovation. However, pricing and customer service responsiveness remain notable pain points. This feedback signals areas for Centrus to strengthen customer relations and cost management.
Risk Analysis
Below is a summary table identifying key risks for Centrus Energy Corp. (LEU) and their likelihood and potential impact:
| Category | Description | Probability | Impact |
|---|---|---|---|
| Market Volatility | Stock price range wide from $49.4 to $464.25, recent drop 21% | High | High |
| Financial Leverage | Debt-to-equity ratio at 1.59 signals elevated financial risk | Moderate | High |
| Profitability | ROIC (2.2%) below WACC (8.13%) indicating poor capital returns | Moderate | Moderate |
| Liquidity | Current ratio 5.59 flagged unfavorable, but quick ratio strong | Low | Moderate |
| Credit Risk | Interest coverage ratio at zero poses risk of default | Moderate | High |
| Valuation | High P/E (56.06) and P/B (5.7) ratios suggest overvaluation | High | Moderate |
| Bankruptcy Risk | Altman Z-score 2.59 places company in grey zone for distress | Moderate | High |
The most pressing risks combine high leverage, zero interest coverage, and a distressed Altman Z-score. These raise concerns about Centrus Energy’s capacity to service debt amid volatile uranium markets. The steep 21% stock price fall in 2026 underlines investor caution. Elevated valuation multiples further caution against exuberant entry at current levels. I urge investors to monitor debt servicing closely and weigh market volatility in this cyclic sector.
Should You Buy Centrus Energy Corp.?
Centrus Energy Corp. appears to be navigating a challenging phase with declining operational efficiency and a very unfavorable moat, indicated by deteriorating ROIC versus WACC. Despite a manageable leverage profile, valuation metrics suggest caution. The overall B- rating reflects moderate financial resilience amid mixed profitability signals.
Strength & Efficiency Pillars
Centrus Energy Corp. posts a favorable net margin of 17.34%, demonstrating operational profitability despite challenges. The company’s return on equity stands at a neutral 10.17%, while return on invested capital (ROIC) is weak at 2.2%, trailing the weighted average cost of capital (WACC) at 8.13%. This indicates that Centrus is currently not a value creator. Gross margin at 26.19% reflects decent cost control, but EBIT margin at 0% signals operational inefficiency.
Weaknesses and Drawbacks
Centrus Energy sits in the Altman Z-Score grey zone at 2.59, indicating moderate bankruptcy risk that investors cannot ignore. Its valuation is stretched, with a high price-to-earnings ratio of 56.06 and price-to-book at 5.7, suggesting overvaluation relative to earnings and book value. The debt-to-equity ratio is elevated at 1.59, increasing financial leverage risk. Additionally, the current ratio appears anomalously high at 5.59 but is flagged unfavorable, potentially indicating inefficient asset utilization. Recent market activity shows slight seller dominance (46.15% buyer volume), adding short-term pressure.
Our Final Verdict about Centrus Energy Corp.
Despite operational profitability and a bullish long-term stock trend, Centrus Energy’s moderate solvency risk and stretched valuation metrics suggest caution. The company’s profile might appear speculative due to financial leverage and value destruction indicated by ROIC below WACC. Recent seller pressure further supports a wait-and-see approach for better entry points. Investors should weigh these risks carefully against potential rewards.
Disclaimer: This content is for informational purposes only and does not constitute financial, investment, or other professional advice. Investing in financial markets involves a significant risk of loss, and past performance is not indicative of future results.
Additional Resources
- Centrus Energy Stock Sinks After Q4 Earnings — Here’s Why – Benzinga (Feb 10, 2026)
- Centrus Energy Corp. (LEU) Misses Q4 Earnings Estimates – Yahoo Finance (Feb 10, 2026)
- CENTRUS ENERGY CORP SEC 10-K Report – TradingView (Feb 11, 2026)
- Centrus Energy taps Fluor for Ohio uranium plant expansion (LEU:NYSE) – Seeking Alpha (Feb 11, 2026)
- Centrus Reports Fourth Quarter and Full Year 2025 Results and Provides 2026 Guidance – Investing News Network (Feb 10, 2026)
For more information about Centrus Energy Corp., please visit the official website: centrusenergy.com